YouTube'dan Mağaza ile ilgili eğitici videoları izleyin
Bir alım-satım robotu veya gösterge nasıl satın alınır?
Uzman Danışmanınızı
sanal sunucuda çalıştırın
sanal sunucuda çalıştırın
Satın almadan önce göstergeyi/alım-satım robotunu test edin
Mağazada kazanç sağlamak ister misiniz?
Satış için bir ürün nasıl sunulur?
MetaTrader 5 için Uzman Danışmanlar ve göstergeler - 164
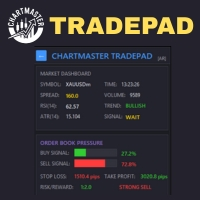
Take control of your trading with ChartMaster TradePad – a powerful all-in-one trading panel designed to simplify order execution, risk management, and market analysis. Whether you’re a scalper, day trader, or swing trader, ChartMaster TradePad gives you the speed, clarity, and precision you need to maximize your trading performance. Key Features Market Dashboard Real-time Market Data : Symbol, spread, RSI(14), ATR(14), trend direction, volume, and trading signals at a glance. Clear Trend & S

Order Block Pro (MQL5) – Sürüm 1.0 Yazar: KOUAME N'DA LEMISSA
Platform: MetaTrader 5 Açıklama: Order Block Pro , grafiğinizdeki boğa ve ayı emir bloklarını (Order Blocks) otomatik olarak tespit eden gelişmiş bir göstergedir. Konsolidasyon mumlarını ve ardından gelen güçlü impuls mumlarını analiz ederek, fiyatın hızlanabileceği kritik bölgeleri belirler. Bu gösterge, şunları yapmak isteyen traderlar için idealdir: Kesin giriş ve çıkış noktalarını belirlemek Dinamik destek ve direnç bölgelerini t

Meta Cipher A: Fiyat Hareketi İçin Hassas Üst Katman Göstergesi Meta Cipher A , popüler Market Cipher A konseptini MetaTrader 5’e yüksek hassasiyetli bir üst katman göstergesi olarak getiriyor. Fiyat grafiğinde erken sinyalleri doğrudan göstermek için tasarlanmış olup, 8 EMA şeridi , WaveTrend analizi ve sekiz farklı sinyal türünü birleştirerek işlem girişlerini, çıkışlarını ve yüksek riskli bölgeleri henüz oluşmadan önce tespit etmenize yardımcı olur. Meta Cipher A tek başına güçlüdür, ancak da
Genel Bakış
"TS-MA4F", ekonomik göstergeler üzerindeki etkisi sınırlı olan kaynak zengini ülkelerin temsili para birimi olan AUDCAD'a muhalif bir yaklaşım benimseyen uzun vadeli bir tutma EA'sıdır.
Bu strateji, aralık oluşturma eğiliminde olan döviz çiftlerinin düzenliliğine dayanır ve mantığı basit ve doğaldır.
Herhangi bir grid, martingale veya hedge yoktur ve TP ve SL'nin ayarlandığı tamamen tek pozisyonlu bir sistemdir, dolayısıyla risk sınırlıdır. Bu EA, pazarı ele geçirmesinin yanı sır
Gold Zenith — altın (XAUUSD) için premium EA Gold Zenith — altın (XAUUSD) için premium EA Gold Zenith , XAUUSD (altın) için güçlü ve disiplinli bir algoritmadır. Riskli yöntemleri (grid, martingale vb.) kullanmaz ve her işlem zarar durdur (SL) ile korunur. Mantık: trend hareketini tespit eder ve geri çekilmelerde (pullback) işlem açar; sinyal başına yalnızca tek pozisyon açılır. Karmaşık kurulum yok — varsayılan ayarlar canlı kullanım için hazırdır: EA’yı grafiğe bırakın ve başlayın. Neden güven
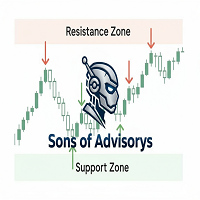
Sons of Advisorys: QuantumLevel This advanced MT5 Expert Advisor automates trading decisions based on a robust Support and Resistance breakout and retest strategy. It performs multi-timeframe analysis across H4, H1, and M15 charts to identify high-probability trade setups with precise zone validation. Key Features: Strategy: Support/Resistance breakout with retest continuation. Multi-Timeframe Detection: Independent analysis and toggle options for H4, H1, and M15 timeframes. Auto-Trading:

Overview
Yellow Brick Road for XAUUSD H1 is a purpose-built Expert Advisor that pairs a robust, discretionary-style algorithm with an embedded AI engine. It validates signals, studies trend development, and adapts parameters to your broker’s XAUUSD feed. The goal is a professional workflow that enforces discipline and repeatability—without promises or hype.
Architecture & Execution
The system runs on MT5 hedging accounts with unique magic numbers per strategy, so every position is isolated and

Quantum Flow Scalper - Yüksek Frekanslı Scalping Sistemi AÇIKLAMA Bu, işlem seansı boyunca küçük ve sık karlar hedefleyen MetaTrader 5 için yüksek frekanslı bir scalping Uzman Danışmanıdır. EA, her iki yönde eş zamanlı olarak fiyat hareketlerini yakalayabilen alış ve satış yönleri için çift scalping motoru ile çalışır. Sistem, küçük fiyat hareketlerini yakalamak için işlem günü boyunca birden fazla pozisyon açarak scalping operasyonları için tasarlanmıştır. TEMEL İŞLEVSELLİK Yüksek Frekanslı İşl
Regression analysis Candles EA used regress equation degree 5 and equation line from two lower points and two high points draw two straight lines. It make four trends to compare for determine buy/sell orders. we put pending order buy limit/buy stop or sell limit/sell stop when has order. we has limit order least than 99 orders. we close all orders has ten cases it chooses to variable market we has C.V. parameter and we have many functions used in system. we divide our system to four modules. The

Here’s a clear logic explanation and EA introduction in English, formatted in Markdown for easy reading: EA Introduction: Tri_SMA The Tri_SMA Expert Advisor (EA) is a trend-following system that uses three Simple Moving Averages (SMA) for entry signals, stop-loss placement, and trade filtering.
It is designed for single-position control , ensuring only one trade is open per symbol at a time. Trading Logic Entry Conditions Long (Buy): Short SMA is rising ( SMA1 > SMA1_previous ). SMA orde
Expert Advisor that leverages Keltner Channel signals, established by an exponential moving average and an ATR indicator, to enter trades confirmed by an ADX indicator. Trade exits occur when the ADX signal is indicated or, if configured, when the midline is broken at the close of the candle. It features a stop-loss mechanism with a percentage change in price and a mechanism for scaling the lot as the balance increases. Learn what parameters are with better performance for each symbol in the st

Gold ECN EA, piyasa belirsizliklerini analiz eden gelişmiş yapay zeka algoritmalarıyla tasarlanmıştır. Haber güncellemelerine uyum sağlayabilen ve piyasa değişiklikleri sabit kaldıkça dinamik olarak hareket edebilen makine öğrenimi sistemleriyle geliştirilmiştir.
Öngörücü yapay zeka ile senkronize olarak, bir makine öğrenimi algoritması, belirli bir süre içinde piyasanın aşırı yüksek dip noktalarını, daha yüksek tepe noktalarını, daha düşük tepe noktalarını ve daha düşük dip noktalarını tespit

Title: EMA Cross RSI TurboTrader – Professional MT5 EA with Safe Stops & AutoLot Short Description:
Experience professional trading with EMA Cross RSI TurboTrader – a smart MT5 EA designed for trend following, scalping, and capital protection . Features Safe Stops, AutoLot, Trailing Stop, and Market-Safe Gap for maximum reliability. Full Description: Welcome to the next level of automated trading! Unlock Your Trading Potential with EMA Cross RSI TurboTrader! Experience the n

O Scartrader é um robô de day trade desenvolvido para o Mini-Índice da B3, combinando os indicadores Williams %R, Z-Score e Filtro VHF com uma camada adicional de análise de correlação entre ativos , garantindo assertividade nas operações. Sua arquitetura inclui gestão de risco , com stop dinâmico, limite diário de perdas e controle de exposição por operação. A correlação pode ser realizada em diversos ativos: dólar, ações, ETF, juros futuros DI. A estratégia foi validada em backtests extensos ,

Ratio X Freshbot Gold EA — Akıllı Trend ve Momentum Sistemi
Ratio X Freshbot Gold EA , XAUUSD (Altın) işlemleri için H1 ve H4 zaman dilimlerinde titizlikle tasarlanmış tamamen otonom bir alım-satım sistemidir. Mimarisi, trend tahmini ve momentum onayı nı birleştirerek çok katmanlı teknik analizleri tutarlı ve disiplinli bir yürütme çerçevesine entegre eder. Sistem, yön önyargısı için Üssel Hareketli Ortalamalar (50 EMA ve 200 EMA) , güç doğrulaması için RSI ve momentum onayı için MACD kullanır
Strivex Supply/Demand Göstergesi (MetaTrader 5) Strivex Algo’nun Supply/Demand göstergesi, önemli arz ve talep bölgelerini otomatik olarak tanımlar, piyasa yapısı kırılmalarını (BOS) işaretler ve yatırımcıyı gerçek zamanlı olarak bilgilendirir.
Özel bir özellik: Grafik zaman dilimini değiştirseniz bile bölgeler korunur. Örneğin, M15 grafiğinde H1 bölgelerini yeniden çizim veya silme olmadan görüntüleyebilirsiniz.
Ana Özellikler Swing zirve ve diplerine dayalı otomatik bölge tespiti Sadece
EURUSD_Gangorra_Risk Açıklaması EURUSD_Gangorra_Risk – M30 karşı trend robotu, konfluans filtreleri ve % risk yönetimi ile Genel Bakış EURUSD_Gangorra_Risk , EURUSD M30 için tasarlanmış profesyonel bir mean-reversion (karşı trend) EA ’dır (parametre ayarları ile diğer pariteler/ZF’lerde de kullanılabilir).
Fiyatın destek/direnç bölgelerine (Donchian/Bollinger) yaklaşmasını veya dokunmasını algılar ve girişleri ayarlanabilir konfluanslarla (RSI, EMA’ya ATR bazlı uzaklık, H1 karşı trend filtres

New Release Promotion!
Gold Algonomics is launching with a limited-time discount : Starting Price: $200 Price Increases: +$100 every 8 purchases (to preserve exclusivity and maintain a market edge) Final Price: $2,000 After your purchase, please contact me directly — I will personally provide the set files and a list of the trusted brokers that helped me achieve financial independence and early retirement. Special Giveaway: Every buyer during the release promotion automatically partic

ScalpingThink – Scalping’de Hassasiyet ScalpingThink, hızlı hareketler ve hassas girişler hedefleyen traderlar için geliştirilmiş yenilikçi bir çift yönlü scalping sistemidir. Hedef: Kısa sürede doğru kurulumlarla kontrollü kazançlar – güvenli ve verimli. Hemen deneyin – Ücretsiz Demo
Fiyat artmadan önce sadece 169 USD promosyon fiyatıyla şimdi edinin!
Güncel fiyat 169 USD Sinyal: Bağlantı Kılavuz: Bağlantı Avantajlarınız Grid yok, Martingale yok – her pozisyon tek tek ve kontrollü olar

Support Resistance Catcher Indicator Features and Explanation
Overview: The Support Resistance Catcher is a custom MT5 indicator designed to identify and visualize supply (resistance) and demand (support) zones based on candlestick price action. It detects zones where price has reversed after rallies or drops, using wick rejections and clustering. The indicator draws horizontal rectangles for active and historical zones, with customizable colors, labels, and alerts.
Key Features:
1. Zone Det

IBOV Dip Buyer EA Açıklaması IBOV Dip Buyer EA – B3 (Brezilya) hisseleri için akıllı alım satım robotu Genel Bakış
IBOV Dip Buyer EA, özellikle Brezilya borsası (B3 – IBOVESPA) için geliştirilmiş profesyonel bir otomatik işlem robotudur.
EA, hisselerdeki günlük düşüşleri tespit eder ve iki kanıtlanmış kurulum (setup) temelinde işlemleri gerçekleştirir.
Tüm ayarlar basit bir CSV dosyası aracılığıyla yapılır; böylece her bir hisse senedi için kişiselleştirilmiş parametrelerle kolayca yönetim

FLEQBA Pro – Gösterge Açıklaması Bu gösterge MetaTrader 5 kullanıcıları için tasarlanmıştır ve kendi işlemlerinizi veya robotlarınızın işlemlerini geçmişte ve gerçek zamanlı olarak görsel şekilde izlemenizi sağlar.
Grafiksel gösterim, stratejinizin veya robotunuzun performansını yalnızca sayısal verilerle kıyaslandığında çok daha anlaşılır ve net hale getirir. Gösterge sadece verileri göstermekle kalmaz; bunları analiz eder, değerlendirir ve istatistikler oluşturur ve bu verilere grafik üzerinde

80% off for 2026 new year gift
GoldenAegis: Prop Şirketi Sınavları İçin Uzmanlaşmış Altın EA'sı Nirvana serisinin önde gelen bir Uzman Danışmanı (EA) olan GoldenAegis, özellikle Altın (XAUUSD) işlemleri ve prop şirketi sınavlarını geçmeyi hedefleyen yatırımcılar için tasarlanmış sistematik bir işlem aracıdır. Temel Strateji ve Felsefe Bu EA, on yılı aşkın piyasa tecrübesinin bir ürünüdür. Temel felsefesi, test edilmiş ve disiplinli bir işlem stratejisini otomatikleştirerek duygusal karar verm

Algo Octa - Indicateur d'Analyse Technique Avancé Indicateur professionnel combinant ZigZag, SAR parabolique, canaux de tendance et niveaux de Fibonacci pour une analyse technique complète. if you don't understand how to use Technical Support via product feedback or MQL5 messaging system.
Fonctionnalités Principales Analyse Multi-Composants
ZigZag coloré avec détection automatique des extremums Intégration du SAR parabolique pour la confirmation de tendance Création automatique de canau

MetaTraderPro Premium Indicator (MT5) The MetaTraderPro Premium Indicator is designed to clearly and objectively identify potential entry and exit points in the market. With signals displayed directly on the chart, it provides practicality and agility to support decision-making. Key Advantage: the indicator does not repaint and does not recalculate after the candle closes, ensuring consistent and reliable signals. Features: Buy and sell arrows directly on the chart No repainting or rec

Trend-following Expert Advisor that acts based on Ichimoku indicators, programmed to respond for identify strong trend moments and ensure greater precision in entry decisions for better perfomance in ops. It features optional stop-loss control based on the percentage of price change, or "stop and reverse" between these moments, and lot scaling based on balance growth. Learn what parameters are with better performance for each symbol in the strategy tester and find a good linear regression making

Total opened lots calculation & Average price show on chart. You can manage lots size it's helpful who opened many lots in different price leval and it's shows Average price of lots.it's indicator not EA. Available only Mt5. Attach on chart which open positions pairwhich you want to calculate and want to know all lots average price. Excellent indicator which may help to controls your lots size.

MultiChart Pro – MetaTrader 5 için Grafik Yönetim Aracı Bu Uzman Danışman (EA), MetaTrader 5’te grafiklerin açılmasını ve yapılandırılmasını otomatikleştirir. Belirli zaman dilimleri ve şablonlarla en fazla dört grafik ayarlamayı destekler; çevrimdışı grafikler dahil. Özellikler Grafik Açma: En fazla üç ek grafik (ör. D1, M1, M15) ve bir çevrimdışı grafik (ör. 10 saniye) açar ve mevcut grafiği (ör. M5) yapılandırır. Şablon Uygulama: Her grafiğe kullanıcı tanımlı şablonları uygular ve mevcut olup

SR POC VOLUME göstergesi, MetaTrader 5 için tasarlanmış olup, kullanıcı tarafından yapılandırılabilir bir geriye dönük süre boyunca mum verilerinden Kontrol Noktalarını (POC) tanımlamak, gruplamak ve görselleştirmek için kullanılır. Bu göstergenin amacı, birikmiş hacim ve delta dağılımına dayalı olarak destek ve direnç bölgelerini yapılandırılmış bir şekilde belirleyerek, traderların piyasada önemli ilgi alanlarını daha iyi anlamalarını sağlamaktır. Temel Fonksiyonlar POC Hesaplama Gösterge, bel

ABCD Lemissa + Aylık Seviyeler + PinBar + Marubozu Açıklama Bu gösterge, birden fazla güçlü aracı birleştirerek piyasayı görsel olarak analiz etmenizi sağlar: ABCD Lemissa – ABCD yapısını otomatik olarak algılar ve A, B, C, D noktalarını, destek/direnç bölgelerini ve alım/satım oklarını gösterir. Aylık Seviyeler (Monthly Levels) – Aylık mumların High, Low, Open, Close seviyelerini göstererek önemli bölgeleri belirler. PinBar & Marubozu – PinBar mumları (dönüş sinyalleri) ve Marubozu mumları (

Trend-following Expert Advisor that operates with the Stoch and Parabolic SAR indicators during periods of volatility monitored by Bollinger Bands, based on the percentage between the upper and lower bands. It always favors a strong trend, as indicated by its RSI indicator and the expected increase between candles. It also includes optional stop-loss control based on the percentage of price changes, or "stop and reverse," between these periods of volatility, and lot scaling based on the balance

This is the Goldborg Gold EA. It trades on the XAUUSD chart in the 1H timeframe. This EA is optimized for the Broker ICTrading only! NO MARTINGALE OR GRID The signal is a combination of both Stonks Go Up EA and Goldborg (both EAs that I sell). The price will be changed to $500 each if the signal hits 210%!
https://www.mql5.com/en/signals/2322075?source=Site
So get the power duo until the price increases! : https://www.mql5.com/en/market/product/135150?source=Site+Market+MT5+Expert+Search+Rat

Fusion Monthly Levels + PinBar + Marubozu Açıklama
Bu benzersiz gösterge, üç güçlü teknik analiz aracını tek bir göstergede birleştirir: Aylık Seviyeler (High, Low, Open, Close) – önemli destek ve direnç bölgelerini belirlemek için. PinBar Tespiti – fiyat reddini gösteren güvenilir bir dönüş mum modeli. Marubozu Tespiti – güçlü trend mumları ile yönlü momentum gösterir. Bu birleşim sayesinde, görsel, kapsamlı ve hızlı tepki veren bir piyasa tahmin aracına sahip olursunuz. Avantajlar Kurum

Golden pot pro - Expert Advisor Professional Trading System for Gold (Limited time offer- just $99) Golden pot pro is a sophisticated Expert Advisor designed for serious traders who want automated, intelligent trading with advanced risk management. This EA combines multiple proven technical indicators with smart position management to deliver consistent performance in various market conditions.This Ea works well with M10 and H1 time frames This EA uses a carefully optimized trading algorithm
FROZEN EMA SCALPER
Frozen EMA Scalper is an advanced moving average indicator designed specifically for scalping in financial markets.
Key Features:
Optimized 200-period for greater stability and accuracy Clear visual signals with directional arrows (green for buy, blue for sell) Dynamic color change of the EMA line based on the market trend Professional interface with customizable background for better visibility Designed for multiple timeframes Competitive Advantages:
Reduces market noise

Support: Profit Smasher 24/7 AI Assistant Disclaimer Liquidity Mapper Pro is an analytical tool for educational and informational purposes only.
It does not provide financial advice or guaranteed signals.
All trading carries risk, including potential loss of capital.
Past performance does not guarantee future results.
You are solely responsible for your trading decisions.

Dinamik RSI Koruyucusu – Hassas İşlem ve Tam Risk Yönetimi Dinamik RSI Koruyucusu, tutarlı performans, sıkı risk kontrolü ve esnekliği önemseyen yatırımcılar için tasarlanmış profesyonel bir algoritmik işlem sistemidir. Gelişmiş pip tabanlı hesaplamalar ve RSI odaklı akıllı filtreler üzerine inşa edilmiştir; her işlem, riskleri en aza indirirken fırsatları en üst düzeye çıkarmak için sıkı kurallara uyar. Temel Özellikler : Akıllı Giriş Sistemi
• RSI tabanlı çoklu filtre onayı
• Yüksek olas
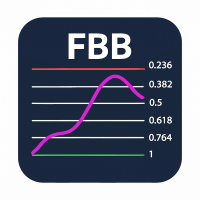
Fibonacci Bollinger Bands Indicator for MT5 The Fibonacci Bollinger Bands Indicator for MetaTrader 5 (MT5) is a powerful trading tool that combines the strength of Bollinger Bands with Fibonacci retracement levels . Since price often reacts strongly to Fibonacci levels, this indicator helps traders identify high-probability reversal zones and breakout opportunities. Key Features & Inputs Bollinger Bands Length – customizable parameter for band calculation.
Price Mode Selection – choose from C

Inteligencia viacerých objednávok – Systém postupne pridáva pozície na základe delta analýzy. Nie náhodne, ale keď sa hybnosť vyvíja správnym smerom. Maximálne 4 objednávky na pár s inteligentnou správou veľkosti lotu. Profesionálny analytický panel – monitorovanie všetkých aktívnych párov v reálnom čase, analýza ziskov a strát, ukazovateľ rizika a sledovanie výkonnosti. Presne vidíte, čo sa s každým párom deje. Pokročilá logika uzatvárania – 6 nezávislých podmienok uzatvárania: trailing

Lansman Satışı: Sadece ilk 10 kişi için. Özel Fiyat: $30 (Normal: $40). Kalan: 10 Görünürlüğü artırmak için ilk 10 alıcıya bu indirimi sunuyorum.
"Geçmiş grafikleri gerçek zamanlı hareketle yeniden oynatın"
Chart Auto Flow, geçmiş grafikleri değişken hızda ve mum çubuğu bazında oynatmanıza ve geri sarmanıza olanak tanıyan bir doğrulama destek aracıdır. Sadece durağan grafiklere bakmak yerine, hareketleri gerçek zamanlıya daha yakın bir şekilde yeniden üretebilir, böylece pratiğe daha yakın an

Genisys FX - Advanced Trading System with Multi-Layer Adaptive Technology Developed by Rayden Labs Srl - Innovation and Precision in Algorithmic Trading KEY FEATURES Feature Description Adaptive Dynamic Grid Technology Automatically modifies multiplier, distance, and take profit based on market conditions and number of open positions. Hybrid Scalping + Progressive Position Recovery System Maximizes profits in strong trends and manages drawdown with progressive layers and adjustable parameters
Slayer Scalper V75. Slayer Scalper V75 is an advanced technical indicator designed specifically for high-precision scalping. It uses a dynamic adaptive channel algorithm that identifies optimal entry and exit points on short timeframes.
Key Features: Clear visual signals: Green arrows for buy and red arrows for sell. Dynamic Channels: Upper and lower levels that automatically adjust to market volatility. Configurable Parameters: Fully customizable Period (7) and Percentage (25%). Anti-Noise Al

ETE Detector – Head & Shoulders Indicator Turn your charts into clear and actionable trading opportunities! About the Indicator The ETE Detector automatically identifies Head & Shoulders (H&S) and Inverse Head & Shoulders (IH&S) patterns — classic trend reversal formations.
No more spending hours searching manually: your analysis becomes fast, accurate, and visual . What You Get Automatic detection of trend reversal patterns Colored arrows : green for buys (Inverse H&S), red for sell

Trend-following Expert Advisor that operates with exponential moving averages during periods of increasing price strength, monitored by an RSI indicator based on an increase, as well as trading volume, always in favor of the trend. It offers optional stop-loss control based on the percentage of price changes, or "stop and reverse," between these periods of strength, and lot scaling based on the balance's increase. Learn what parameters are with better performance for each symbol in the strategy

Commercial Description – Marubozu Pro (MT5) Description Marubozu Pro is a professional indicator for MetaTrader 5 that automatically detects Marubozu candles (bullish and bearish) directly on your chart.
It helps traders identify strong market momentum where buyers or sellers take full control, by displaying clear visual arrows for buy and sell signals. This tool is designed to be simple, effective, and fast , perfect for manual trading or as a filter in automated strategies. Key Features

Dear Traders, Are you tired of losing your way amid complex market fluctuations? Have you ever regretted missing key trend entry points? Now, we are proud to introduce our intelligent trading solution - 『Breakthrough King MT5』 Expert Advisor (EA). Designed specifically to capture market momentum, it integrates the classic "range breakout" strategy with rigorous risk management, aiming to automatically help you seize those most promising trend starts. The core logic of 『Breakthrough King MT5』 is

!! Welcome everyone to download and test it !!
How to achieve steady profits? I’ve backtested since 2005 with no account blow-ups. Note: you need USD 10,000, a 0.01 lot size, the EUR/USD pair, and a 1-minute chart. I haven’t tested other settings—be sure to follow these exactly. Martingale strategies are most vulnerable to blow-ups, but with this system, backtests across all historical periods showed no blow-ups. The key is that it’s stable in any period and any market. You can test it yourself

FlowMaster EA – Precision Trend Trading with EMA Logic FlowMaster EA is a fully automated trading system designed for traders who want structured setups, controlled risk, and consistency . Built on proven multi-EMA trend logic with intelligent candle confirmation, FlowMaster adapts to dynamic market conditions while enforcing disciplined risk-reward rules. This Expert Advisor automatically scans the charts, filters weak signals, and executes trades only when strong confluence appears – ensurin

FXGrowth2 – Automated Trading Strategy FXGrowth2 is an automated trading strategy developed with a primary objective: maximizing the return-to-drawdown ratio while maintaining strict risk control , with maximum account drawdown kept below 15% . To ensure robustness and consistency, the system has been backtested over 5 years of historical data across 28 currency pairs , derived from the 7 major currencies: USD, EUR, GBP, AUD, CAD, NZD, and JPY . Only when a currency pair meets our predefined per

Trend-following Expert Advisor that operates with the Parabolic SAR indicator during periods of volatility monitored by Bollinger Bands based on a percentage between the upper and lower bands, always in favor of the trend. It offers optional stop-loss control based on a percentage of price change or "stop and reverse" between these periods of volatility, and lot scaling based on the balance increase. Learn what parameters are with better performance for each symbol in the strategy tester and fi

Oracle Osilatör , teknik analizde gerçek bir devrimdir. Trader'ı RSI , Stokastik , Williams %R , DeMarker ve Laguerre Filtresi gibi birden fazla osilatörü aynı anda izlemeye zorlamak yerine, bu gösterge her birinin en iyi yönlerini tek bir hibrit çizgide ( DodgerBlue renginde) birleştirir. Bu çizgi, piyasa gürültüsünü filtrelerken gerçek hareketlere karşı reaktif olacak şekilde mükemmel bir şekilde kalibre edilmiştir ve bu sayede birçok trader'ı şaşırtan yanlış sinyalleri önler. Neden Her Bir Os

This Expert Advisor (EA) is an automated trading system designed for MetaTrader 5 (MT5). It eliminates emotional trading by executing trades based on predefined strategies and algorithms. The bot continuously monitors the market, identifies entry and exit opportunities, and manages risk with built-in money management rules. Key Features: Fully automated trading – no manual intervention required. Works 24/5 on MT5 platforms. Supports multiple currency pairs and timeframes. Risk managemen

The screenshot shows the settings for XAUUSD
Expert Advisor Description This Expert Advisor (EA) is designed for automated trading, with optimal performance on Gold (XAUUSD). It can also be applied to other currency pairs with proper tuning of the timeframe and stop-loss settings. The EA employs a robust trading strategy to identify market entry points, featuring dynamic lot sizing based on account balance or a fixed lot option. It includes risk management tools such as configurable stop-loss a

UT Bot Alerts with ATR Trailing Stop is a professional trading tool that automatically detects trend changes and generates precise buy/sell signals using a smart ATR-based trailing stop system. Key Benefits Smart Alert System - Instant notifications when trading opportunities appear - Multiple alert types: popup, sound, email, and mobile push - No duplicate alerts - prevents spamming - Customizable alerts for buy signals, sell signals, or both
Accurate Signal Detection - Dual confirmation syste

Trend indicators on the FOREX market are extremely useful for increasing your ability to open winning positions and for better anticipating market movements.
OPTIMISED TREND PRO is one of these indicators.
• SuperTrend PRO is available on MetaTrader 5 (MT5)
• Green/Red candles according to the trend, easy to read at a glance
• A single arrow at the start of each phase: BUY (green), SELL (red)
• The SuperTrend line helps set the stop and follow the position
• Usable on all FOREX symbols
•

IronBalance EA Description for MQL5 IronBalance EA is an advanced yet user-friendly Expert Advisor (EA) for MetaTrader 5, designed to automate trading with a focus on precision and risk management. Suitable for traders of all experience levels, this EA combines a proven counter-trend strategy with an intuitive visual dashboard that provides real-time trading performance insights. Manage your trading with confidence and ease! Key Features Counter-Trend Strategy : Identifies high-probability marke

An Expert Advisor that bases its behavior on the ADX trend indicator. Its period can be configured, and as an accessory, it can also incorporate verification of the trade to be carried out with a short-, medium-, and long-term EMA crossover before opening a new trade. It also has a stop-loss mechanism based on percentage changes in price and a system for scaling the lot as the balance increases. Learn what parameters are with better performance for each symbol in the strategy tester and find a

Precision WaveScalp Pro – Automated Scalping EA for XAUUSD Precision WaveScalp Pro is a state-of-the-art, fully customizable scalping EA, specifically designed for trading XAUUSD . By combining EMA , Bollinger Bands , and ATR , it identifies precise entry and exit points to capture quick profits in short-term trading. Thanks to its flexible parameter settings , the EA can be optimized for different market conditions. In a bullish market , different parameters may perform better than in a bearish
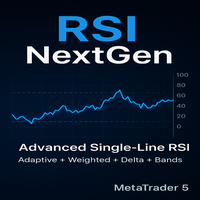
RSI NextGen Advanced RSI Indicator
The RSI NextGen is an advanced and modernized version of the classic Relative Strength Index (RSI). It comes with enhanced features that deliver far more accurate and reliable signals across different market conditions. This indicator has been designed to provide traders with a dynamic and adaptive view of overbought and oversold zones, instead of relying on the static and rigid settings of the traditional RSI.
Unlike the standard RSI, which is calculated us
Read detailed blogpost with screenshots here: https://www.mql5.com/en/blogs/post/764306
Note: This is the MT5 only version. The MT4 version is available here: https://www.mql5.com/en/market/product/149941
Features Kalman smoothing to reduce market noise. Supertrend bands for trend direction. Color-coded dots and arrows for quick reading. Arrow signals for trend continuation. Alerts for trend changes. Adjustable inputs for different styles.
How to Use
Green dots = bullish bias. Red dots = bea

Nova STM Trader is a disciplined automation combining the Stochastic and Simple Moving Average (SMA) indicators — blending momentum timing with trend direction for precise trading decisions. This EA acts only when both indicators align, ensuring trades occur during meaningful market moves rather than reacting to every fluctuation. Instead of chasing every swing, Nova STM Trader filters out weak signals. Trades are executed when Stochastic momentum confirms a potential move and the SMA trend ali

Nova KC Trader is a disciplined automation of the Keltner Channel — a volatility-based tool that defines dynamic upper, middle, and lower price levels to identify trend, breakout, and reversal opportunities. This EA interprets price action relative to the channel, executing trades only when movement confirms a meaningful interaction with the boundaries. Instead of reacting to every minor fluctuation, Nova KC Trader waits for structured setups: trades are taken when price respects or breaks the c

Nova PCH Trader is a disciplined automation of the Price Channel — a tool that tracks dynamic upper and lower boundaries to define market structure and potential breakout or reversal points. This EA interprets the channel to identify clear trading opportunities, acting only when price interacts meaningfully with the channel edges. Instead of reacting to every market fluctuation, Nova PCH Trader waits for structured setups: trades are executed when price respects or decisively breaks the channel,

Nova PAX Trader is a disciplined automation combining the Parabolic SAR and ADX (Average Directional Index) — blending trend direction, momentum, and timing into a structured trading system. This EA identifies setups where price is clearly trending and momentum is strong, using the Parabolic SAR for directional cues and ADX to confirm trend strength. Instead of reacting to every market fluctuation, Nova PAX Trader waits for clear alignment: trades are executed only when the Parabolic SAR indicat

StableRisk Manager, emir kontrolü için tasarlanmış bir yardımcı programdır. Emirler manuel olarak veya başka Uzman Danışmanlar (Expert Advisors) tarafından açılsa da, belirlenen kâr veya zarar yüzdesine ulaşıldığında EA tüm pozisyonları kapatır, gerekirse bekleyen emirleri siler ve grafik pencerelerini otomatik olarak kapatarak diğer EA’ların yeni işlemler açmasını engeller. Bu araç, özellikle birden fazla döviz çiftinde aynı anda Uzman Danışmanlarla veya manuel olarak işlem yapan yatırımcılar

Nova HAR Trader is a disciplined automation combining Heiken Ashi and the Relative Strength Index (RSI) — blending trend smoothing with momentum confirmation for precise trade execution. This EA analyzes Heiken Ashi candles to identify clear trend direction, while RSI confirms overbought or oversold conditions to filter entries and exits. Instead of reacting to every small swing, Nova HAR Trader waits for aligned signals: trades are taken only when Heiken Ashi shows a clear trend and RSI confirm

Nova DNA Trader is a disciplined automation combining the Donchian Channel and Alligator indicators — blending trend detection with dynamic support/resistance levels for structured trade entries. This EA identifies clear breakout and continuation setups by tracking price relative to the Donchian Channel while confirming trend direction using the Alligator’s jaws, teeth, and lips. Instead of reacting to every price movement, Nova DNA Trader waits for confirmed alignments: trades are taken only wh

Nova CAT Trader is a disciplined automation combining the Commodity Channel Index (CCI) and Average True Range (ATR) indicators — blending momentum, trend, and volatility into a structured trading system. This EA acts only when the CCI signals align with price volatility measured by the ATR, ensuring trades occur during meaningful market moves rather than random fluctuations. Instead of chasing every swing, Nova CAT Trader filters out weak setups. Trades are executed when momentum, trend, and vo

Nova MBB Trader is a disciplined automation combining the MACD and Bollinger Bands (BB) indicators — blending momentum, trend, and volatility into a structured trading system. This EA waits for the alignment of MACD signals with price behavior around the Bollinger Bands to identify high-quality entry opportunities. Instead of reacting to every market wiggle, Nova MBB Trader filters out noise, trading only when momentum, trend, and volatility all confirm the move. It focuses on setups with clear

Nova OET Trader is a disciplined automation combining the On-Balance Volume (OBV) and Exponential Moving Average (EMA) indicators — blending volume-based momentum with trend confirmation for clear, actionable trades. This EA waits for alignment between the OBV and EMA to identify setups where price moves are supported both by market participation and directional strength. Instead of reacting to every minor swing, Nova OET Trader filters out weak signals, entering trades only when both volume and
MetaTrader mağazasının neden alım-satım stratejileri ve teknik göstergeler satmak için en iyi platform olduğunu biliyor musunuz? Reklam veya yazılım korumasına gerek yok, ödeme sorunları yok. Her şey MetaTrader mağazasında sağlanmaktadır.
Alım-satım fırsatlarını kaçırıyorsunuz:
- Ücretsiz alım-satım uygulamaları
- İşlem kopyalama için 8.000'den fazla sinyal
- Finansal piyasaları keşfetmek için ekonomik haberler
Kayıt
Giriş yap
Gizlilik ve Veri Koruma Politikasını ve MQL5.com Kullanım Şartlarını kabul edersiniz
Hesabınız yoksa, lütfen kaydolun
MQL5.com web sitesine giriş yapmak için çerezlerin kullanımına izin vermelisiniz.
Lütfen tarayıcınızda gerekli ayarı etkinleştirin, aksi takdirde giriş yapamazsınız.