YouTube'dan Mağaza ile ilgili eğitici videoları izleyin
Bir alım-satım robotu veya gösterge nasıl satın alınır?
Uzman Danışmanınızı
sanal sunucuda çalıştırın
sanal sunucuda çalıştırın
Satın almadan önce göstergeyi/alım-satım robotunu test edin
Mağazada kazanç sağlamak ister misiniz?
Satış için bir ürün nasıl sunulur?
MetaTrader 5 için Uzman Danışmanlar ve göstergeler - 157

FA MiniFullIndexTrader: Scalper versátil para índices mini e completos Este Expert Advisor (EA) é uma estratégia de scalping automatizada para MetaTrader 5, otimizada para contratos de índice como WIN@, WINQ25, WINFUT e WIN$. Ele utiliza rompimentos diários para entradas rápidas, com gerenciamento de risco avançado para proteger o capital. Principais vantagens: Rentável e consistente: Em backtests, gera lucro líquido de até 14.310 pontos com fator de lucro de 1,44 e Sharpe 16,77 (alto retorno p

TrendAdvisor — MetaTrader 5 için yapılandırılmış trend işlemleri EA’sı.
EA, iki zaman diliminde yönü doğrular (varsayılan H4/H1 ), her sembol için tek pozisyon açar ve SL/TP ile Trailing Stop ile yönetir. Gerekirse grafikte ok sinyalleri çizer ( UseGraphics ). EA ne yapar? İki zaman diliminde yön teyidi ( tf1 , tf2 ayarlanabilir). Sembol başına tek pozisyon (ortalama yok, grid yok, martingale yok). Koruyucu seviyeler: SL , TP , Trailing Stop . Pozisyon açıkken tersine dönmez . Son kapanan mumda

Cypher Light – Intelligence and Precision on GBPUSD (H1) CypherLight is a completely free Expert Advisor, built to trade automatically on the GBPUSD pair using the 1-hour timeframe . What Makes CypherLight Unique Fully automated: identifies opportunities and executes trades with no manual input Neural network-based: learns from market behavior and adapts dynamically Uses a well-optimized combination of technical indicators for smart entries and exits Optimized for H1: perfect for short- to medi

ASCENDANT A Professional Trading Expert Advisor ASCENDANT is a precision-engineered Expert Advisor specifically optimized for the USDJPY currency pair on the 30-minute timeframe . This EA has been meticulously backtested and fine-tuned to capitalize on the unique price movements and volatility patterns of the USD/JPY market. Key Features: Pair-Specific Optimization : Exclusively designed and tested for USDJPY trading Timeframe Precision : Performs exceptionally on M30 charts for optimal

BRIEF INTRODUCTION : This panel is designed for the XAU/USD pair, offering a fully automated and manual trading solution with optional money management controls. The application operates seamlessly in all market conditions and includes a built-in indicators attached in the interface for real-time analysis.
KEY FEATURES :
- Martingale Strategy & Range Sequence Detection – Enhances trade recovery and identifies key price levels. - Multiple Indicators – Helps users anticipate future price

TitanEdge Gold Pro – Precision Engineered for Consistent Profitability
TitanEdge Gold Pro is a premium-grade automated trading system built for traders who demand performance, discipline, and stability. This expert advisor has been thoroughly tested on 5 years of historical data, showcasing an exceptional track record of profitability, risk control, and consistent growth in the gold market (XAUUSD).
Verified 5-Year Performance
$10,184 Net Profit on $5,000 starting balance
203% Total R

Scalper Master PRO - Multi-Strategy Scalping System Scalper Master PRO is an Expert Advisor that combines multiple trading strategies into a single system designed for high-frequency trading across various market conditions. Trading Strategies: Mean Reversion Strategy: Utilizes Bollinger Bands and RSI for trading range-bound market conditions. Market Maker Strategy: A liquidity-based strategy designed for spread capture and order flow analysis. Momentum Strategy: Uses MACD and volume conf

Smart Edge Analyzer — Edge Your Risk. Master Your Market.
Smart Edge Analyzer is a powerful fully automated trading robot designed for traders who want intelligent, precision-driven market entries — without lifting a finger.
Originally created as a manual signal tool, Smart Edge Analyzer has been fully upgraded to place real trades automatically based on advanced technical conditions. It combines robust market analysis with a smart execution engine that protects your capital while capturing

Aurelia — Breakout Expert Advisor for XAUUSD Aurelia is a professional gold trading algorithm that opens trades on support and resistance breakouts, using noise filtering, trailing, and time restrictions. Key Features: Trading based on support and resistance levels Precise filtering by UTC time (for example, from 19:00 to 11:00) Reliable protection system: stop loss, take profit, trailing Flexible risk and range settings Supports all timeframes Optimized for XAUUSD Important: Time-based trading

Bull Master EA - Multi-Strategy Moving Average Expert Advisor Bull Master EA combines seven distinct moving average strategies with advanced risk management and multi-timeframe analysis. Each strategy operates independently on your chosen timeframe for diversified trading opportunities. Complete Strategy Arsenal MA Alignment Trigger
Trades when multiple MAs are perfectly aligned with price confirmation. MA Cross Trigger
Classic crossover strategy with precision timing and confirmation. MA Ali

The Second-Level Tick Candlestick Generator is a professional-grade MT5 indicator tool specifically designed for high-frequency trading and short-term scalping. It can convert raw tick data into highly customizable second-level candlestick charts in real-time, helping traders accurately capture micro-market fluctuations and optimize entry and exit timing. This tool provides clear chart displays, allowing you to more intuitively identify price action patterns and improve trading decision efficien

*Author: LuongBK | Contact: Telegram/Zalo: 0366189998*
**Overview** GoldDowScalper is a powerful automated trading Expert Advisor (EA) designed for the XAUUSD (Gold) market, leveraging the Dow Theory combined with Volume and Exponential Moving Average (EMA) confirmations. This EA is optimized for scalping strategies, offering a robust and reliable approach to capitalize on short-term price movements. Version 2.1.1 introduces enhanced features and compatibility for MQL5 Market testing, maki

Altanex Trading EA Overview Altanex Trading EA is a fully automated MetaTrader 5 Expert Advisor designed for breakout trading using fractal-based signals. It uses pending orders to capture momentum after a breakout, integrates dynamic risk management, and supports both fixed and percentage-based position sizing.
Understanding the EA's Strategy The Altanex Trading EA is a breakout strategy that uses the Fractals indicator for its signals. It works by: Identifying a recent significant high (a fra
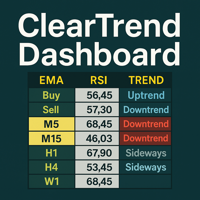
ClearTrend Dashboard Indicator V2.0 — Multi-Timeframe Trend Scanner
ClearTrend Dashboard Indicator V2.0 is an indicator for MetaTrader 5 that displays market trends across multiple timeframes in a single dashboard. It combines exponential moving average and relative strength index analysis to provide a clear and rapid overview of market conditions. if you do not understand how to use technical support via product feedback or the MQL5 messaging system.
Key Features Multi-timeframe analysis: M1,

Trend TD Ultimate — The All-in-One Trend Indicator for MetaTrader Trend TD Ultimate is a modern, all-in-one trend indicator for MetaTrader 5. It combines advanced trend-following logic, smart price pattern analysis, and integrated trade evaluation features — all in one powerful tool. It is built for traders who need accuracy, flexibility, and visual clarity — on forex, stocks, indices, commodities, and crypto . Key Features & Benefits 1. Multi-Purpose Trend Signal Engine Generates Buy and

Directional Trend Line — Directional Trend Indicator for MetaTrader
**Directional Trend Line** is a professional tool for traders that allows you to:
* Accurately determine the current market trend * Timely detect phase shifts in market structure * Clearly visualize the dominant price movement direction
### ** Key Features **
#### 1. ** Automatic Adaptation to Any Timeframe **
* Automatically adjusts the CCI period for M1…MN * Enables optimal sensitivity across different timeframes *

Visual Trend Reversals — Professional Trend Reversal Indicator for MetaTrader 5 Visual Trend Reversals is a modern and efficient indicator for MetaTrader 5, specifically designed for the timely identification of trend reversal points and analysis of market conditions on any instrument: forex, cryptocurrencies, stocks, indices, and commodities.
The indicator is optimized to improve entry quality, minimize false signals, and maximize clarity for traders of any experience level. Key Advantages of V

Fer Goldhunter works by opening trades in favor of the trend, using three moving averages and an ADX filter. The EA has dynamic lot size, increasing based on account growth; take profit, stop loss, and trailing stop options are optimized to deliver optimal results on an M15 timeframe with XAUUSD (Gold/Dollar).
Characteristics: The bot is optimized to work with XAUUSD on M15 timeframe. It can be optimized for use with other symbols.
Recommended balance: 50 USD with a CENT account 500 US

Sentinel AutoTrade: The Reversal System for AUDCAD M15 Sentinel AutoTrade is a powerful Expert Advisor (EA) engineered for precision and consistency on the AUDCAD M15 chart. It is a sophisticated automated system designed to capture market reversals and capitalize on price turning points. This EA is an ideal tool for traders seeking a reliable solution to generate consistent returns.
Key Features Reversal Trading Strategy: Sentinel AutoTrade uses an advanced strategy that identifies potential
Chart Changer – Switch Symbols with One Click Boost your trading efficiency by quickly switching between multiple charts without hassle. This lightweight indicator displays customizable buttons for your favorite symbols, letting you jump between charts instantly with a single click. Key Features: Supports a flexible list of symbols you can set up in seconds Customizable button design (colors, font size, spacing) Works seamlessly on any chart timeframe Saves time and improves workflow for active

BTC Reversal Flip Master EA — Akıllı BTC girişleri için modüler motor MetaTrader 5 için tasarlanmış BTC/USD sistemi. Sermaye koruması, istikrar ve denetlenebilirlik ön planda. Düşük riskli otomasyon arayanlar için ideal. Modüler risk filtreleri Sanal bakiye ile izole risk yönetimi Dinamik pozisyon büyüklüğü Hafta sonu öncesi otomatik pozisyon kapatma Optimize modları: Güvenli, Kârlı, Dengeli BTCUSD için M15/M30 önerilir Disclaimer: BTC Reversal Flip Master EA is a trading tool designed for Me

TrendFusion Pro — trend analiz aracı TrendFusion Pro, grafik analizlerinizi düzenlemenize yardımcı olur ve giriş noktalarını bulma sürecini basitleştirir. Piyasa gürültüsünü ortadan kaldırır ve yalnızca dahili analiz sistemine dayalı net sinyalleri gösterir. Özellikler:
Potansiyel giriş noktalarını gösteren ok sinyalleri.
Dahili bildirimler ve uyarılar.
Zayıf sinyalleri filtrelemek için çoklu zaman dilimi analizi.
Trend gücü değerlendirmesi ile daha bilinçli kararlar. Ana özellikler:

BB-Trader Pro: ปลดล็อกพลังการเทรดทำกำไรในทุกสภาวะตลาด! เบื่อไหม? กับ EA ที่ใช้ได้ดีแค่ในตลาดบางช่วง... พอตลาดเปลี่ยนจากมีเทรนด์เป็น Sideways สัญญาณก็เริ่มพลาด ล้างพอร์ตโดยไม่รู้ตัว ถึงเวลาแล้วที่จะปฏิวัติการเทรดของคุณด้วย BB-Trader Pro EA อัจฉริยะที่ถูกออกแบบมาให้ "คิดและปรับตัว" ได้เหมือนเทรดเดอร์มืออาชีพ! "สมองกลสองโหมด" กลยุทธ์ที่ไม่เคยหยุดนิ่ง หัวใจหลักของ BB-Trader Pro คือความสามารถในการวิเคราะห์ความผันผวนของตลาดจาก Bollinger Bands และปรับเปลี่ยนกลยุทธ์การเทรดโดยอัตโนมัติ โหมดเทรดปกติ (N

X Hunter V² – The Ultimate Gold Opportunity Hunter! Looking for a trading robot that delivers real results in the gold market? X Hunter V² is your strategic weapon for capturing exceptional opportunities on XAU/USD, powered by unmatched intelligence and precision. Please make sure to choose Original Strategy in the Inputs before launching the Expert. Why X Hunter V² Stands Above the Rest Elite Specialization: Trades exclusively on gold (XAU/USD) using the 30-minute timeframe for maximum accura
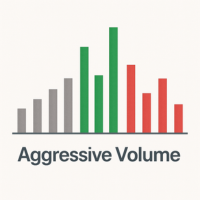
Aggressive Volume Real Tick + Opsiyonel Hareketli Ortalama Aggressive Volume Real Tick + Opsiyonel Hareketli Ortalama, mum yapısını ve gerçek veya tick hacmini analiz ederek agresif alım ve satım hacimlerini tespit eden profesyonel bir göstergedir. Traderların piyasadaki en güçlü baskıların nerede olduğunu net şekilde görmelerini sağlar ve hızlı, doğru kararlar almalarına yardımcı olur. Nasıl çalışır?
Gösterge, mum gövdesi ile toplam aralık arasındaki ilişkiyi analiz eder ve büyük gövdeli mum

NOT: USDJPY ve EURUSD paritelerinde kullanılması tavsiye edilir. ÖNERİLEN AYARLAR (USDJPY için): SLPOINTS (zarar durdurma): 1500 puan TPPOINTS (kar alma): 750 puan ÖNERİLEN AYARLAR (EURUSD için): SLPOINTS (zarar durdurma): 500 puan TPPOINTS (kar alma): 50 puan
Bu Uzman Danışman (Expert Advisor), ortalamaya dönüş (mean reversion) stratejisi üzerine kuruludur ve piyasa fiyat hareketlerini detaylı analiz etmek için birden fazla hareketli ortalama ile Göreceli Güç Endeksi (RSI) göstergesini bir ara

MetaTrader 5 Expert Advisor (EA) implementing a martingale strategy with flexible configuration.
The EA supports up to three currency pairs with user-defined lot sizes and trade directions. It allows setting thresholds (in pips or currency) for opening additional martingale layers, and provides options for closing positions by cycle rules (first layer only or all layers combined). The system can reverse direction after each completed cycle and includes a color-coded on-chart panel for monitoring

Hello, traders! I am GoldMartingale Pro – the ultimate Expert Advisor designed exclusively for trading GOLD (XAUUSD). My strategy is built on a refined Martingale system , carefully optimized for the gold market. I’ve been rigorously backtested on MetaTrader 5 for over 4 years , proving consistent performance across various market conditions. With my intelligent lot scaling and smart trade management, you can withdraw profits anytime , while I continue trading and recovering in the backgro

Ticaret avantajınızı artırın WaveTrend Oscillator Indicator MT5 ile, John Carter'ın ünlü TTM Squeeze stratejisinden esinlenen çok yönlü bir volatilite ve momentum aracı. 2000'lerin başında geliştirilen ve Thinkorswim ile TradingView gibi platformlar aracılığıyla popüler hale gelen bu gösterge, Bollinger Bantları ve Keltner Kanallarını birleştirerek "sıkışmalar"—düşük volatilite dönemlerini belirler ve potansiyel patlayıcı breakout'leri sinyaller. Dünya çapındaki trader'lar, forex, kripto paralar
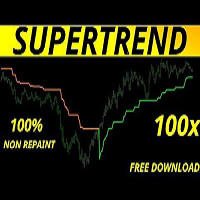
Purpose : The SuperTrend indicator tracks price trends, plotting a line that follows the trend direction (up or down) and optionally fills the area between the trend line and the closing price Plots : SuperTrend Line : A colored line (green for uptrend, red for downtrend) plotted below the price in uptrends and above in downtrends. Filling : Optional filled area (bisque/pale green) between the SuperTrend line and the closing price, shown only if Show_Filling is true. Logic : Calculates ATR usin
This EA does not perform trading operations. It's a auxiliary visual tool for graphics synchronization.
The “there are no trading operations” error in the validator is expected and intentional. CHARTCONNECT – Chart Synchronizer (Version 1.19) Connect all your charts to the same symbol with just one click.
What is CHARTCONNECT? ChartConnect is a lightweight and efficient tool designed to automatically synchronize the ticker symbol of all open charts in MetaTrader 5

Kullanım Kılavuzu: ISHEGUVE Crash Trader (ISHEGUVE Smart Trader'ın Basitleştirilmiş Versiyonu) 1. ISHEGUVE Crash Trader'a Giriş ISHEGUVE Crash Trader, sentetik endekslerden biri olan Crash Index üzerinde işlem yapmak için özel olarak tasarlanmış otomatik bir işlem sistemidir. Bu endeksler, gerçek dünya piyasa hareketlerini simüle eder ve Deriv.com gibi platformlarda mevcuttur. Bu Expert Advisor (EA), ISHEGUVE Smart Trader'ın basitleştirilmiş bir versiyonudur ve bu sentetik "crash" varlıklarında
This EA does not execute any trading operations.
It is a visual utility tool designed solely for chart synchronization.
The “there are no trading operations” validation error is expected and intentional. CHARTCONNECT – Chart Synchronizer (Version 1.19) Synchronize all your charts to the same symbol with a single click.
What is CHARTCONNECT? ChartConnect is a lightweight and efficient tool developed to automatically synchronize the symbol (ticker) across all open charts in MetaTrade

ShiftedPriceDensitySet – Advanced Price Density Level Analysis with Time Shifts Input parameters TopLevelsToShow 10 Levels in each set NumberOfShifts 10 Number of sets ShiftSpacing 20 Shift step between sets BaseDepth 100 Starting depth DepthStep 20 Depth increment per set PriceStep 0.0001 Minimum price difference between levels PriceSource PRICE_CLOSE Source price type LevelColor clrDodgerBlue Level line color LevelWidth 2 Level line thickness Prefix "" Object prefix for namin
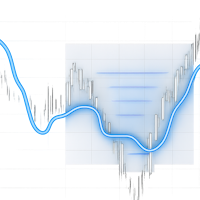
ShiftedPriceDensity — Professional Price Density Indicator with Shifted Historical Levels Input parameters Depth 100 Starting depth TopLevelsToShow 1 Levels in each set NumberOfShifts 10 Number of sets ShiftSpacing 20 Shift step between sets PriceStep 0.0001 Minimum price difference between levels PriceSource PRICE_CLOSE Source price type LevelColor clrDodgerBlue Level line color LevelWidth 2 Level line thickness Prefix "" Object prefix for naming ShiftedPriceDensity is an

ICT Strategy Expert: FVG + OB Dual Confirmation EA Minimum deposit requirement: 3000 USD Description: Struggling to find high-probability ICT trading opportunities? This EA is your ultimate solution! It automates the complex Inner Circle Trader (ICT) core logic, precisely capturing potential market turning points through a strict dual filter of Fair Value Gaps (FVG) and Order Blocks (OB) . Say goodbye to manual chart watching and let a powerful strategy work for you 24/7.
Core Strategy and Adva
ADX Cross Sell - Precisión con lógica direccional y gestión dinámica avanzada Versión actual: 6.63 ️ Autor: Jorge Rodríguez “Kium” ️ Compatible con: MetaTrader 5 ️ Tipo: Expert Advisor (EA) automático Estrategia: Tendencial con validación de momentum y filtros temporales Protección: Gestión dinámica de riesgos (SL/TP/BE) Descripción general ADX Cross Buy es un Expert Advisor de tipo tendencial que busca oportunidades de compra sólidas mediante el cruce del indicador ADX

️ Professor Trader – The Ultimate Gold Trading System Powered by Multi-Strategy AI, News Filters & Adaptive Risk Control Why Choose Professor Trader? Professor Trader is a powerful, adaptive Expert Advisor engineered specifically for XAUUSD (Gold) , combining institutional-grade algorithms with intelligent risk management. This is not just another trading bot — it's a professional-grade trading system designed to adapt to market conditions and deliver consistent returns with built-in

Hızlı Çizgiler Aracı: Trend çizgileri ve dikdörtgenler oluşturmak için kullanışlı bir gösterge
Quick Lines Tool, teknik analiz için hızlı ve verimli araçlara ihtiyaç duyan tüccarlar için tasarlanmış MetaTrader 4 için güçlü ve sezgisel bir göstergedir. Bu göstergeyle, grafik işaretleme sürecini optimize ederek trend çizgilerini, destek/direnç seviyelerini (AP/DW) ve dikdörtgenleri kolayca oluşturabileceksiniz. Gösterge, analizin doğruluğunu ve hızını artırmak isteyen hem yeni başlayanlar hem de

Trend Apex is an automated, trend-following Expert Advisor from the DaneTrades portfolio. It is designed for traders who want a clear rules-based approach, structured risk controls, and minimal day-to-day interaction. The system focuses on trend conditions using MACD with additional price-action filters to help qualify entries and manage exits. Instruments it is commonly used on include major JPY pairs, NAS100, SP500, US30, and XAUUSD. Important notes Trading involves risk and results vary by br
Momentum Breakout Master - Multi-Strategy Trading Expert Momentum Breakout Master is an Expert Advisor for MetaTrader 5 that combines multiple trading strategies with advanced risk management features. Trading Strategies Strategy 1: RSI Momentum Detection Multi-timeframe RSI analysis with divergence detection Swing high/low identification for entry timing EMA trend confirmation filter Momentum threshold validation Strategy 2: Breakout + Volume Confirmation Dynamic Support/Resistance level ident

Pointer Trend Switch — precision trend reversal indicator Pointer Trend Switch is a high-precision arrow indicator designed to detect key moments of trend reversal based on asymmetric price behavior within a selected range of bars. It identifies localized price impulses by analyzing how far price deviates from the opening level, helping traders find accurate entry points before a trend visibly shifts. This indicator is ideal for scalping, intraday strategies, and swing trading, and performs equa
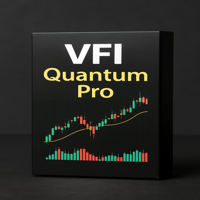
VFI Pro is an advanced implementation of the Volume Flow Indicator by Dubravaspb, enhanced with comprehensive analytical tools. The indicator displays the relationship between price and volume, showing clear signals for market entries and exits, while providing extensive analytics with detailed assessment of market conditions. It is optimized to work with any trading instruments and timeframes. Note! This strategy is not fundamental; each currency pair may require specific settings. Main Featu

**Description of the Trending Mechanism Forex Trading Bot**
**Trending Mechanism** is a high-tech trading bot for the MetaTrader 5 platform designed for automatic market analysis and trading in the Forex market. By utilizing the latest market analysis and capital management technologies, this bot allows traders to effectively identify trends and make informed trading decisions based on current market conditions. It is ideal for both experienced traders and beginners, thanks to its intuitive se
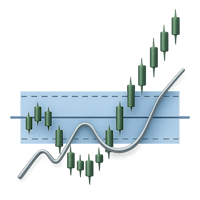
PriceDensity – Professional Price Density Indicator for Accurate Market Level Detection PriceDensity is a smart, non-volume-based indicator that analyzes historical price action to determine key price levels with the highest frequency of occurrence . It automatically detects where the market has spent the most time – revealing hidden areas of support and resistance based on actual market behavior, not subjective drawing. This tool is ideal for traders using price action, support/resistance c
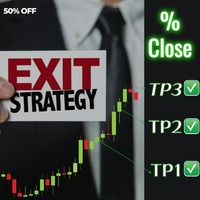
Introducing Exit strategy EA – Smart Trade Manager for MT5, designed to save you screen time and manage your open trades. Set your own TP levels. SL adjustments. Lot size percentages.
How It Works:
Set up to 2 Take Profits for each trade (TP1,TP2). I can add more TP levels
At each target hit:
1. Automatically close a customizable percentage of your position e.g 50% close on TP1
2. Instantly adjust your Stop Loss to a predefined level e.g Move stop loss to breakeven at TP1 hit.
Why Y

Little Spartan EA The Little Spartan EA is an advanced automated trading system that combines multi-timeframe trend analysis with RSI momentum indicators to identify high-probability trading opportunities. While not explicitly using neural networks in the traditional sense, it employs a sophisticated algorithmic approach that mimics neural network pattern recognition through multi-dimensional signal analysis.
Recommended time frame M1 Metatrader 4 Version : https://www.mql5.com/en/market/prod

Index Gainer is the Expert Advisor designed for those who want to invest in indices with simplicity and transparency, without the commissions of traditional funds.
The EA automatically buys your favorite asset (S&P 500, NASDAQ, DAX, and many others) every day at a scheduled time, with clear and customizable risk management. Simply set the capital allocation and let Index Gainer replicate the performance of the chosen index, just like an ETF, but without hidden costs.
The difference? Unlike a s

Smart Rabbit — Advanced Trading Expert Advisor
Smart Rabbit is an advanced automated trading Expert Advisor designed to adapt dynamically to changing market conditions using artificial intelligence, structured risk control, and market event awareness.
Live signal: CLICK HERE
Why Smart Rabbit Is Unique
Smart Rabbit is not just another Expert Advisor. It is a next-level AI-driven trading system built to analyze the market from multiple perspectives and make disciplined trading decisi

AI Algo – Intelligent Automated Trading System for Gold (XAUUSD) AI Algo is a cutting-edge algorithmic trading bot designed specifically for high-volatility, high-impulse markets — with a core focus on gold (XAUUSD) . It combines machine logic , adaptive risk management , and multi-layered signal filtration to deliver accurate entries, consistent protection, and reliable performance — both in fully automated and semi-manual operation modes. Key Features: Smart Entry Logic
Precision entr

BRIEF INTRODUCTION :
This panel is designed for the BTC/USD pair. It offers a comprehensive and fully automated trading solution with optional money management controls. The application is an automated panel that operates in the strategy tester and includes a built-in indicator at the bottom of the interface. Additional features include Martingale strategy and range sequence detection, which help users anticipate future price movements and receive alerts. The panel also provides a reverse

Enthiran CopyTrader for MT5 – Master Trade Copier Mirror Trades Across Multiple Accounts with Precision and Speed Enthiran CopyTrader is a powerful MT5 Expert Advisor that allows you to replicate trades from one MetaTrader 5 account (Master) to one or multiple accounts (Slaves) with complete control over trade size, symbol mapping, and execution speed. Whether you manage investor accounts, signal services, or prop firm strategies, this tool helps you maintain synchronization across accounts w
Trader Dynamic Index Added Signal – Piyasa bağlamına dayalı bilimsel bir yaklaşım 1. Giriş Modern teknik analizde, geleneksel osilatörler çoğu zaman piyasa bağlamından kopuk, izole sinyaller üretir , bu da yanlış veya zayıf sinyallerin yüksek oranına yol açar.
Trader Dynamic Index Added Signal (TDI-AS) , bu sorunu çözmek için geliştirilmiş olup, osilatör tabanlı sinyal üretimini yeniden tanımlamakta ve bağlam farkındalığını sinyal onayının temel koşulu haline getirmektedir. 2. Teorik Çerçeve 2.1

Smart HORIZON — Volume + SMC Indicator Smart HORIZON is a TradingView indicator that combines volume profile levels with Smart Money Concepts (SMC) components to provide structured chart analysis.
It highlights market structure elements and key reference zones, making it easier to monitor price interaction with institutional-style levels. Core Features Volume Profile Levels Weekly & Monthly VAH (green dashed line) and VAL (red dashed line). Untested levels can be extended until touched. Optiona
Hunter Spike
This indicator consists of two regression channels calibrated with the current movement of the synthetic index algorithm, for any Deriv or Weltrade broker.
Each channel has a signal, a target that alerts us when the price touches them, indicating buys on booms or gains and sells on crashes or pains.
-configuration for booms or gains: Channel zone 1 (30) Channel zone 2 (0)
-configuration for crashes or pains: Channel zone 1 (100) Channel zone 2 (70)
Zones freely configurable by

SMC Larry Williams Yapısı, ünlü yatırımcı Larry Williams'ın en çok satan kitabı "Kısa Vadeli İşlemlerin Uzun Vadeli Sırları"ndan yola çıkarak en önemli salınım noktalarını oluşturan ve birbirine bağlayan, piyasa yapısını uyarlamak ve Akıllı Para konseptini kullanarak büyük katılımcıların ilgi alanlarını analiz etmek için sağlam bir temel oluşturan fiyat grafiği yapılarını analiz etmek için bir göstergedir. Swinglerin oluşturulmasının temelinde basit ve net bir mantık vardır: ardışık üç barın ort

Haven Gold Daily Breakout , finans piyasalarındaki en popüler ve anlaşılır stratejilerden biri olan günlük aralık kırılımı ile işlem yapmak için oluşturulmuş tam otomatik bir Uzman Danışman'dır (EA). Riskleri sıkı bir şekilde kontrol ederken ve duygusal kararları ortadan kaldırırken, yüksek volatilitesinden kâr elde etmek amacıyla özel olarak Altın (XAUUSD) için optimize edilmiştir. Diğer ürünlerim -> BURADA || Danışman Takibi -> GÖRÜNTÜLE İşlem Prensibi: Şeffaf ve Kanıtlanmış Bir Strateji "Kara

TrendGap Hunter TrendGap Hunter is an automated advisor for MetaTrader 5 that combines a proven trend strategy based on SuperTrend and Fair Value Gap (FVG) analysis for precise entries and exits. Main features Combination of SuperTrend and FVG Breakout indicators to filter out false signals
Flexible methods of volume calculation: Fixed lot % of balance or free margin Several ways to set stop loss: By SuperTrend level Along the Fair Value Gap Join our community and share your results

Prism Trend Master – Multi-Strategy Trend Trading EA Prism Trend Master is a multi-strategy Expert Advisor designed for trend-based trading. It combines multiple technical systems to identify trend entries and adapt across various market conditions and assets. Built for Trend Trading
This EA analyzes market direction, momentum, and structure through multiple analytical layers for trend identification. Trend-Focused Strategies: Supertrend: ATR-based trend breakout analysis across multiple tim

INTRODUCTION :
This Indicator is made to detect a spike presence whether some conditions are completed. It works preferably with Crash and Boom index. This system contains multiple levels and Four zones such as SPIKE ZONE, CONFIRMATION ZONE, UP REJECTION ZONE, DOWN REJECTION ZONE. Two zones play most important to confirm a spike probability prescence such SPIKE ZONE (Red Levels) and CONFIRMATION ZONE (Red Level). INDICATOR FEATURE : - Dash dot Line in Red : -DI Signal (Up curve) - Solid Line i

Agulhadas Stratejisi için Tarayıcı Bu tarayıcı, Brezilyalı yatırımcılar arasında oldukça popüler olan ve gayri resmi olarak "Agulhadas" olarak bilinen stratejinin sinyallerini otomatik olarak tespit etmek için geliştirildi. Teknik, grafik üzerindeki olası giriş ve çıkış noktalarını belirlemek için beş ana göstergeyi ve net görsel kuralları kullanır. Tarayıcı sayesinde zaman kazanır ve bu fırsatları manuel olarak arama zahmetinden kurtulursunuz. Bu Tarayıcı Göstergesini ücretsiz olarak buradan in

Grafiklerinizi dolduran ve size para kaybettiren güvenilmez sinyallerle mi mücadele ediyorsunuz? En güvenilir üç teknik aracı tek bir net, yeniden boyama gerektirmeyen sinyal üretecinde birleştiren güçlü ve kullanımı kolay bir gösterge mi istiyorsunuz? İşte bu!
Neden Bu Göstergeyi Seçmelisiniz? Üçlü Onay Stratejisi Güvenilir ve yüksek olasılıklı sinyaller için EMA geçişi, RSI momentumu ve MACD histogramını birleştirir. Yanlış girişleri azaltın ve güveni artırın!
Yeniden Boyama Yok Sinya

️ Shadow Assassin EA – Precision Trading from the Shadows Shadow Assassin EA is a powerful automated trading system designed for XAUUSD (Gold) on the M5 timeframe . It blends Breakout strategy with smart Candlestick Pattern detection , attacking market inefficiencies like an assassin hidden in the shadows. Key Features ️ Breakout + Candle Pattern Logic
Instantly places pending orders when price breaks key candle ranges, confirming with price patterns like Engulfing , Pinbar , and more.

️ TradeForge Trade Copier – MT5 hesapları arasında hızlı ve hatasız işlem kopyalama TradeForge Trade Copier , ana hesap (Master) üzerindeki işlemleri başka bir veya daha fazla hesap (Slave) üzerine gerçek zamanlı olarak kopyalayan güçlü bir MT5 EA’dır. Fon yöneticileri, prop traderlar ve stratejilerini farklı brokerlar arasında tutarlı şekilde uygulayıp riski dağıtmak isteyen bireysel yatırımcılar için idealdir. Temel Konsept: İşlem Kopyalama / Ayna Ticaret Birden fazla müşteri hesabını yön

Generates Buy/Sell Signals : Buy Signal : An upward arrow ( DRAW_ARROW ) appears when the JMA changes from a downtrend (red) to an uptrend (green). Sell Signal : A downward arrow ( DRAW_ARROW ) appears when the JMA changes from an uptrend (green) to a downtrend (red). Arrows are placed below (buy) or above (sell) the candle for visibility. Trend Following : Green Line : Indicates an uptrend. Consider holding or entering long positions. Crimson Line : Indicates a downtrend. Consider holding or en

The Jurik Moving Average (JMA) is a sophisticated, adaptive moving average designed to reduce lag while maintaining smoothness. Unlike traditional moving averages (e.g., SMA, EMA), JMA adjusts dynamically to market volatility, making it more responsive to price changes. It’s particularly useful in trading for identifying trends and generating signals with less noise. Input Parameters : inpJmaPeriod (default: 14): The period for calculating the JMA and ATR. inpJmaPhase (default: 0): Controls the
GoldAlgo Breaker EA works on Time and Price theory. As the price patterns change, there will be no difference in performance of the EA, which is why this system has long-term stability and performance. The EA finds important and valuable price and executes trades based on them.
This system works 100% automatically. Suitable for Gold metal.
MT4 : https://www.mql5.com/en/market/product/144974
Public channel : https://www.mql5.com/en/channels/mqlexp
Note : If you have any problems running

SmartRisk MA Pro Strategy Overview: SmartRisk MA Pro is an optimized, risk-oriented automated trading strategy (Expert Advisor) developed for the MetaTrader 5 platform. It is designed to identify trading opportunities based on price deviations from moving averages and incorporates a comprehensive capital management system. The Expert Advisor operates on a "new bar" logic, ensuring stability and predictability in trade signal execution. Operating Principles and Trading Logic: At its core, the st

Are you tired of manually calculating lot sizes for your trades? The Target Lot Calculator is an MQL5 tool that instantly computes and displays the optimal lot size based on your desired profit/loss amount and the price range measured with a crosshair. This tool will make your trading more intuitive and efficient. Key Features Intuitive Operation : Simply move the crosshair to see the optimal lot size for the current price range in real-time. Dynamic Lot Calculation : The tool automatically cal
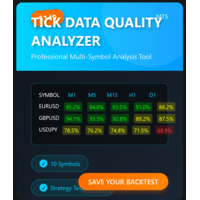
MT5 TICK DATA QUALITY ANALYZER Professional tick data quality analysis tool for MetaTrader 5 traders and developers Price: $69 USD (Launch Special $69 - Regular $99) Product Type: Expert Advisor / Utility Platform: MetaTrader 5 License: Lifetime, 5 Activations
INTELLIGENT BACKTEST RECOMMENDATIONS Automated Backtest Mode Selection - Tells you EXACTLY which tick data format to use in Strategy Tester Optimal Time Period Detection - Automatically identifies the BEST historical range for backtes
MetaTrader mağazası, MetaTrader platformu için uygulama satın almak adına rahat ve güvenli bir ortam sunar. Strateji Sınayıcıda test etmek için Uzman Danışmanların ve göstergelerin ücretsiz demo sürümlerini doğrudan terminalinizden indirin.
Performanslarını izlemek için uygulamaları farklı modlarda test edin ve MQL5.community ödeme sistemini kullanarak istediğiniz ürün için ödeme yapın.
Alım-satım fırsatlarını kaçırıyorsunuz:
- Ücretsiz alım-satım uygulamaları
- İşlem kopyalama için 8.000'den fazla sinyal
- Finansal piyasaları keşfetmek için ekonomik haberler
Kayıt
Giriş yap
Gizlilik ve Veri Koruma Politikasını ve MQL5.com Kullanım Şartlarını kabul edersiniz
Hesabınız yoksa, lütfen kaydolun
MQL5.com web sitesine giriş yapmak için çerezlerin kullanımına izin vermelisiniz.
Lütfen tarayıcınızda gerekli ayarı etkinleştirin, aksi takdirde giriş yapamazsınız.