YouTube'dan Mağaza ile ilgili eğitici videoları izleyin
Bir alım-satım robotu veya gösterge nasıl satın alınır?
Uzman Danışmanınızı
sanal sunucuda çalıştırın
sanal sunucuda çalıştırın
Satın almadan önce göstergeyi/alım-satım robotunu test edin
Mağazada kazanç sağlamak ister misiniz?
Satış için bir ürün nasıl sunulur?
MetaTrader 5 için Uzman Danışmanlar ve göstergeler - 170

This EA partially closes each open order with a lot size greater than the user-defined closing value.
For example: If you open an order for 0.50 or lower and the closing value you set is 0.50, it will do nothing. If you open an order of 0.60 it will instantly transform your 0.60 order into a 0.10 order. This is very useful if you have a small account and the minimum lot size for an asset is too high for you.
Doing this manually can be dangerous due to the time it takes. With the Partial Close

Vision 2.0— L’outil ultime pour trader en toute confiance Vision est un indicateur complet et intuitif qui combine précision, sécurité et simplicité.
Il a été conçu pour les traders qui veulent :
Identifier rapidement les opportunités les plus claires
Protéger leur capital avec une gestion intégrée du risque
Trader en toute confiance grâce à une interface épurée Ce que Vision vous apporte Signaux clairs et sans ambiguïté Flèches visibles directement sur le graphique Entrées et so

CratonGold
CratonGold is not just another trading robot. It is an Expert Advisor built on the principle of geological stability, designed to navigate the volatile Gold (XAUUSD) market with a robust, trend-following strategy. Just like a craton—the oldest and most stable part of the Earth’s crust—this EA is engineered to withstand market turbulence and capture strong, persistent trends. Stop chasing fleeting signals. Start building your strategy on a solid foundation.
Key Features
Specialized

TendencyView is an MQL5 indicator/expert designed to display and analyze the trend of a financial asset (the current symbol) across multiple timeframes in parallel: H1, H4, and D1. It calculates fast and slow moving averages for each timeframe, compares their crossovers, and determines the trend: TREND_UP (bullish) -> Fast MA > Slow MA TREND_DOWN (bearish) -> Fast MA < Slow MA TREND_SIDEWAYS (sideways) -> No clear consensus On the chart, regardless of the timeframe, it displays color panels

DoIt EURO Master MT5 — Smart EURUSD Swing Trading EA (Live Verified) Launch Price: $147 (10 copies) → Next: $399 → $599 → Final: $999 Live Proof Verified results available:
Live Signal on Myfxbook (All results are from a real-money account. Past performance does not guarantee future results.) About DoIt GBP Master has been running successfully for over 8 months with consistent growth and 50+ active users. DoIt EURO Master is the natural evolution, applying the same methodology to EURUSD with
Professional MACD with 6 trading modes, divergence detection, adaptive periods, and complete risk management system /SL,TP/ for all trader levels. Shows adaptive support and resistance! Shows the previous day: high , low and equilibrium price level! Providing trading suggestions!
Choose your trading style and let the indicator configure itself automatically:
- ** BEGINNER MODE** - Simple, safe signals with clear confirmations - ** INTERMEDIATE MODE** - Balanced approach for most traders

HydraCore Trader — XAUUSD advisor with controlled martingale Purpose. The EA trades intraday price fluctuations. The first order of a series is opened by RSI; additional entries are placed by a grid with controlled lot increase (martingale inside a single virtual series). Series exit is by target from BEP or by trailing stop. All input names and on-chart messages are in English. Key features Optimized for XAUUSD; other symbols are possible with individual tuning. Series exit modes: TP from BEP

Overview
MAM Gold MT5 is an Expert Advisor built exclusively for single stocks (equities/stock-CFDs). It is long-only, uses trend confirmation (EMA alignment) with volatility filters, and applies an adaptive trailing module for exits. The EA does not use martingale or uncontrolled averaging. If attached to a non-stock symbol, it remains idle. What it does Trades stocks only; long entries when trend and volatility conditions align ATR/EMA-aware trailing with optional partial exits Optional pyra

Serious about inside bar strategies? This professional indicator delivers three game-changing advantages: efficient backtesting through TIME ZONE signal filtering that eliminates noise and focuses on INSIDE BAR PATTERNS , instant alerts for live trading when your attention is required elsewhere, and complete timezone customization that works anywhere in the world regardless of your broker's location. Additional Features: Zero false positives with advanced pattern validation Automatic broker GMT

Your Automated Edge for Consistent Trading Success Tired of emotional trading decisions and inconsistent results? Master the US500 (US S&P 500 Index) with a professional-grade trading robot built for the discipline and consistency required for long-term market success. Get started for just $34/month. License: 20 Devices & Unlimited Accounts.
US500 Pulse is not just another EA. It's a comprehensive, trend-following trading system designed to navigate the fast-paced US500 market with a primary

Lot Size Calculator – Pozisyon Büyüklüğü Hesaplayıcı Bu indikatör, seçilen risk yüzdesi ve stop loss mesafesine göre lot büyüklüğünü hesaplar. Forex, metaller, endeksler, emtialar ve kripto para işlemlerinde kullanılabilir.
Ana özellikler Bakiye ve risk yüzdesine göre lot büyüklüğü hesaplama Piyasa emri ve bekleyen emir modları Grafik üzerinde giriş, stop loss ve take profit çizgileri Risk/getiri oranı gösterimi Stop loss mesafesine göre otomatik lot ayarlaması Grafik üzerinde kâr/zarar göster

ScalerPro EA
The Ultimate VWAP & EMA Fusion Trading System Overview ScalerPro EA is a next-generation Expert Advisor that fuses the institutional power of Volume Weighted Average Price (VWAP) with the reliability of Exponential Moving Averages (EMA).
With dual-strategy architecture, smart position scaling, and intelligent risk controls, ScalerPro EA adapts dynamically to changing market conditions while keeping risk in check. Key Features Dual Strategy Engine VWAP Strategy → Captures momen

Overview
GoldStrikeEA is a fully automated Expert Advisor for MetaTrader 5, designed primarily for XAUUSD (Gold) but capable of adapting to other symbols. Built with ICT/FVG concepts, liquidity sweeps, and S/R fractal retests , it provides both strict and flexible trading modes to suit different strategies. This EA combines advanced market structure detection with a customizable model-learning engine, giving you high adaptability, strong risk management, and consistent performance . ️

Genel Bakış
Mum formasyonlarına dayalı, isteğe bağlı RSI onayı, çoklu zaman dilimi filtreleri ve entegre risk yönetimi içeren bir Expert Advisor. Disiplinli girişler, net parametreler ve backtestlerde yüksek tekrarlanabilirlik için tasarlanmıştır. Nasıl Çalışır
İşlem yönü günlük mumdan türetilerek yükseliş, düşüş veya yatay piyasa koşulları belirlenir. Giriş sinyalleri yalnızca tanımlanmış bir zaman aralığında etkinleşir ve gün ile ay filtreleri karşılandığında çalışır. Formasyon filtresi etki

INVI Hunting Gold is one of the straightforward tool to analysis the volatile market of Gold with demands precision, in-depth analysis, strong risk management and eliminating the need for constant market monitoring. INVI Hunting Gold will hunt the good trade position with precise risk management on all market conditions on Gold. Hunting Gold plug-and-play functionality means you can get started with minimal effort, Simply install me and let me handle the rest. We will diligently monitor the m

Ameers Gann Toolbox – By Ameer W.D. Gann hakkında W.D. Gann (1878–1955), tarihin en efsanevi traderlarından biridir.
Fiyat ile zaman arasındaki ilişkiye dayalı, açıları, geometriyi, döngüleri ve oranları kullanan benzersiz bir metodoloji geliştirdi. Gann, piyasaların öngörülebilir matematiksel kalıplar içinde hareket ettiğine ve gelecekteki hareketleri tahmin etmede zamanın fiyat kadar önemli olduğuna inanıyordu. Neden bu toolbox özel Ameer’s Gann Toolbox, dünyadaki ilk tam ve etkileşimli Gann a

Intelligent Grid Pro - 6 month Live Results of XAUUSD
In my bio you can find link to myfxbook results
Overview Intelligent Grid Pro is a sophisticated MetaTrader 5 Expert Advisor designed for experienced traders who understand grid trading strategies. This advanced algorithmic system combines traditional grid methodology with intelligent risk management and automated position handling.
Core Features Smart Entry System Intelligent Signal Detection : Advanced market analysis for optimal entry t

BIAS Detector Indicator (MT5) Description The BIAS Detector Indicator is a custom tool for MetaTrader 5 designed to provide traders with a quick visual market bias based on the relationship between: AI simplified detector Hull and Moving Average computation based on multiple Average confluence for market trend. It simplifies trend direction analysis by displaying a BIAS Signal (Buy/Sell) directly on the chart in a small panel. The indicator shows “BIAS BUY” and “BIAS SELL” in yellow tex

AP London Breakout PRO trades the first impulse when Europe hands over and London liquidity hits. It builds a pre-London range (02:00–07:00 server), checks the box height and spread, then posts one clean breakout with fixed risk. No martingale, no grid, no chasing; once filled, it cancels the other side and stands down for the day. Designed for majors and gold on M5–M15, with broker-safe placement (Stops/Freeze aware), lot rounding, and a daily cap. Quick start
• Chart: M5 (reads higher TFs inte

AntiSwapCleaner is an Expert Advisor (EA) designed to protect a trading account against losses caused by negative swaps (overnight fees charged for holding an open position). It runs in the background and monitors open positions matching a given Magic Number (or manual trades if enabled).
It calculates the applicable swap for each position (long or short) and compares the current profit of the position with the estimated swap.
If the profit is lower than the swap (i.e. the position risks costin

Tek grafik. Tam kontrol. Her grafikteki nesneleri, renkleri ve ayarları ayrı ayrı yönetmek için zaman kaybetmeyi bırakın. Grafik Senkronizasyon Yöneticisi ile şunları yapabilirsiniz: tüm MetaTrader grafiklerinizi senkronize edin, kopyalayın ve kontrol edin anında—sadece bir panel ve birkaç kısayol kullanarak. Bir kez çizin, her yerde güncelleyin. Grafikleri tek bir tıklamayla açıp kapatın. Çalışma alanınızı temiz tutun. sembol tabanlı nesne yönetimi . Ve önemli ayrınt

Bank Your Profits & Secure Your Trade in One Click The Ultimate "Scale Out" Tool for Professional Traders. Close Partial (MT5 Utility) is designed for traders who want to lock in profits without killing the trend. With a single click, you can bank a percentage of your profit instantly. New Feature (Auto-Secure): Stop wasting time dragging your Stop Loss after taking profit. This manager can now automatically move your Stop Loss to Break-Even the moment you click the "Close Partial" button. B

Bu EA stratejisi, Haziran 2016'dan Haziran 2017'ye kadar BTC üzerinde yapılan testlerde çok iyi getiri performansı göstermiştir. Bu EA stratejisi tek bir strateji değildir; kişisel uzun süreli调试(ayarlama) ve bağımsız geliştirme sürecinden geçmiştir. Bu EA stratejisi için başlangıç sermayesi 3.000 ila 10.000 ABD Doları arasında değişebilir. Mükemmel risk yönetimine sahiptir ve piyasa koşulları uygun olduğunda sizin için pazardan iyi kazanç sağlayabilir.

In a market flooded with lagging indicators and overfit strategies, this utility offers a fresh edge: real-time statistical arbitrage powered by an adaptive neural network , built entirely in MQL5—no DLLs, no external dependencies. Key Advantages Smart Spread Modeling
It dynamically calculates a hedge ratio between two correlated instruments (like EURUSD vs GBPUSD), forming a synthetic spread that reflects true relative value. This isn’t just correlation—it’s cointegration-aware logic. Neur
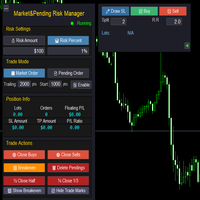
Market & Pending Risk Manager EA Operation Manual Market & Pending Risk Manager is a professional MT5 trading panel EA that integrates multiple functions such as market order trading, pending order trading, risk management, and trailing stop loss, providing traders with a comprehensive trading solution. Core Advantages Intelligent Dual-Mode Trading Market Order Mode: One-click buy/sell for fast execution Pending Order Mode: Precise entry to wait for the optimal timing Seamless Switching:

MomentumDeploy Scalping Advisor
Precision Entry. Momentum-Driven Execution. MomentumDeploy is a high-performance scalping advisor designed to identify and exploit short-term price bursts with surgical precision. Built for fast-moving markets, it doesn’t just react to volatility — it anticipates it. At its core is a proprietary momentum detection engine that scans live price action for optimal deployment zones. Whether you're trading manually or automating execution, MomentumDeploy acts as your

SMC_LiquidityGrab_EA - Smart Money Concept (SMC) Ai Automated Trading Expert Advisor (EA) Sale 75% First 10 Order!!!!!!! You Can Tracking All EA Status and Update in This Link https://www.notion.so/Kaws-Ea-Tracking-25e8e514bbfe8003b336ce3c2f27fe85 In Screenshot Tester is XAUUSD TF M5 Default Config Overview:
The SMC_LiquidityGrab_EA is an Expert Advisor (EA) developed for the MetaTrader 5 (MT5) platform, aiming to detect and capitalize on trading opportunities based on Smart Money Concept (SMC

BigBoss Ultra Z Scalper EA, EURUSD paritesi için M5 (5 dakikalık) zaman diliminde hassas bir scalping EA'sıdır.
BigBoss Scalper Ultra Z, EURUSD paritesinde hassas scalping stratejileri için özel olarak tasarlanmış bir Uzman Danışmandır (EA), MetaTrader 5 platformunda M5 (5 dakikalık) zaman diliminde çalışır. Bu EA, 12 pip'lik Kar Al ve 11 pip'lik Zarar Durdur emirleri kullandığı için hızlı işlem ve kontrollü risk yönetimi arayan yatırımcılar için tasarlanmıştır.
Geriye Dönük Test Sonuçları (M

Fibonacci Grid EA representa la evolución definitiva en sistemas de trading semi automatizado. Combina la precisión matemática de los niveles Fibonacci con una gestión de riesgo inteligente que hace que las operaciones sean casi infalibles. CARACTERÍSTICAS PRINCIPALES ESTRATEGIA BASADA EN FIBONACCI PROBADA Utiliza los niveles dorados de Fibonacci (0.236, 0.382, 0.618, 0.786) Reconoce automáticamente los puntos swing highs y lows Coloca órdenes pendientes en múltiples nivele

Volatility 75 Trend - Specialized Technical Indicator Overview The Volatility 75 Trend is an advanced technical indicator designed specifically for trading synthetic indices, particularly the Volatility 75 (V75). This indicator combines multiple technical analysis tools to provide accurate trend signals and timely alerts in highly volatile markets.
Key Features 1. Adaptive Trend Algorithm Uses the Average True Range (ATR) as a basis for calculating dynamic support and resistance levels Impleme

SmartSMC EA – Liquidity Sweeps For over 10 years in the Gold market I’ve watched how price hunts liquidity before the real move. SmartSMC EA is my distilled version of that edge: a simple, disciplined SMC liquidity-sweep engine that trades XAUUSD with clean risk and professional execution.
Why choose SmartSMC?
Because it blends Smart Money Concepts with rock-solid automation. You don’t need to second-guess the chart—attach the EA, choose your risk, and let it handle entries, exits, sizing and
Super Trend Scalper v1.0 Overview The Super Trend Scalper is an advanced technical indicator designed specifically for scalping in the synthetic index Deriv market. It combines the power of three renowned technical indicators—SuperTrend, RSI, and MACD—to provide accurate and timely trading signals, ideal for traders looking to take advantage of short-term price movements with a high probability of success.
Technical Methodology Main Components 1. Adaptive SuperTrend
Uses the Average True Rang

Hızlı scalping; sistematik disiplin Nirvana ile karar verin; hesaplamalar ve güvenlik freni bizde. Şaşırmayın; en gelişmiş ve akıllı sermaye yönetimi aracıyla tanışıyorsunuz, finans piyasalarında maksimum esneklik sunar. Kazanan trade sadece "iyi analiz" değil; "sorunsuz yürütme" ve "disiplin" anahtardır. Nirvana, yürütme asistanınızdır: anlık risk/hacim hesaplayıcı, tek tıkla R:R ayarı, canlı risk ve kâr önizlemesi, günlük risk kilidi güvenlik anahtarı gibidir. Sonuç? Zihniniz tekrarlayan hesap

Tokyo Session Range Breakout EA – Smart Trading for Prop Firms & Retail Traders Looking for a disciplined breakout system that trades with precision, manages risk intelligently, and avoids overnight exposure?
The Tokyo Session Range Breakout EA is built exactly for that. How It Works
The EA automatically detects the Asian session range (00:00 – 08:59) UTC by mapping the highest and lowest price levels.
A box is drawn to clearly mark this range on your chart.
During the London session and early

Visual Cobra Momentum Wave: Ride the Trend with Unmatched Clarity Unlock the true direction of the market and trade with newfound confidence. The Visual Cobra Momentum Wave is a professional-grade trend analysis tool designed to eliminate the noise and confusion of volatile markets. Instead of relying on lagging or conflicting signals, this indicator provides a single, clear visual guide, allowing you to identify and ride strong trends from their inception to their conclusion. For just $30, you

Visual Panther: Your Ultimate Trend Trading Companion Unlock the full potential of your trading with the Visual Panther, a meticulously engineered trend-following indicator for MetaTrader 5. Designed for traders who demand clarity, precision, and control, this tool eliminates guesswork by providing clear, non-repainting signals to help you capture and ride market trends effectively. For just $30, gain a professional-grade tool that could redefine your trading strategy. The Logic Behind the Pant

Visual Falcon Indicator for MetaTrader 5 Trade with Clarity and Confidence. Capture Trend Reversals with Precision. Are you tired of noisy indicators that generate countless false signals? The Visual Falcon Indicator is a professional-grade trend analysis tool designed to cut through the market noise and identify high-probability trend reversals with exceptional accuracy. For just $30, you can equip your chart with a powerful, non-repainting indicator that helps you see the market's true direct

Visual Falcon Wave Indicator: Trade with Clarity and Confidence Are you tired of navigating the chaotic market with lagging indicators and confusing signals? Do you struggle to identify the true trend direction amidst unpredictable price swings? The Visual Falcon Wave Indicator was engineered from the ground up to solve this exact problem, providing a crystal clear, intuitive, and powerful tool for trend traders. For a one-time price of just $30, you can equip yourself with an indicator designe

A comprehensive multi-feature indicator combining trend analysis, smart money concepts, and automated risk management. Features adaptive trend detection with volatility-based smoothing, dynamic support/resistance levels, institutional volume analysis, and real-time signal generation with instant alerts. Key Features: Multi-condition signal system with 4-factor confirmation (Trend, S/R, RSI, MACD) Smart Money level detection based on volume analysis Automatic TP/SL calculation using ATR multipli

Visual Cheetah Wave Indicator: Trade with Speed and Precision Unlock market trends and trade with renewed confidence for just $30. Are you tired of cluttered charts and conflicting signals that leave you guessing? The Visual Cheetah Wave Indicator was developed to cut through the market noise, providing a clean, intuitive, and powerful way to identify and follow trends. Designed for traders who demand clarity, this tool helps you spot high-probability entry and exit points with exceptional accu

Visual Wave Dolphin Indicator: Ride the True Waves of the Market Tired of chaotic charts and confusing signals? The Visual Wave Dolphin Indicator is your solution to cutting through market noise and identifying high-probability trading opportunities with stunning clarity. Designed for traders of all levels, this powerful tool transforms complex price action into a simple, elegant wave, allowing you to visualize market trends and catch turning points before they happen. For just $30, you can equ

Visual Cheetah Run Indicator: Capture Market Momentum with Speed and Precision Are you tired of cluttered charts and ambiguous trading signals? Do you struggle to identify strong trends before they take off, often entering the market too late? The Visual Cheetah Run Indicator is the definitive solution designed to provide crystal-clear, high-probability entry signals by identifying powerful market momentum with unparalleled accuracy. For a one-time price of just $30, you can equip your MetaTrad

Visual Pangolin Trend Indicator Unlock the True Market Trend with Clarity and Confidence Are you tired of whipsaws and false signals that erode your trading account? The key to successful trading is not just finding a trend, but knowing when the trend is real and when it's just market noise. The Visual Pangolin Trend Indicator is a professionally designed tool that gives you a decisive edge, filtering out volatility to reveal the underlying market direction with unparalleled clarity. For a one-

MT4 Sürümü: https://www.mql5.com/tr/market/product/138049 MT5 Sürümü: https://www.mql5.com/tr/market/product/138050
"LEGION" – Gelişmiş BBMA İşlem Uzman Danışmanı
"LEGION", BBMA Stratejisi'ne (Bollinger Bantları + Hareketli Ortalamalar) dayalı, çoklu zaman dilimi filtreleri ve uyarlanabilir para yönetimi ile geliştirilmiş profesyonel bir Uzman Danışmandır. Hassas girişler, kontrollü katmanlama ve maksimum risk koruması isteyen yatırımcılar için tasarlanmıştır.
Temel Özellikler
Eksiksiz BBMA
Neural Breakout v5.1 - AI-Powered Multi-Symbol Portfolio Manager Transform your MT5 terminal into an intelligent trading command center. Manage multiple forex pairs with advanced neural network technology and institutional-grade risk management from a single chart. Live Signal: <<Click Here>>
Please contact me for setfile once purchased WHAT IS NEURAL BREAKOUT? Neural Breakout is a sophisticated multi-symbol trading system that combines self-learning neural networks with proven breakout stra

Visual Polar Bear RSI - The Ultimate Momentum Indicator Stop guessing and start seeing the market's true momentum. The Visual Polar Bear RSI is not just another technical indicator; it is a complete trading tool designed to give you a distinct advantage. Engineered with a unique, proprietary calculation engine, this indicator provides smoother, clearer, and more actionable signals than the standard Relative Strength Index. At its core, the Visual Polar Bear RSI replaces the classic RSI formula

Visual Arctic Fox Trends: Trade with Adaptive Intelligence Unlock the power of a truly intelligent trend-following indicator. For just $30, the Visual Arctic Fox Trends indicator provides crystal-clear, adaptive signals designed to thrive in any market condition. Are you tired of moving averages that lag in fast-moving trends or generate false signals in choppy markets? The Visual Arctic Fox is engineered to solve this problem. It's not just another moving average; it's a sophisticated trading

Unlock Your Trading Potential with the Visual Lion Strength Indicator Are you tired of navigating choppy markets and struggling with indicators that give false signals? The Visual Lion Strength Indicator is a professionally engineered tool designed to bring clarity and confidence to your trading. Built on a unique and robust algorithm, this indicator helps you identify the true direction of the trend and provides clear, non-repainting signals for high-probability entry points. For just $30, you

Visual Tiger Momentum Indicator: See the Market's Next Move Tired of lagging indicators that leave you second-guessing your trades? The Visual Tiger Momentum Indicator is a professional-grade, on-chart analysis tool designed to give you a clear and predictive edge in any market and on any timeframe. By replacing outdated moving averages with advanced statistical analysis, this indicator provides a dynamic, forward-looking view of trend, momentum, and volatility. For a one-time price of just $30

Visual Crocodile Pulse Indicator Unlock the Market's True Momentum and Trade with Confidence Are you tired of lagging indicators and noisy charts that lead to false signals? The Visual Crocodile Pulse Indicator is a sophisticated, professional-grade trend analysis tool designed to give you a clear and decisive edge. By cutting through market noise, it identifies the powerful beginnings of new trends, helping you enter trades with higher precision and avoid choppy, unpredictable conditions. For

Visual Eagle Trend Indicator: Trade with Clarity and Confidence Are you tired of noisy charts, false signals, and missed opportunities? The Visual Eagle Trend Indicator is a professional-grade trading tool designed to cut through the market noise and provide you with clear, high-probability trend signals. By leveraging a powerful triple-confirmation strategy, this indicator helps you identify and trade with the dominant market trend, enhancing your trading precision and confidence. For just $30
Visual Panda Tracker: Trade with Adaptive Clarity Are you tired of lagging indicators that give signals too late, or noisy charts that lead to confusion and bad trades? The Visual Panda Tracker is a sophisticated, next-generation trend analysis tool designed to give you a clear and decisive edge in any market condition. Built on a powerful adaptive engine, this indicator intelligently adjusts to market volatility, providing smoother, more reliable signals that help you stay ahead of the trend.

TigrisWave IQ Binary Rocket - The Ultimate Signal Generator! From the creators of the revolutionary Scalp Rocket AI comes a game-changer for Binary Options trading. This expert advisor is meticulously engineered to generate high-probability buy/sell signals, perfectly synchronized with the market trend. While originally designed for Forex, its pinpoint accuracy makes it the ultimate tool for binary options traders seeking explosive daily profits.
How It Works: Precision Meets Power The EA

Visual Wolf Trend Line: Your Ultimate Trend Following Co-Pilot Unlock the power of clear, confident trend trading with the Visual Wolf Trend Line indicator. In a market full of noise and conflicting signals, this tool is designed to be your definitive guide, providing an intuitive, at-a-glance understanding of market dynamics combined with precise entry and exit signals. For just $30, you can stop guessing and start trading with a quantifiable edge. What is the Visual Wolf Trend Line? The Visua

Visual Fox Channel: Precision Signals for Reversal and Pullback Trading Unlock a new level of trading precision with the Visual Fox Channel, a sophisticated indicator engineered to identify high-probability turning points in the market. If you are tired of noisy charts and false signals, this tool provides a multi-layered filtering system to deliver clear, actionable buy and sell opportunities. For just $30, you can equip your charts with an institutional-grade analysis tool. The Logic Behind t

Visual Wolf Bands: Your Ultimate Reversal Signal Indicator Unlock Market Reversals with Unmatched Clarity Are you tired of navigating the market's unpredictable swings with lagging, complicated indicators? Do you struggle to find reliable entry and exit points amidst the noise? The Visual Wolf Bands indicator was developed to solve this exact problem, providing you with a clean, powerful, and intuitive tool to pinpoint high-probability market reversals. For just 30 dollars, this is an essential

Visual Eagle ATR Ratio Indicator Unlock the Market's Hidden Volatility Cycles for Just $30 Are you tired of entering trades that go nowhere? Do you struggle to identify when the market is about to make a powerful move? The Visual Eagle ATR Ratio indicator is the professional tool you need to stop guessing and start making data driven decisions based on the market's most critical element: volatility. This indicator provides a unique and powerful view of market dynamics by precisely measuring the

Zelix Gold Scalper EA
Smart Scalping Robot – Built for XAUUSD (Gold only) Fully Automated – Easy to Use
Optimized Exclusively for Gold (XAUUSD)
Scalping on M1–M5 with precision filters
ATR-based Stop Loss & Take Profit
Clean Strategy – No Grid, No Martingale
Best performance during London & New York sessions Recommended Settings: Pair: XAUUSD (Gold) Timeframe: M5 Minimum Deposit: $500+ Leverage: 1:200 or higher ️ Important Disclaimer:
Trading involves significant risk.
This

SinalTradeEA Telegram To MT5 SinalTradeEA, işlem sinyallerini doğrudan MetaTrader 5’e entegre etmek için geliştirilmiş tam otomatik bir Expert Advisor’dır.
Giriş, çıkış ve risk yönetimi üzerinde tam kontrol sağlarken işlemleri yüksek hassasiyetle yürütür. Temel Özellikler Telegram veya harici sinyal kaynaklarıyla doğrudan entegrasyon. Tamamen otomatik emir yürütme. Çoklu mod destekli akıllı TP/SL yönetimi. Gelişmiş risk ve lot yönetimi stratejileri. Birden fazla MT5 sembolü ile uyumlu. Slippage,
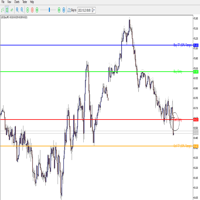
This custom MT5 indicator automatically draws trading levels based on the previous H4 candlestick. It is designed to help traders quickly identify potential entry and take profit (TP) points according to a simple breakout strategy. What it does:- Draws Buy Entry line at the previous H4 High.- Draws Sell Entry line at the previous H4 Low.- Calculates the 50% range of the previous H4 candle and plots: • Buy TP line above the High. • Sell TP line below the Low.- Adds text labels directly on the cha

Reversal Gold EA Reversal Gold EA, özellikle XAUUSD (Altın) paritesi için tasarlanmış otomatik bir alım satım sistemidir. Piyasa dönüşlerini hedefleyen bir karşı-trend stratejisi ile çalışır. EA, Altın'ın kendine özgü volatilitesi ve fiyat hareketleri karakteristiklerine uyum sağlayacak şekilde geliştirilmiştir. Strateji Reversal Gold EA'nın temelinde, çoklu indikatör teyidine dayalı bir sistem yatmaktadır. Algoritma, piyasa koşullarını birden fazla teknik indikatörün birleşimini kullana
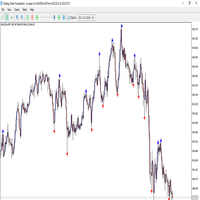
Overview The Reverse No Repair indicator is a trend-reversal detection tool that identifies potential turning points in the market with high accuracy. It is designed to provide non-repainting BUY/SELL signals based on candle body strength, volatility filtering, and future confirmation logic. The indicator marks reversal points on the chart using arrows: Red arrow (Down Signal) – Possible bearish reversal (sell opportunity). - Blue arrow (Up Signal) – Possible bullish reversal (buy opportunity).
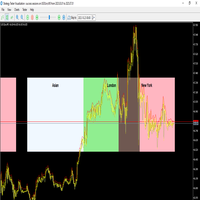
The Sessions Indicator visually highlights the major trading sessions (Asian, London, and New York) directly on the chart by drawing shaded rectangles. It helps traders quickly identify market activity zones, overlaps, and session-specific behaviors. Key Features:- Session Highlighting: Asian, London, and New York sessions are displayed using shaded rectangles with customizable colors.- Custom Session Times: Start and end times for each session can be adjusted to match broker server time.- Sessi

# KeltnerStoch Consensus EA (Hedge Martingale ve Gösterge Modu ile)
**Nedir:** **Keltner Kanalları (EMA20+ATR)** + **Stokastik (14,3,3)**'ü birleştiren ve **trend konsensüs filtresi (EMA200 + ADX + MACD)** ile destekleyen bir Expert Advisor (EA). **Otomatik olarak işlem açabilir** veya grafikte **AL/SAT** oklarını ve metinlerini gösteren **görsel bir gösterge** olarak çalışabilir.
**Nerede Kullanılır:** **Her sembol ve zaman diliminde çalışır.** En iyi sonuçlar **EURUSD H4**'te **TP=40 pip**

The most comprehensive Volume Profile Trading System in MQL
Finally, Trade Where The Smart Money Trades Stop guessing. Start seeing EXACTLY where banks and institutions are positioning their trades - and ride the wave with them. What Makes Millionaire Traders Different? They don't look at the same charts you do. They see where the money actually flows. FlowZone Pro reveals the hidden order flow that moves markets - the same data that costs hedge funds $3,000+/month on Bloomberg terminals

TrendCockpit EA – Smart Autonomous Trading TrendCockpit EA is an advanced yet user-friendly Expert Advisor designed to automate trend-following strategies with precise risk management. It’s perfect for traders of all levels who want to trade efficiently without constant monitoring. TrendCockpit is a tactical-grade Expert Advisor built for traders who treat execution as a discipline. With cockpit-style controls, dynamic risk logic, and multi-symbol heatmap intelligence, it transforms your chart i

Gold Relic EA is an automated trading robot that uses complex algorithm mainly based on MACD, Momentum, Envelopes, Bulls Power, Bears Power, Standard Deviation, ADX, RSI, Support Resistance, Candlestick Formations and other default MetaTrader indicators. This expert advisor works on all timeframes and all pairs, but it is recommended to use on GOLD H1 timeframe.
Setting Parameters: Expert Name - Expert Advisor name and trades comment. Magic Number - EA identification number. Trade

Visual Waves Indicator: Ride the Trend with Clarity Unlock a smarter way to trade with the Visual Waves Indicator, a sophisticated tool designed to provide clearer, more reliable trend signals on the MetaTrader 4 platform. Are you tired of the false signals and market noise generated by traditional moving averages? The Visual Waves Indicator is your solution. It moves beyond basic calculations to offer a truly adaptive analysis of market momentum, helping you identify trading opportunities with

Visual Dolphin Indicator Unlock the rhythm of the market with the Visual Dolphin Indicator, your ultimate tool for identifying and capitalizing on market trends with clarity and confidence. Designed for both novice and experienced traders, this indicator eliminates the noise and guesswork, providing crystal-clear buy and sell signals directly on your chart. The Logic Behind the Waves The core of the Visual Dolphin Indicator is a sophisticated yet intuitive dual-wave system based on moving avera

Visual Eagle Momentum Indicator Unlock Market Momentum and Pinpoint High-Probability Trades with Unmatched Clarity Are you tired of cluttered charts and lagging indicators that leave you guessing? The Visual Eagle Momentum Indicator is a professionally developed trading tool designed to cut through the noise, providing clear, non-repainting buy and sell signals based on a unique and powerful momentum analysis engine. For just $30, you can equip yourself with an indicator that helps you spot tur
MetaTrader mağazası - yatırımcılar için alım-satım robotları ve teknik göstergeler doğrudan işlem terminalinde mevcuttur.
MQL5.community ödeme sistemi, MetaTrader hizmetlerindeki işlemler için MQL5.com sitesinin tüm kayıtlı kullanıcıları tarafından kullanılabilir. WebMoney, PayPal veya banka kartı kullanarak para yatırabilir ve çekebilirsiniz.
Alım-satım fırsatlarını kaçırıyorsunuz:
- Ücretsiz alım-satım uygulamaları
- İşlem kopyalama için 8.000'den fazla sinyal
- Finansal piyasaları keşfetmek için ekonomik haberler
Kayıt
Giriş yap
Gizlilik ve Veri Koruma Politikasını ve MQL5.com Kullanım Şartlarını kabul edersiniz
Hesabınız yoksa, lütfen kaydolun
MQL5.com web sitesine giriş yapmak için çerezlerin kullanımına izin vermelisiniz.
Lütfen tarayıcınızda gerekli ayarı etkinleştirin, aksi takdirde giriş yapamazsınız.