Fusion Monthly Levels PinBar Marubozu
- Göstergeler
- Sürüm: 2.0
- Güncellendi: 6 Mayıs 2026
- Etkinleştirmeler: 5

Niveaux mensuels + PinBar + Marubozu + ALERTES (MQL5)
Version : 2.0 FINAL
Auteur : KOUAME N'DA LEMISSA See More
Description du produit
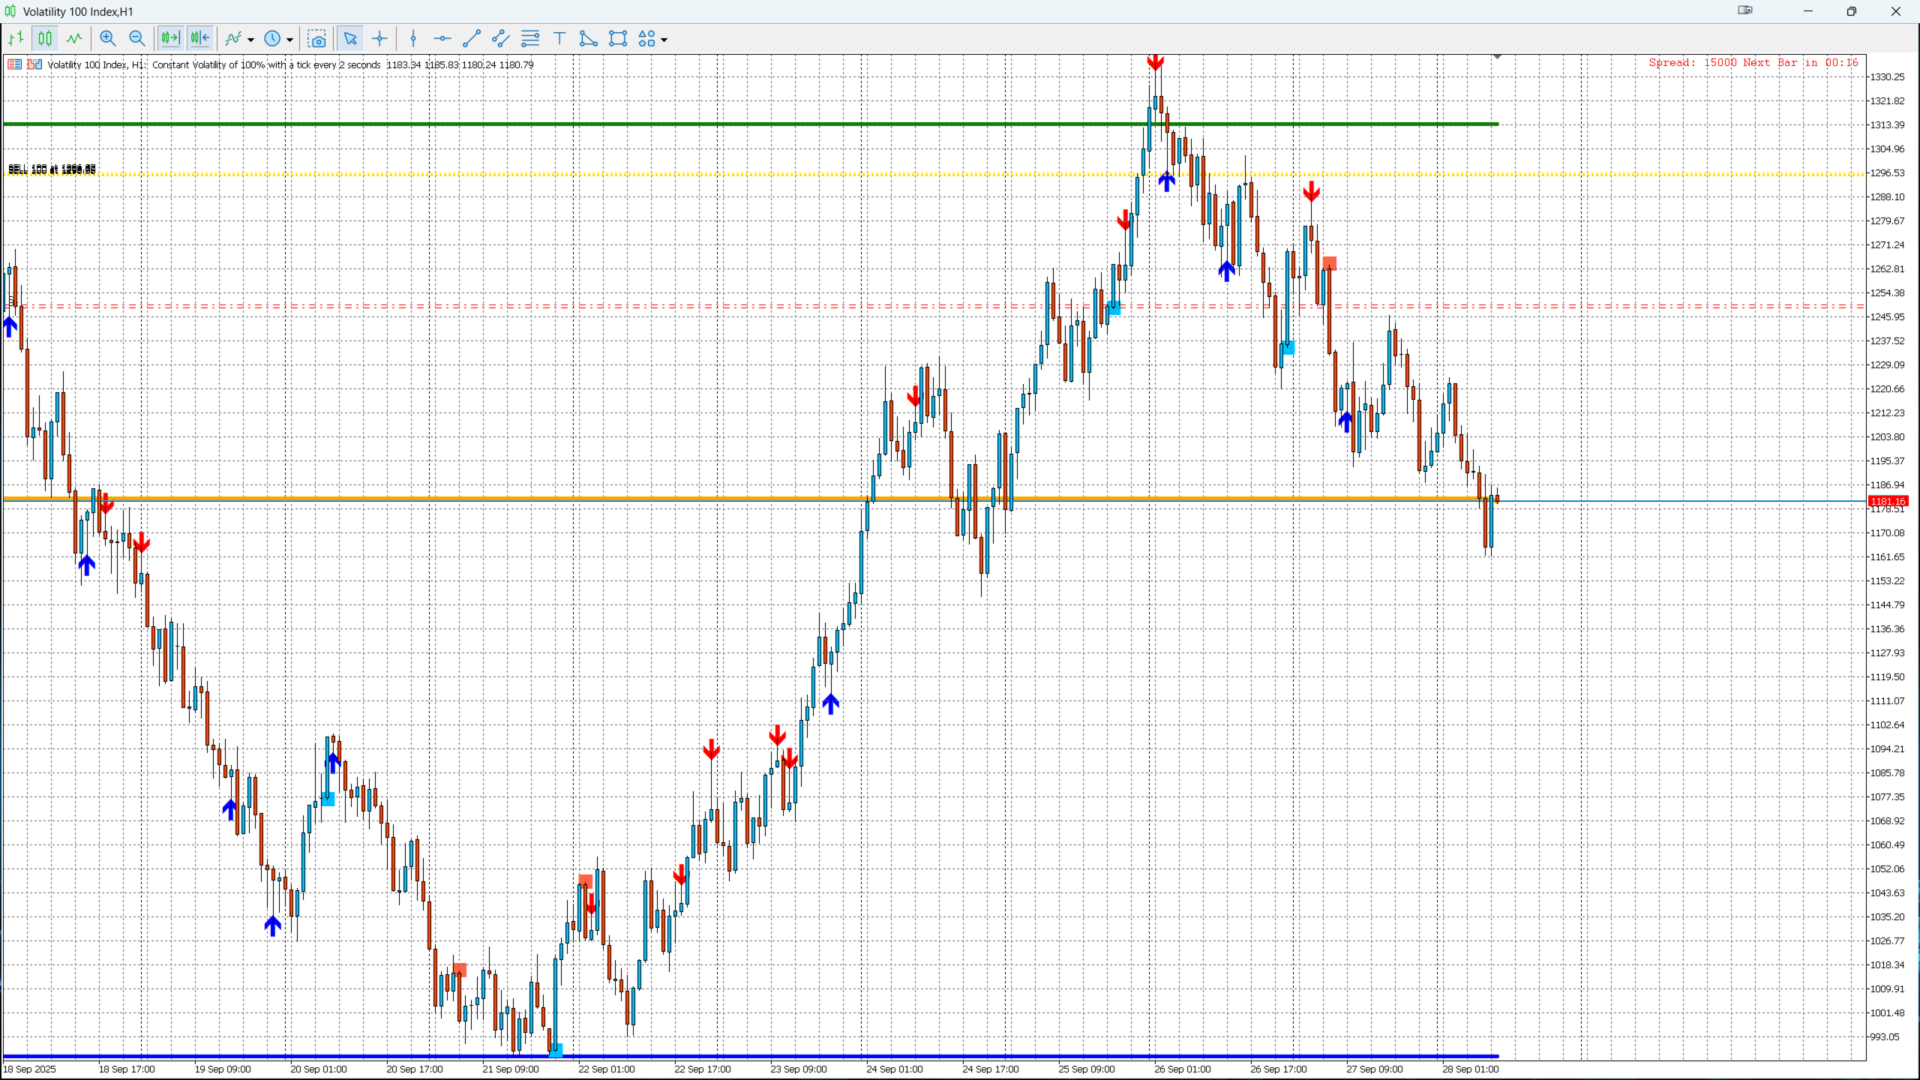
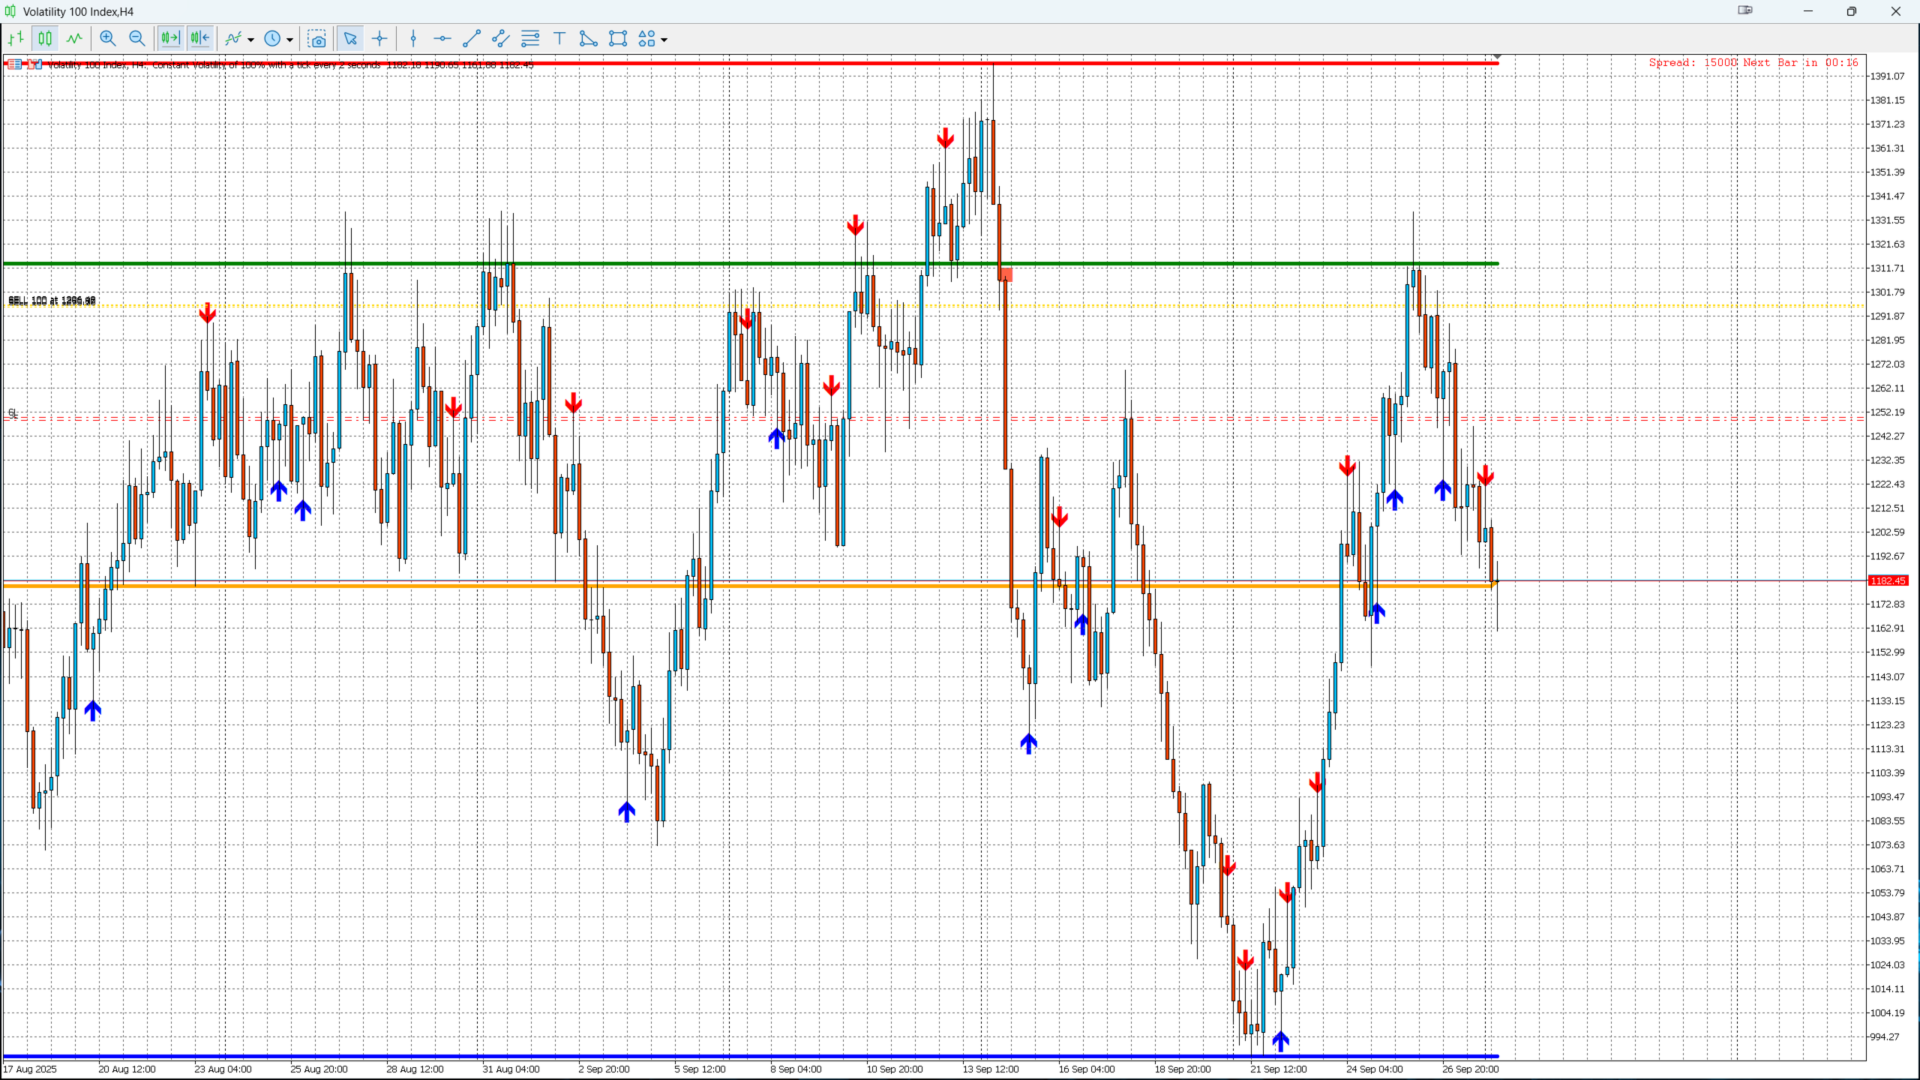
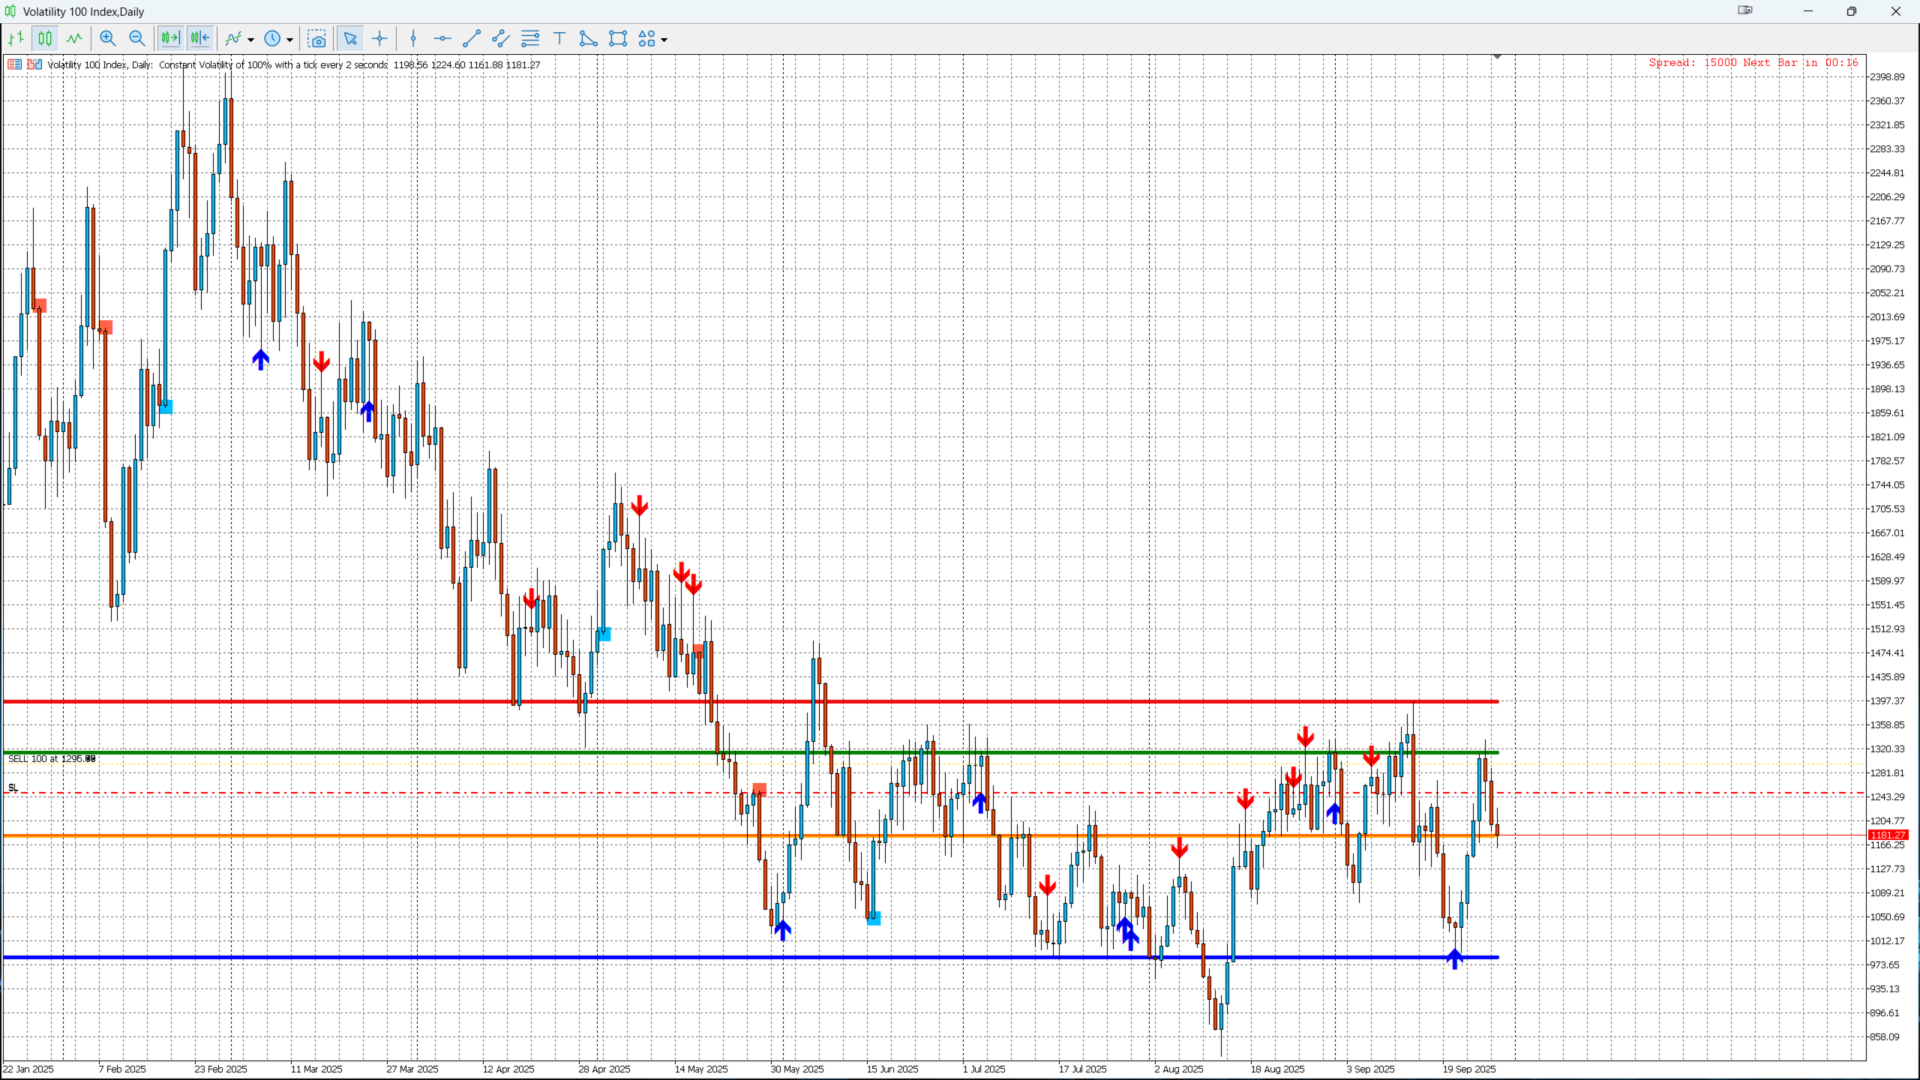
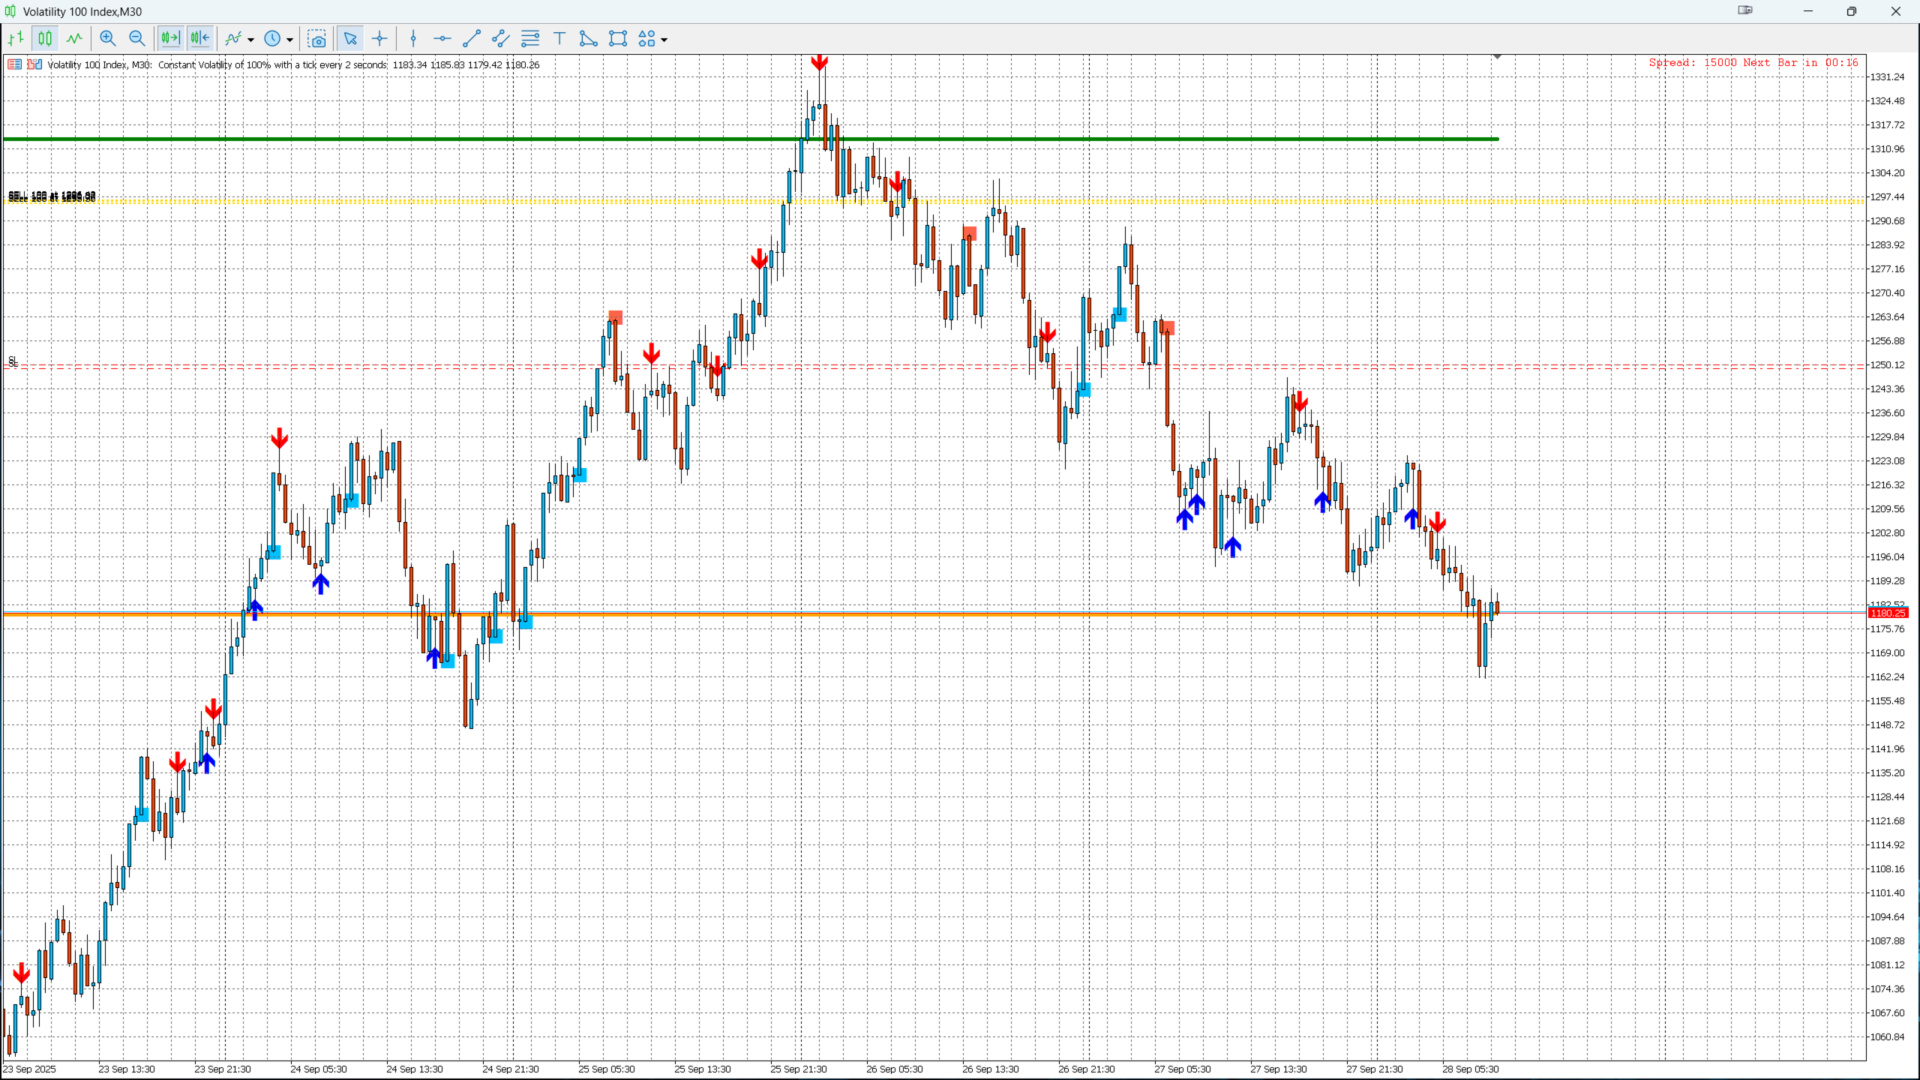
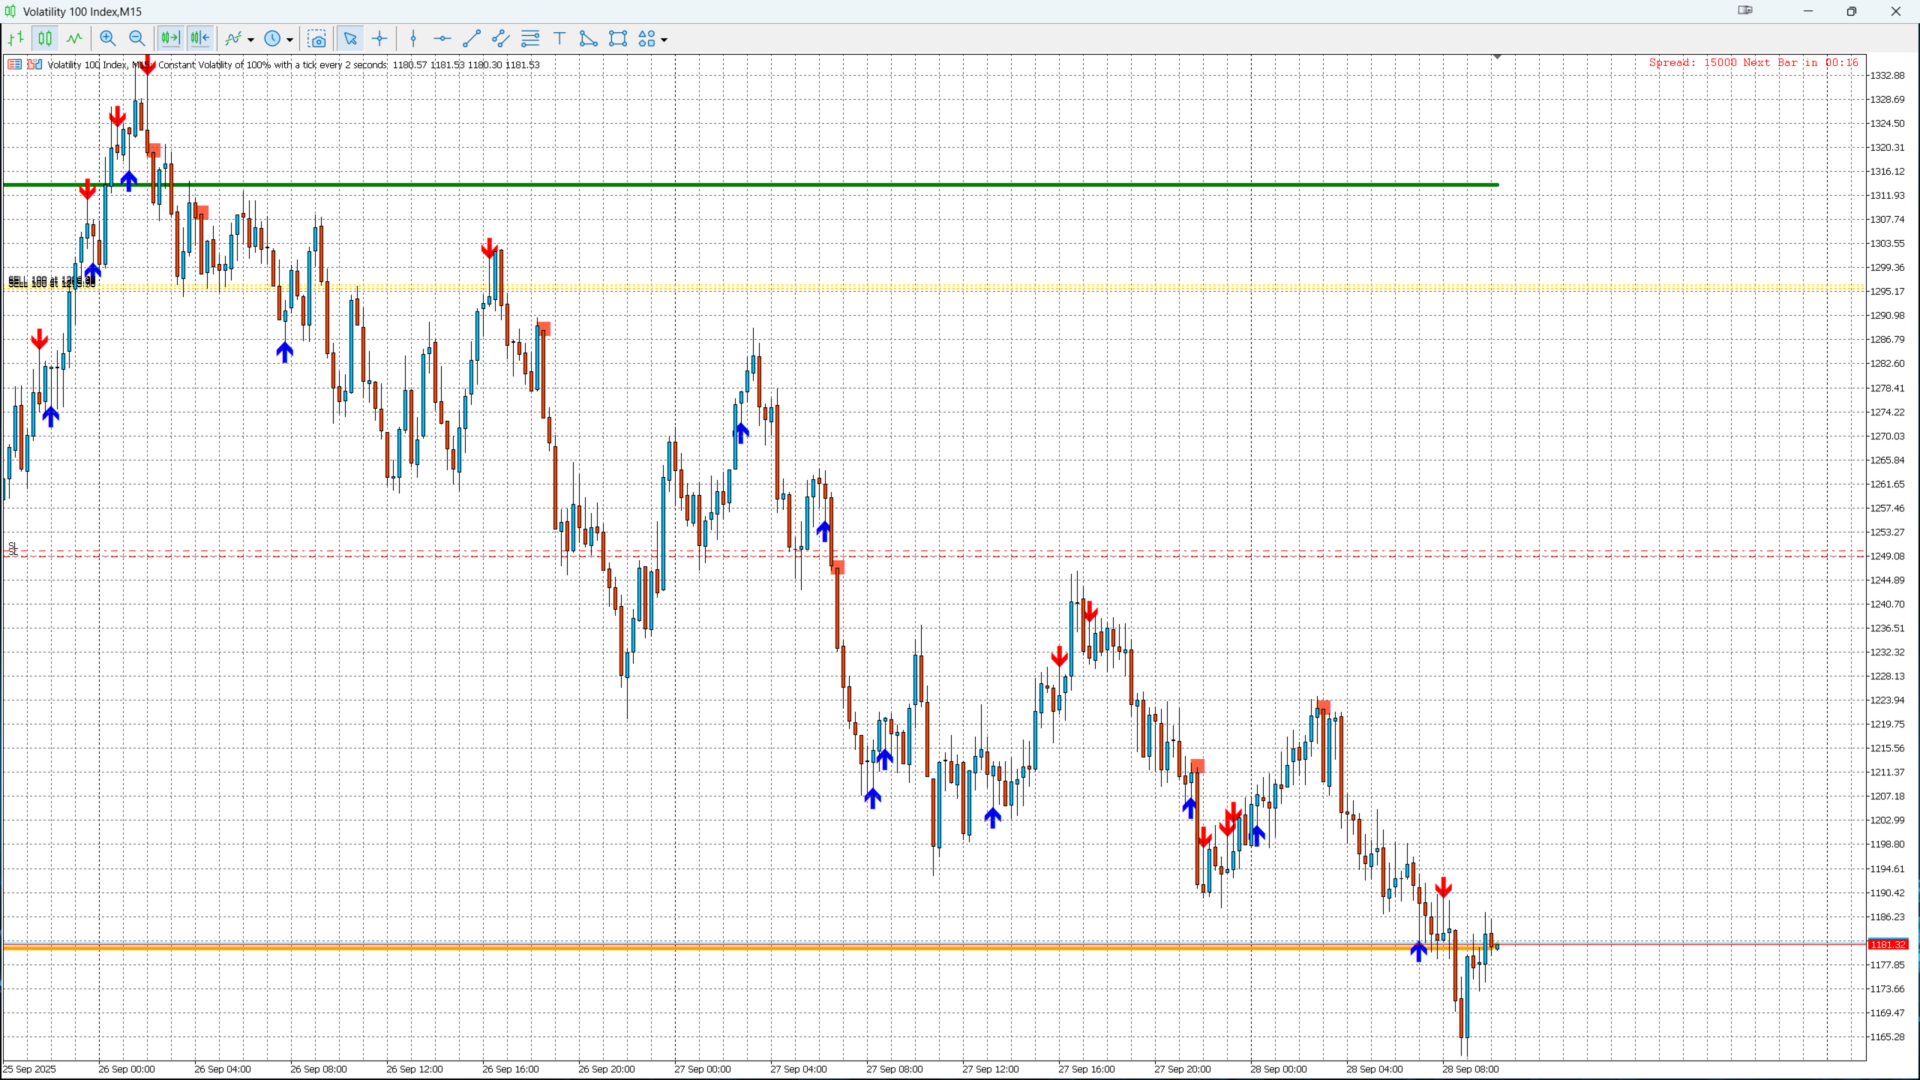
Cet indicateur avancé pour MetaTrader 5 combine l'analyse des niveaux mensuels, la reconnaissance des modèles de chandeliers japonais (PinBar et Marubozu) et un système d'alerte en temps réel.
Il aide les traders à identifier rapidement les zones clés du marché et les opportunités de trading à forte probabilité.
Caractéristiques principales
Affichage automatique des niveaux mensuels
- Niveaux haut / bas / ouvert / fermé
Détection de motifs d'inversion
- PinBar haussier
- Pinbar baissier
- Marubozu haussier
- Marubozu baissier
Signaux de trading visuels
- Flèches d'achat/vente affichées directement sur le graphique pour une analyse rapide
Système d'alerte complet
- Alertes contextuelles MT5
- Notifications push mobiles
- Alertes instantanées en temps réel
Analyse multi-temporelle
- Période de référence mensuelle configurable
Avantages
- Lecture simplifiée du marché
- Identification rapide des zones de décision clés
- Convient aux traders débutants comme aux traders confirmés.
- Compatible avec les stratégies de scalping, de trading intraday et de swing trading
Comment utiliser
Installez simplement l'indicateur sur votre graphique MT5 et recevez automatiquement des signaux visuels et des alertes dès qu'une opportunité de trading se présente.
Clause de non-responsabilité
Ce produit est un outil d'aide au trading. Il ne garantit pas les profits et doit être utilisé avec une gestion des risques appropriée.