 MetaTrader 5
 Эксперты
 Индикаторы
 Библиотеки
 Утилиты
 Виджеты
 Правила
Смотри обучающее видео по маркету на YouTube
Как купить торгового робота или индикатор
Запусти робота на
виртуальном хостинге
виртуальном хостинге
Протестируй индикатор/робота перед покупкой
Хочешь зарабатывать в Маркете?
Как подать продукт, чтобы его покупали
Новые технические индикаторы для MetaTrader 5 - 109
 На основании сигналов технических индикаторов принимаются решения относительно открытия или закрытия сделки на фондовом и форекс-рынках. Суть индикаторов заключается в математическом преобразовании цены и/или объемов финансового инструмента для прогнозирования изменений цен в будущем.
Протестируйте технические индикаторы, чтобы лучше предсказывать поведение рынка и зарабатывать на этом.

Hull Suite by Riz | MT5 Indicator Overview: Hull Suite is a premium trend-following indicator that combines three powerful Hull Moving Average variations (HMA, EHMA, THMA) into one versatile tool. Designed for traders who demand clarity and precision, this indicator helps identify trend direction with minimal lag while filtering out market noise. Key Features: Three Hull Variations – Switch between HMA (classic), EHMA (exponential smoothing), and THMA (triple weighted) to match your trading styl
FREE
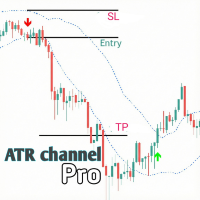
This is an indicator called ATR Channel. This indicator is made with ATR and VWMA (Volume Weighted Moving Average). This indicator will work best in a volatile market. So please try to trade during high volatile sessions and high volatile pairs.
Rules:
• Pair: Bitcoin, Gold, Nasdaq (US100) or S&P (US500) •Do not trade Forex pairs because they are low volatile.
Session: Only US session (especially start after the first 15-minute candle closes )
Trading hours: First 4 hours of the US Session .

MultiSession Volume Profile is a professional volume profile indicator for MetaTrader 5 that builds separate POC, VAH, VAL and volume histograms for multiple custom trading sessions on the same chart. It helps you see where volume truly concentrated in each part of the day (RTH, Globex, Asia, London, etc.), so you can identify key intraday levels, ranges, and magnets that many standard tools miss. Main advantages Multi-session profiles
Build up to 5 fully independent sessions with custom times

If you like this product, please give it a 5 star rating as a token of appreciation.
This indicator plots horizontal trend lines at the opening price of each quarter (Q1–Q4) on the chart. These lines visually represent quarterly open levels of the current year, which traders often use as support/resistance or reference points. Automatically plots Q1–Q4 opening levels as trend lines on the chart. Lines are dashed, colored, and labeled. Handles both current and historical quarters. Cleans up line
FREE
This indicator is a sophisticated MetaTrader 5 tool that calculates and displays Average Daily Range (ADR) levels on your chart. It draws horizontal lines representing expected price movement ranges based on historical daily volatility, helping traders identify potential daily high and low targets. ADR (Average Daily Range) = The average difference between the daily high and low over a specified period (default: 14 days). Unlike ATR which includes gaps between days, ADR focuses purely on int
FREE
If you like this product, please give it a 5 star rating as a token of appreciation.
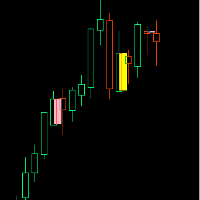
Inside Bar: A candle that is completely contained within the high-low range of the previous candle
Outside Bar: A candle that completely engulfs the high-low range of the previous candle (also called an "Engulfing Bar")
Inside Bars Consolidation Signals : Indicates market indecision/compression Breakout Setup : Often precedes significant price moves Continuation Patterns : Can signal pause in trend before con
FREE

If you like this product, please give it a 5 star rating as a token of appreciation.
This indicator calculates and draws pivot points and support/resistance levels for both daily and weekly timeframes: Pivot (central) level Support levels S1, S2, S3 Resistance levels R1, R2, R3 It allows showing daily, weekly, or both sets of pivots , giving traders visual references for potential support/resistance areas.
Pivot mode: Choose which pivots to display (weekly, daily, or both). Colors and style: C
FREE

Th is i ndicator is a versatile MetaTrader 5 tool that calculates and displays Average True Range (ATR) levels on your chart. It draws horizontal lines representing price levels based on ATR multiples from the daily opening price, helping traders identify potential support and resistance zones. 1. Multiple ATR Levels ATR1 : Standard ATR level (default: 1x ATR) ATR2 : Intermediate level (default: 2x ATR) ATR3 : Extreme level (default: 3x ATR) Each level displays both upper (High) and lower (L
FREE

If you like this product, please give it a 5 star rating as a token of appreciation.
This indicator draws vertical lines marking key Forex trading sessions (Asian, London, New York) for a configurable number of past days. These “Silver Bullet” lines help traders quickly visualize session start and end times on the chart.
DaysToDisplay: How many previous days’ session lines to show. Session colors: Customizable line colors for each session. Session start hours: Local server hours for each sessi
FREE
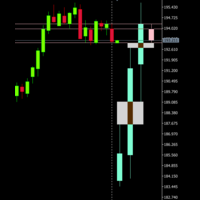
If you like this product, please give it a 5 star rating as a token of appreciation. This indicator projects Higher-Timeframe (HTF) candles onto the current chart and optionally shows their OHLC lines and Fair Value Gaps (FVGs) using ICT 3-candle logic.
Projects multiple higher timeframe candles.
Accurately preserves HTF OHLC on any lower timeframe.
Allows spacing adjustment between projected candles.
Optionally displays OHLC horizontal reference lines.
Automatically detects and draws HTF Fair
FREE
If you like this product, please give it a 5 star rating as a token of appreciation.
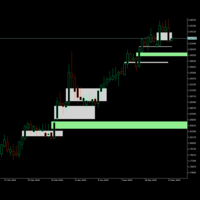
This indicator identifies and displays Fair Value Gaps (FVG) on price charts.
Fair Value Gaps are price zones where there's a significant imbalance between buying and selling pressure, creating "gaps" in price action. The indicator detects two types and when they are mitigated(touched):
Bullish FVG: When a candle's low is above the high of a candle two periods earlier.
Bearish FVG: When a candle's high is bel
FREE

If you like this product, please give it a 5 star rating as a token of appreciation.
This indicator plots horizontal lines on the chart representing the previous year’s high and low prices . These levels are widely used in technical analysis as major support/resistance references.
Automatically identifies the previous calendar year’s high and low . Plots horizontal lines on the chart at these levels. Customizable color, width, and style of the lines. Deletes lines on deinitialization. Updates
FREE

Indicator shows balance curves based on magic number for portfolio analysis. It allows to visually estimate different strategies performance on a single symbol. Any of magic number can be hidden by clicking on the value in legend. Parameters: HideAllOnStart - all magics are hidden and can be activated by clicking on its value; MAMode - shows average profit from trades; MAPeriod - Moving average period; Magics - a string with magic numbers separated by comma like "1,2,123". If this field is empty

Overlay higher timeframe candles onto the lower timeframe candles for both live time trading and back testing to see how higher timeframe candles are formed with lower timeframe candles. Helps traders to see the multi timeframe alignment between timeframes in each moment to find refined entry within market structure. Give the trader a full view of price across all timeframes by just looking at one timeframe.

Key Features Visual Risk/Reward Planning Spawns interactive rectangles on the chart for Buy and Sell setups. Pink Box: Represents your Risk (Entry to Stop Loss). Green Box: Represents your Reward (Entry to Take Profit). The Green box automatically adjusts its size based on your preferred Reward Ratio (e.g., 1:2). Auto-Lot Calculation Automatically calculates the correct Lot Size based on your Account Balance and defined Risk Percentage. Takes into account the symbol's Tick Value and Cont
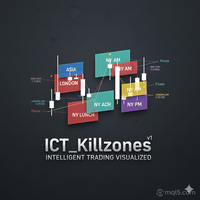
ICT Kill zones Professional Automate your ICT & Smart Money analysis with precise, dynamic session tracking and liquidity pivots. Here our more valuable tools
SMC Trend Trading , Easy SMC Trading , Institutional SMC Architect Volume Analysis Tools , Volume flow Profile , Market volume profile , FVG with Volume , Liquidity Heatmap Profile , Volume Spread Analysis Product Description Stop wasting time drawing boxes and lines every single day. ICT Killzones Professional is the u
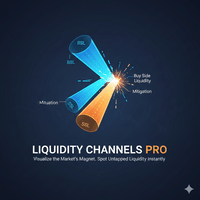
Liquidity Channels Pro MT4 HERE is a sophisticated Smart Money Concepts (SMC) tool designed to automate the identification of Buy Side Liquidity (BSL) and Sell Side Liquidity (SSL) . Unlike standard support and resistance indicators, this tool doesn't just draw lines; it projects dynamic expanding channels based on volatility (ATR) from key pivot points. Crucially, it follows the "Mitigation" logic used by institutional traders: once liquidity is taken (price touches the level), th
N/B: All our product purchase comes with our free ‘’DAILY SCALPER EA’’ - bit.ly/4qlFLNh Whatsapp Developer for yours after successful purchase
Premium Breakout Scanner Indicator: Your Institutional-Grade Breakout Trading System
DISCOVER HIGH-PROBABILITY BREAKOUTS BEFORE THEY HAPPEN
THIS IS A FOUR-CANDLE BREAKOUT STRATEGY/SYSTEM WITH 70%+ ACCURACY .
Tired of missing breakout moves? Entering too late? Getting stopped out by false breakouts? The Premium Breakout Scanner combines instit

Dynamic Market Watch & Timeframe Dashboard (MT5 Indicator) 1. Product Overview The Dynamic Market Watch & Timeframe Dashboard is a professional chart navigation utility designed for MetaTrader 5. It transforms the static "Market Watch" list into an interactive, on-chart control panel. Designed for efficiency, this indicator creates a clean, vertical tiling system that allows traders to switch between assets and timeframes instantly with a single click. It features an intelligent auto-layou

Extreme Confirmation: Momentum and Trend Oscillator Extreme Confirmation is a technical oscillator designed to filter market noise and provide visual confirmation of trend direction and potential reversal zones. By combining dual-period momentum analysis with a dynamic signal cloud, the indicator assists traders in identifying technical entry and exit points across various market conditions. Key Features Dual-Line Crossover: Utilizes Fast (13-period) and Slow (34-period) calculations to detect

MercariaPattern1-2-3 відстежує рух ціни, знаходить трьоххвильові структури 1-2-3 та підсвічує момент, коли сценарій підтверджується пробоєм ключового рівня. MercariaPattern1-2-3 tracks price movement, detects three-leg 1-2-3 structures and highlights the moment when the scenario is confirmed by a key level breakout. Індикатор збирає локальні свінги в компактну фігуру 0–1–2–3 , чекає підтвердженого пробою та будує стрілку входу з готовими рівнями SL/TP. The indicator combines local swings into a

The indicator reads MT5’s built-in economic calendar and organizes events into three horizontal lanes : High-impact events (red) Medium-impact events (orange) Low-impact events (gray) (optional) Each lane scrolls horizontally across the chart like a ticker. You can choose whether to show: Today’s events only Or all events for the current week This is a complete fundamental dashboard for MT5. It gives you: Real-time scrolling economic events
Interpreted color-coded results
Day/Week filterin

Session Finder — Professional Multi-Session Market HUD for MetaTrader 5 Stop guessing when volatility will strike. Trade with absolute timing precision. Session Finder is a premium, high-performance on-chart dashboard engineered for MetaTrader 5. It gives day traders, scalpers, and swing traders real-time visibility into the world's major trading sessions— Sydney, Tokyo, London, and New York . By tracking exact market overlaps and session transitions right on your active chart, you can easily hu

Gold Beast XAUUSD – The Ultimate Gold Arrow Indicator
After 6+ years and tens of thousands of real trades, this is the FINAL and most powerful Gold arrow system ever released.
Gold Beast XAUUSD : • Arrows ( confirmed only at candle close ) • Blue upward arrow = BUY • Red downward arrow = SELL • Pure EMA × RSI crossover – zero lag, zero fake outs • Pre-loaded with the best XAUUSD settings (EMA 7 – the Gold holy grail) • Push, Email + Sound alerts included
Default Beast Settings (already loade

Delta + CVD & CVD Candles
Order-flow indicator combining Delta (Ask–Bid), Cumulative Volume Delta (CVD), and a unique CVD-based synthetic candle system. Shows buy/sell pressure, volume aggressiveness, and momentum shifts with optional Delta histogram, CVD line, and CVD+Delta combined candles. Useful for scalping, intraday trading, divergence detection, and understanding buyer/seller dominance. Overview The Delta + CVD & CVD Candles Indicator combines multiple order-flow tools into one clean
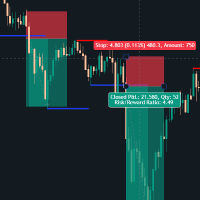
Support & Resistance Breakout Indicator This custom-built MT5 indicator automatically identifies key price levels where the market has historically reversed (support and resistance zones) and alerts traders when these levels are broken with conviction. What it does: The indicator scans price action to detect significant swing highs and lows, then draws dynamic support and resistance lines that extend forward until they're either replaced by a new level or broken by price. When a breakout occurs,

SuperTrend Plus Dema – Faster Trends, Less Noise SuperTrend Plus Dema is an advanced evolution of the classic trend-following indicator. Unlike standard SuperTrend indicators that rely solely on High/Low or Close prices, this tool integrates the Double Exponential Moving Average (DEMA) as a calculation source. This unique combination offers a smoother trend line with significantly reduced lag, allowing you to catch trends earlier while filtering out market noise. Why use SuperTrend Plus Dema? Re
Indicator logic (quick summary) Retail sentiment input : You type in current retail long % from MyFxBook/FXSSI/etc. If > 60% long → contrarian bearish If < 40% long → contrarian bullish Else → neutral Trend bias : EMA(50) vs EMA(200) → primary trend MACD(6,13,5) direction as confirmation Volatility bias : ATR(14) vs ATR(50) → expansion ratio Too low/too high volatility → “AVOID” Session bias : Time-based classification (server time): Asia, London, New York Just a label + “quality fact

This is an extremely clean, efficient, and well-designed CBDR engine.
Calculates ICT’s Central Bank Dealers Range (CBDR) Using only candle bodies — NOT wicks (open–close structure).
For a defined time window (e.g., 00:00–05:00 New York).
For each past day and also for today in real time. Draws the following on chart: A rectangle showing the entire CBDR body range The CBDR High line (body top) The CBDR Low line (body bottom) An optional midline A pip label showing total CBDR size Optional extens

This MetaTrader 5 indicator plots ICT Killzone session markers on the chart using vertical lines . It draws the start and end times for three institutional trading sessions— Asian , London , and New York —for a user-defined number of recent historical days. No buffers or plots are used; instead, the indicator relies entirely on chart objects (OBJ_VLINE) .
1. Inputs and Parameters The indicator allows full customization of each killzone segment: General DaysToDisplay : number of past days to dra

TScalper: Trend and Momentum Indicator TScalper is a non-repainting technical indicator designed to visualize market momentum and trend direction. By analyzing volume and price action, it projects a clear sentiment cloud in a dedicated sub-window to help traders identify current market control without complex configuration. Key Features Market Sentiment Cloud: Displays a real-time visual representation of market control. A green cloud indicates bullish control (buyer dominance), while a red clo

Here's a simple description for your indicator: FVG & CHOCH Detector - Visual Indicator for MT5 A clean and simple visual indicator that detects Fair Value Gaps (FVG) and Change of Character (CHOCH) patterns on any timeframe. Features: Bullish FVG Detection : Identifies bullish fair value gaps and marks them with blue boxes Bearish FVG Detection : Identifies bearish fair value gaps and marks them with red boxes CHOCH Detection : Detects trend changes with visual markers: Bullish CHOCH (cyan/aqua
Product Description: Swing Points & Liquidity (MT5) What it does:
This indicator automatically identifies significant "Swing Highs" and "Swing Lows" (Fractals) on your chart. It assumes that these points represent Liquidity (where Stop Losses and Buy/Sell stops are resting) or Supply and Demand Zones . When a Swing High is formed, it projects a Red Box/Line to the right (Supply/Resistance). When a Swing Low is formed, it projects a Green Box/Line to the right (Demand/Support). As
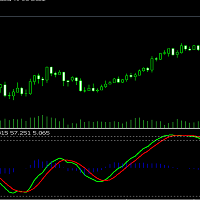
The WaveTrend (LazyBear) indicator is a momentum-based oscillator designed to identify reversal points , trend strength , and overbought/oversold conditions in the market. It is widely used in both Forex and Cryptocurrency trading due to its ability to detect turning points earlier than traditional oscillators like RSI or Stochastic.
(I have Converted from the original TradingView Pine Script version)
FREE

Smash FX System — Inside-Bar Breakouts, Reversals & Continuations (Indicator) Tagline: Smash the noise, catch the clear moves — high-clarity inside-bar breakout, reversal and continuation arrows designed for clean entries and professional journaling. Short promo Smash FX System pinpoints high-probability inside-bar breakouts, smart reversals and continuation setups with on-chart arrows and exact levels — built for traders who want clear, repeatable setups and perfect order-management handoffs f

VISUAL THEME SWITCHER PRO v3.2
Professional chart theme switcher for MetaTrader 5 with advanced features and multi-language support.
KEY FEATURES: • 9 Professionally Designed Themes • Drag & Drop Panel Interface • Multi-language Support (5 languages) • 7-Day Fully Functional Trial • Fullscreen Mode Toggle • Auto-Generated Theme Buttons • Professional Security System • Position Restoration • One-Click Theme Application
PROFESSIONAL THEMES INCLUDED: 1. NEON - Futuristic black and gree

Fast Multi-Timeframe Pivots – Precision Levels from M1 to W1 • Ultra-fast pivot detection across M1–W1
• Clean, stable architecture with zero repaint
• Perfect for breakout, trend, and reversal strategies
• Automatic color-coded levels for instant clarity
• Works on all assets: Forex, Crypto, Metals, Indices
• Lightweight design – ideal for real & prop-firm trading Fast Multi-Timeframe Pivots (M1 to W1) A high-performance pivot indicator designed for professional traders, automated systems, and
# ** Multi-Timeframe Fibonacci Levels Pro**
** Transform Your Trading with Institutional-Grade Fibonacci Analysis **
Multi-Timeframe Fibonacci Levels Pro is a revolutionary MetaTrader 5 indicator designed for day traders and scalpers. It automatically calculates and displays Fibonacci retracement levels from multiple higher timeframes directly on your 1-5 minute charts, giving you complete market structure visibility without switching between timeframes.
---
## ** Key Features**
*

OHLC & Smart Sessions
"Professional Market Structure Tool: Combine Daily OHLC Levels with Real-Time Session Analysis"
DESCRIPTION Professional trading indicator that combines Previous Day OHLC analysis with intelligent trading session tracking. Identifies key market structure levels, session highs/lows, and provides multi-channel alerts for precise trading decisions.
FULL DESCRIPTION
TRANSFORM YOUR TRADING WITH INSTITUTIONAL-GRADE ANALYSIS
Are you tired of manually drawing daily level

Haven Bar Replay — Ваш персональный тренажер для трейдинга Представляем Haven Bar Replay – это профессиональный симулятор для ручной торговли и тестирования стратегий. Он превращает ваш график MT5 в исторический плеер, позволяя проживать месяцы рыночных движений за считанные минуты. Симулятор торговли с виртуальными сделками -> Haven Trading Simulator | Другие мои продукты -> ЗДЕСЬ . Хотите научиться торговать прибыльно, но не готовы ждать формирования сетапов часами? Этот инструмент
FREE

Market Time Watch Лёгкий, чистый и незаменимый инструмент для отображения времени на графике трейдера Market Time Watch — это профессиональный индикатор для отображения времени на графике, созданный для трейдеров, которым требуется точное локальное время, серверное время и таймер текущей свечи. Индикатор показывает всю необходимую информацию прямо на графике, не перегружая интерфейс и не создавая лишних объектов. Если вы торгуете скальпинг, внутри дня, по времени закрытия свечей или вам просто н
FREE

SMART STRUCTURE: Идеальный Инструмент Институционального Анализа (SMC) Смотрите на Рынок Так, Как Это Делают Умные Деньги. Представьте, что у вас есть безотказный торговый помощник, который не просто указывает на возможность, а полностью автоматизирует анализ концепций умных денег (SMC) , раскрывая структурную устойчивость рынка в режиме реального времени. Это и есть SMART STRUCTURE . Это не очередной сигнал. Это профессиональный аналитический механизм для MetaTrader 5, разработанный для мгновен

[ Мой канал ] , [ Мои продукты ] Lorentzian Distance Classifier — это торговый индикатор на основе машинного обучения, который использует расстояние Лоренца как основной метрический показатель в рамках алгоритма приближённых ближайших соседей (ANN). Вместо традиционного евклидова расстояния он рассматривает ценовое движение как происходящее в «искажённом» пространстве цена–время (аналогично тому, как массивные объекты искривляют пространство-время в теории относительности). Такой подход делает к
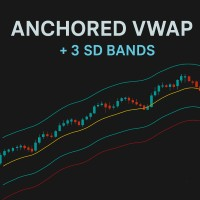
Анкродированный VWAP (AVWAP) с полосами стандартного отклонения – MT5 Повышайте точность своих сделок с помощью AVWAP, дополненного динамическими полосами стандартного отклонения . Разработано для трейдеров, которым важны скорость, четкость и возможность принимать мгновенные решения , этот индикатор обеспечивает профессиональный анализ VWAP прямо на графиках MT5, помогая быстро определять ключевые уровни и высоковероятные сигналы. Основные возможности Несколько якорей: Добавляйте столько линий A
FREE

Привязываемый VWAP — это разновидность традиционного VWAP, в которой расчет показателя начинается с определенного момента времени (привязка), а не с начала торговой сессии или фиксированного временного интервала. Это может быть полезно для трейдеров, которые хотят оценить поведение цены относительно объема, начиная с конкретных событий, таких как важная новость, начало тренда или техническое событие, например, прорыв уровня поддержки или сопротивления. Индикатор работает на Форекс, акциях и инде
FREE

Индикатор сигналов для бинарных опционов, который также эффективно применяется на форексе и других рынках. Подходит для краткосрочной сеточной торговли на M1–M5 и включает сигналы поэтапного наращивания позиций. Индикатор использует двухуровневую адаптацию: базовый профиль скорости (настройка “быстрый/плавный” с самого старта) и автоадаптацию по результатам сделок , которая подстраивает фильтры под текущий рынок, учитывая серии выигрышных и убыточных сигналов. Модель ищет на графике короткие на

Buyer Seller Balance Analyzer предоставляет комплексный обзор силы покупателей и продавцов на разных таймфреймах. Основные компоненты: Таблица Buyer/Seller Balance Отображает соотношение покупателей и продавцов Включает таймфреймы от M1 до MN1 Цветовое различие (зелёный = покупатели, красный = продавцы) Ключевые метрики: Buyers (%) – процентное соотношение покупателей Sellers (%) – процентное соотношение продавцов ️ Balance – разница между покупателями и продавцами
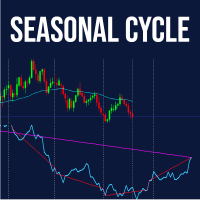
Seasonal MT5 Indicator Откройте силу сезонности рынка с помощью индикатора Seasonal MT5, разработанного для дневного таймфрейма, чтобы выявлять и визуализировать повторяющиеся ценовые модели на основе исторических данных. Идеален для трейдеров, ищущих аналитическое преимущество на рынке Forex, акций или сырьевых товаров. Основные функции: Строит сезонную линию тренда на основе исторических дневных данных, показывая предсказуемые рыночные циклы. Отображает прямую линию, соединяющую сезонные экстр
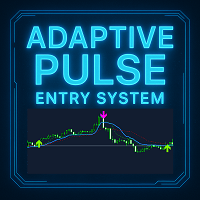
Adaptive Pulse - Профессиональная Система Торговых Сигналов Краткое описание Adaptive Pulse — это профессиональный индикатор торговых сигналов на базе адаптивной технологии анализа рынка. Индикатор автоматически подстраивается под волатильность и генерирует точные сигналы покупки и продажи с визуальными стрелками на графике. Работает на всех таймфреймах и финансовых инструментах. Основные возможности Индикатор предоставляет трёхуровневую систему анализа с тремя независимыми адаптивными линиями,

Trading Report — лёгкий и чрезвычайно функциональный визуальный индикатор, который в реальном времени показывает основные данные по счёту и торговле — всё в одном элегантном, полностью перетаскиваемом мини-панели с минималистичным дизайном. Основные возможности Обновление на каждый тик (открытая позиция и плавающий P/L в реальном времени) Детали текущей позиции (BUY/SELL + объём + цена входа + плавающий P/L с зелёным/красным цветом) Daily P/L и изменение баланса за день (автоматическая окраска:
FREE
Squeeze Momentum Alert 1. Определение точек «взрыва» цены (The "Squeeze") Главное преимущество этого индикатора — способность улавливать моменты, когда рынок «консолидируется» или «накапливает энергию» перед сильным движением. Почему это хорошо: Рынок цикличен: затишье (консолидация) сменяется всплесками волатильности. Этот инструмент говорит вам: «График сжимается, готовьтесь к сильному импульсу» , что позволяет не упустить начало крупного тренда. 2. Детальное определение «силы» тренда (Color C
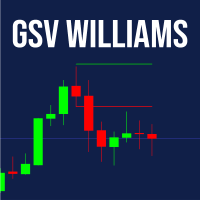
GSV – Guided Swing Value Levels Индикатор GSV – Guided Swing Value Levels разработан для трейдеров, которые хотят находить ценовые области, где рынок чаще всего реагирует с высокой статистической точностью.
Его расчет вдохновлен идеями Ларри Вильямса, представленными в его книге «Long-Term Secrets to Short-Term Trading» , где подчеркивается важность статистического среднего колебаний рынка для прогнозирования уровней, где цена, вероятнее всего, остановится, скорректируется или развернется. Этот
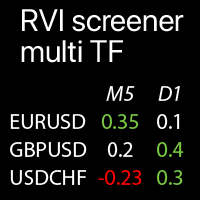
Мультитаймфреймовые значения RVI для выбранных символов: сравнение текущих рыночных трендов Индикатор отображает значения индикатора Relative Vigor index (RVI) со всех выбранных таймфреймов и символов в единой таблице , что позволяет быстро анализировать текущие рыночные ценовые тренды . Моя многофункциональная утилита : более 66 функций | Свяжитесь со мной по любым вопросам | Версия для MT4 Каждый символ можно настраивать: удалять или заменять. Вы
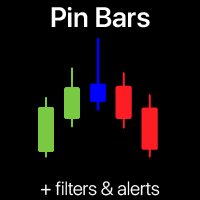
Сканер паттерна Пин Бар | Умные оповещения и фильтр тренда Никогда больше не пропускайте высоковероятный разворот по Пин Бару! Этот автоматизированный сканер паттерна Пин Бар делает всю тяжелую работу за вас.
Этот торговый инструмент сканирует ваши графики в реальном времени, идентифицирует мощный паттерн Пин Бар (Молот/Падающая звезда) и отправляет вам мгновенные сигналы. Торговый индикатор разработан как для начинающих, так и для опытных трейдеров, которые хотят использовать силу чистого пра

Это активно поддерживаемый релиз, переработанный и расширенный для текущих версий MT5.
Валютные рынки движутся в относительном выражении. Даже многообещающая торговая установка по паре EURUSD может оказаться неудачной, если евро ослабевает в целом, или же оказаться успешной лишь потому, что доллар падает повсеместно. Анализ одной пары в отрыве от контекста не позволяет учесть эту ситуацию.
Currency Strength Suite предоставляет структурированный обзор в режиме реального времени относительной с

Here our more valuable tools
SMC Trend Trading , Easy SMC Trading , Institutional SMC Architect Volume Analysis Tools , Volume flow Profile , Market volume profile , FVG with Volume , Liquidity Heatmap Profile , Volume Spread Analysis The Liquidity Heatmap is a sophisticated institutional trading tool designed to reveal where over-leveraged traders are trapped. By calculating estimated liquidation levels based on volume spikes and leverage, this indicator draws a dynamic "h

Metatrader 5 version of the known "Currency Slope Strength" MT4 indicator. This tool was designed to visually measure the strength of major global currencies in real time, allowing to identify trending currencies, reversals, and cross-currency opportunities. Currencies: AUD, CAD, CHF, EUR, GBP, JPY, NZD and USD.
Level Crossing alerts (Pop-up,Push,Email). Customizable timeframes (Main and Extra). Customizable colors. Non-repainting . The indicator runs in Strategy Tester, but it may take a while
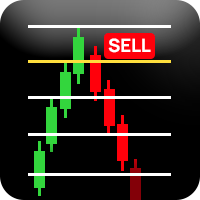
️ ВАЖНО: ОЦЕНОЧНАЯ ВЕРСИЯ - ОГРАНИЧЕННАЯ ПОДДЕРЖКА СИМВОЛОВ Данный индикатор доступен только для ОЦЕНКИ и поддерживает только: EURUSD Volatility 50 (1s) Index Индикатор не будет работать на других торговых символах. Индикатор Richchild Quarters Theory ОЦЕНКА Профессиональный инструмент анализа рыночной структуры Обзор Это профессиональный торговый индикатор, предназначенный для анализа рыночной структуры с использованием динамических расчетов диапазонов и анализа на основе четвертей. Индика
FREE

http://www.tradepositive.lat
ALGO Smart Flow Structure Indicator The ALGO Smart Flow Structure Indicator is designed for serious traders who use objective Market structure. Forget noise and slow indicators; this tool provides you with a crystal-clear, unambiguous view of structural breakouts across all timeframes. Based on the rigorous rules of the ALGO Smart Flow methodology, the indicator filters out internal structure and only shows you the Major Structural Points (Swing Points) , ensuri
FREE

Gamma & Volatility Levels Pro [XAUUSD Edition] – The indicator used by professional gold traders in 2025 Fully automatic indicator developed exclusively for XAUUSD (Gold). Displays in real time the most powerful institutional levels that move gold price every single day: • HVL (High Volatility Level) – Orange dashed line Dynamic extreme volatility level (20-period SMA + 1 standard deviation). Gold bounces or breaks this level 87 % of sessions with moves of +$40 to +$120. • CALL RESISTANCE – Blue
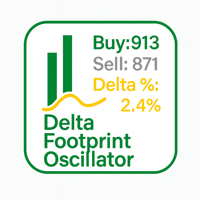
Delta Footprint Oscillator – профессиональный инструмент ордер-флоу для MT5 Delta Footprint Oscillator показывает реальное соотношение покупок и продаж прямо на графике. Индикатор анализирует изменения mid-цены по каждому тику и рассчитывает Delta , Delta% , а также сохраняет полную историю footprint для каждой свечи .
Идеален для скальпинга, внутридневной торговли и анализа потока ордеров. Основные возможности Настоящий ордер-флоу дельта-анализ на основе движения Bid/Ask Цветная гистограмма д
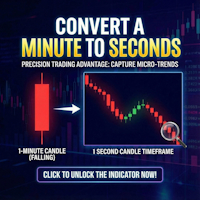
Second Timeframe Pro — Видьте рынок раньше других!
Разблокируйте скрытый уровень ценового действия
Пока другие трейдеры смотрят на минутные свечи — вы уже видите 60 свечей внутри каждой минуты!**
Что такое Second Timeframe Pro ?
Это революционный индикатор, который создаёт полноценные свечные графики с секундными таймфреймами прямо в MetaTrader 5.
Стандартный MT5 ограничивает вас минутным графиком. Но рынок не останавливается каждую минуту — он пульсирует каждую секунду. SecondCharts Pro
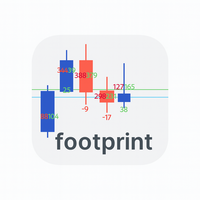
Footprint_Indicator_Fixed — это лёгкий и эффективный индикатор-футпринт, который даёт трейдеру детальное понимание рыночной микро-структуры в реальном времени.
Индикатор отображает счётчики покупок/продаж (tick buys/sells) и дельту прямо на каждой свече, что позволяет мгновенно видеть, какая сторона рынка доминирует. Основные преимущества ️ Подсчёт покупающих/продающих тиков в реальном времени ️ Отображение дельты под каждой свечой ️ Чистое и аккуратное отображение на графике без лишних буфер
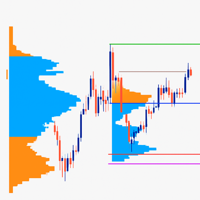
Daily Volume Profile (несколько дней) для MT5 Этот индикатор строит стабильный и точный Дневной Volume Profile за несколько последних дней , автоматически обновляющийся каждую минуту без мерцания и задержек.
Отображает полную рыночную структуру: POC, VAH, VAL, Value Area, High/Low дня, распределение объёмов , и автоматически подстраивается под любой таймфрейм. Основные возможности:
Профиль объёма за последние N дней (настраивается)
Точные линии POC, VAH, VAL + подписи
High и Low каждого д

Keltner Channels Enhanced - Professional Indicator with Alerts
Full Description:
Keltner Channels Enhanced is a professional-grade technical indicator that brings the classic Keltner Channels to a new level with advanced features and complete customization.
KEY FEATURES
Advanced Calculation Exponential Moving Average (EMA) based middle line. Average True Range (ATR) for dynamic channel width. Customizable price type (Close, Open, High, Low, Median, Typical, Weighted). Horizontal shift o
FREE
RSI Bollinger DualStrike Signals offers a clear and structured approach to identifying areas that may be favorable for potential trend reversals. By combining the RSI with Bollinger Bands, the indicator highlights moments when price shows signs of pressure or loss of momentum. The BUY/SELL signals help traders make more organized and disciplined decisions. It is a useful tool for scalping, day trading, or swing trading not to predict the market, but to improve the reading and understanding of pr
FREE

Global Session 4X Indicator Global Session 4X is a visual indicator that displays active Forex trading sessions around the world in real time. Designed with precision and respect for market diversity, it covers financial hubs such as London, New York, Tokyo, Sydney, São Paulo, Istanbul, Riyadh, Toronto, and more. Each session is shown as a color-coded band highlighting the most traded currency pairs in that region. The layout is clean, modern, and fully customizable — traders can choose which se
FREE

Volatility Break Signals Description:
The Volatility Break Signals is an indicator designed to detect potential trend changes while partially filtering market noise. It uses an adaptive volatility measure based on the selected price (Close, Open, High, Low, etc.) and generates Buy and Sell signals when the price shows a reversal relative to the previous direction. How it works: Price Volatility Measurement The indicator calculates the absolute price changes from bar to bar ( |price - previous
FREE

Nadaraya-Watson Envelope Indicator for MT5 Overview
This indicator expands on the original Nadaraya-Watson smoothing methods by introducing a dynamic envelope system built using kernel regression. Unlike the standard Nadaraya-Watson estimator, this tool applies a contrarian approach: the envelope boundaries are designed to identify potential reversal zones when price extends too far from its smoothed trend estimate. The indicator includes integrated alerts based on price crossings above or belo
Here our more valuable tools MT4 VERSION
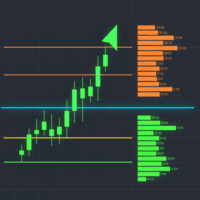
SMC Trend Trading , Easy SMC Trading , Institutional SMC Architect Volume Analysis Tools , Volume flow Profile , Market volume profile , FVG with Volume , Liquidity Heatmap Profile , Volume Spread Analysis 2. Key Features Dynamic Filtering : The core feature. As soon as the current price crosses a historical liquidity level, that level disappears. This reduces chart clutter and prevents you from trading off "dead" support/resistance. Liqu
MetaTrader Маркет - торговые роботы и технические индикаторы для трейдеров, доступные прямо в терминале.
Платежная система MQL5.community разработана для сервисов платформы MetaTrader и автоматически доступна всем зарегистрированным пользователям сайта MQL5.com. Ввод и вывод денежных средств возможен с помощью WebMoney, PayPal и банковских карт.

Вы упускаете торговые возможности:
- Бесплатные приложения для трейдинга
- 8 000+ сигналов для копирования
- Экономические новости для анализа финансовых рынков
Регистрация
Вход
Вы принимаете политику сайта и условия использования
Если у вас нет учетной записи, зарегистрируйтесь