Aklamavo Trading Sessions

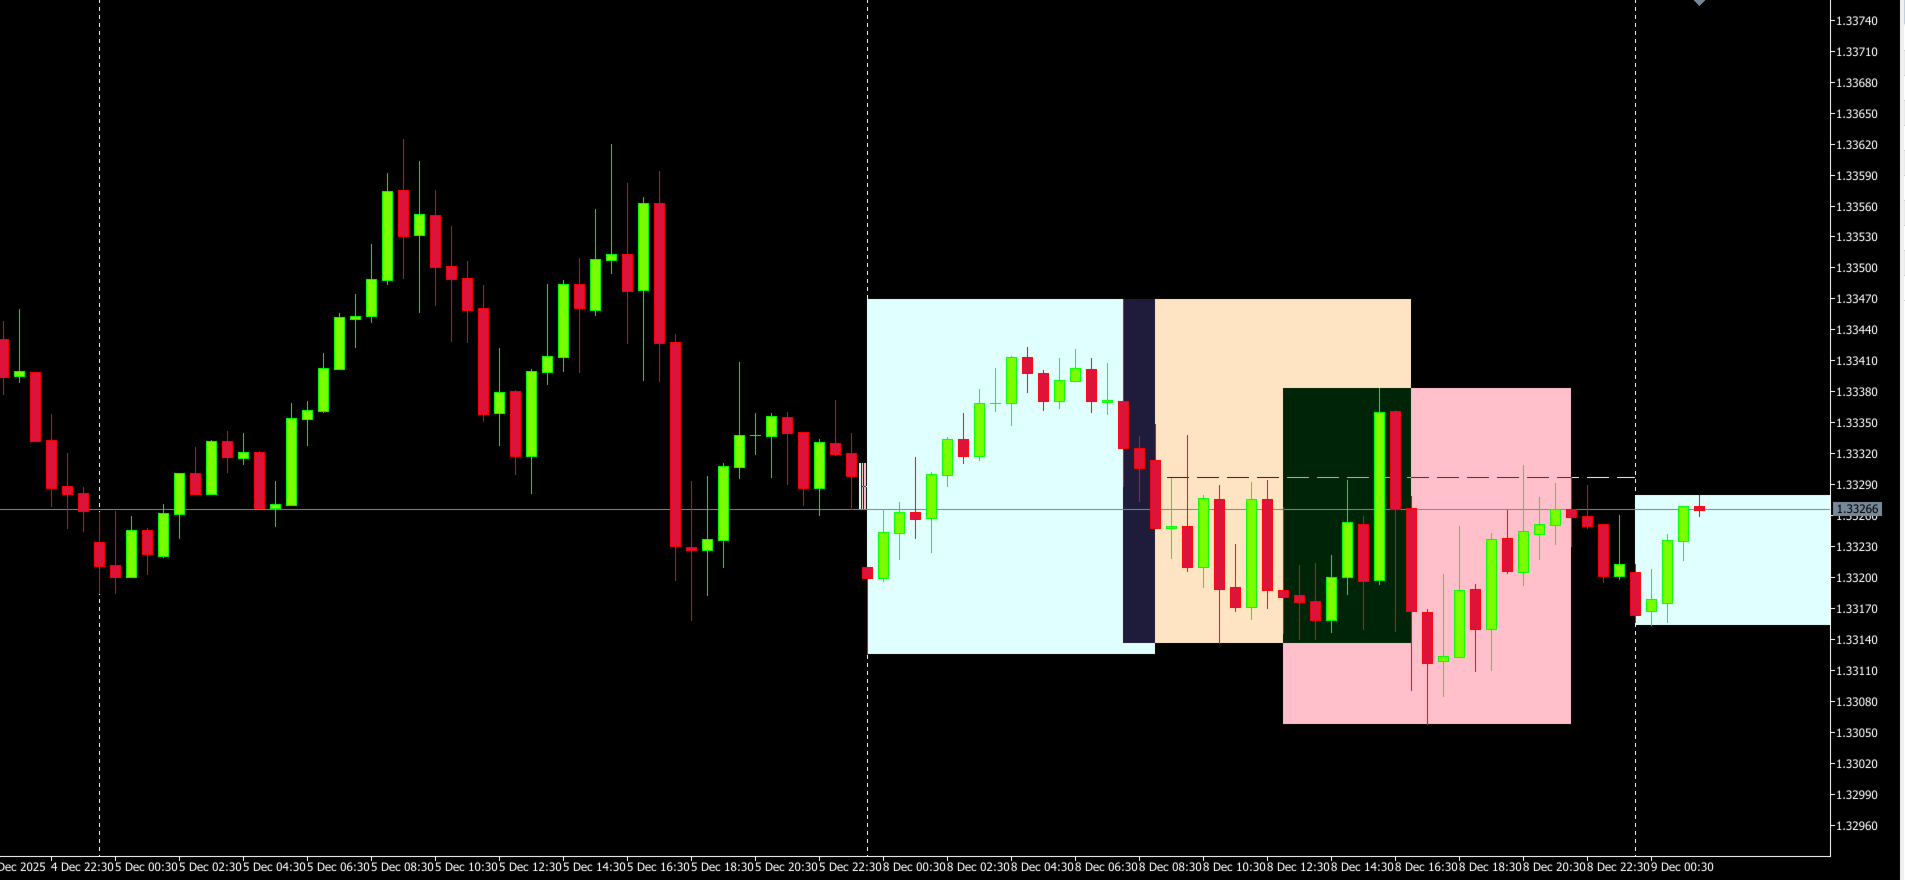
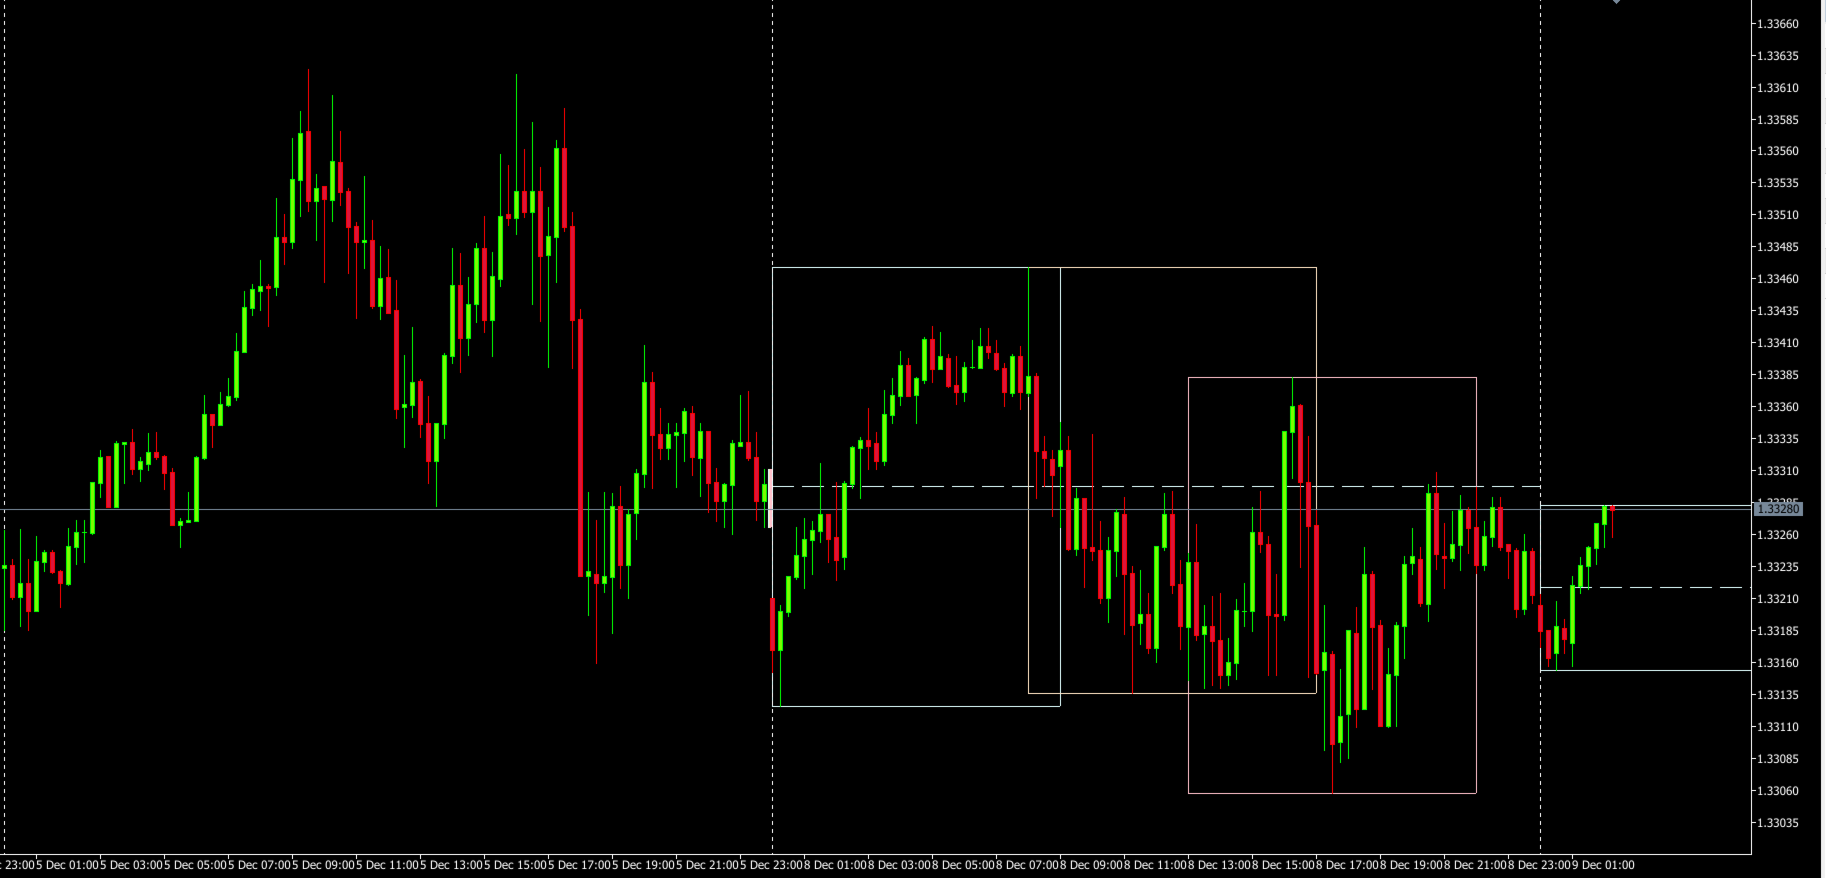
This ForexTrading Sessions indicator is a powerful visual tool for MetaTrader 5 that highlights the three major forex trading sessions (Asian, London, and New York) on your chart with the Asian Mid-line.

1. Trading Session Visualization

  • Asian Session: 00:00 - 09:00 GMT (blue/aqua color)

  • London Session: 08:00 - 17:00 GMT (magenta color)

  • New York Session: 13:00 - 22:00 GMT (orange color)

2. Time Zone Adaptation

  • TimeZoneShift input allows you to adjust sessions to your local time

  • Example: If you're in EST (GMT-5), set  TimeZoneShift = -5

  • The indicator automatically handles day boundaries when sessions cross midnight

3. Visual Customization

  • FillSessions: Toggle colored backgrounds for sessions

  • FillOpacity: Control transparency of session fills (0-100%)

  • BorderOpacity: Control transparency of session borders

  • Custom colors for each session (AsiaColor, LondonColor, NYColor)

4. Asian Session Midline

  • DrawMidline: Toggle a horizontal midline for the Asian session

  • The midline extends across the entire current trading day

  • Uses the same color as the Asian session

  • Helps identify the Asian session's price range midpoint

5. Display Options

  • DaysToShow: Choose how many past days to display (1-∞)

  • Sessions are drawn as semi-transparent rectangles showing the price range

  • Object descriptions show both GMT and local times for reference

How It Helps Traders:

Session Overlap Identification

  • Visualizes when sessions overlap (London/NY overlap is particularly volatile)

  • Shows Asian/London overlap period

Time Zone Convenience

  • No mental calculations needed for session times

  • Perfect for traders in different time zones

Price Action Context

  • Shows historical price ranges during each session

  • Helps identify which sessions are most active for your instrument

Visual Reference

  • Colored backgrounds make it easy to spot session boundaries

  • Quick reference for session-based trading strategies

Typical Use Cases:

  1. Session-Based Trading: Identify optimal entry times based on session activity

  2. Volatility Awareness: Know when major sessions are active/overlapping

  3. Backtesting: Visual reference for session-based strategy performance

  4. Market Structure: See how price behaves during different sessions


The indicator is particularly useful for forex traders who follow session-based strategies, news traders wanting to avoid low-liquidity periods, and any trader wanting a quick visual reference of market session timings.
Рекомендуем также
Индикатор подчёркивает те моменты, которые профессиональный трейдер видит в обычных индикаторах. VisualVol визуально отображает разные показатели волатильности в единой шкале и общем масштабе. Подчёркивает цветом превышение показателей объёма. Одновременно могут быть отображены Тиковый и Реальный Объем, Действительный диапазон, ATR, размер свечи и ретурнс (разница open-close). Благодаря VisualVol вы увидите рыночные периоды и подходящее время для разных торговых операций. Эта версия предназначен
FREE
Value Chart Candlesticks
Flavio Javier Jarabeck
4.57 (14)
The idea of a Value Chart indicator was presented in the very good book I read back in 2020 , " Dynamic Trading Indicators: Winning with Value Charts and Price Action Profile ", from the authors Mark Helweg and David Stendahl. The idea is simple and the result is pure genius: Present candlestick Price analysis in a detrended way! HOW TO READ THIS INDICATOR Look for Overbought and Oversold levels. Of course, you will need to test the settings a lot to find the "correct" one for your approach. It
FREE
Общее описание Этот индикатор — усовершенствованная версия классического канала Дончия с добавлением практических функций для реальной торговли. Помимо стандартных трёх линий (верхняя, нижняя и средняя), система определяет пробои и отображает их на графике стрелками, показывая только линию, противоположную текущему направлению тренда для более чистого восприятия. Индикатор включает: Визуальные сигналы : цветные стрелки при пробое Автоматические уведомления : всплывающие окна, push и email Фильтр
FREE
JT360 DNA Mini PnL Pointer V1.04 Public Компактно. Наглядно. Всегда перед глазами. JT360 DNA Mini PnL Pointer — это лёгкий индикатор для MetaTrader 5, который отображает суммарную текущую прибыль или убыток по всем открытым позициям текущего символа графика. Компактная индикация непосредственно на графике объединяет PnL относительно первоначального риска в формате R, тонкую мини-полоску и настраиваемую цветовую матрицу. Фирменные цвета JT360 — бирюзовый и пурпурный — выделяют крайние значения и
FREE
Follow The Line MT5
Oliver Gideon Amofa Appiah
4.6 (35)
This indicator obeys the popular maxim that: "THE TREND IS YOUR FRIEND" It paints a GREEN line for BUY and also paints a RED line for SELL. (you can change the colors). It gives alarms and alerts of all kinds. IT DOES NOT REPAINT and can be used for all currency pairs and timeframes. Yes, as easy and simple as that. Even a newbie can use it to make great and reliable trades. NB: For best results, get my other premium indicators for more powerful and reliable signals. Get them here: https://www.m
FREE
MSX Hybrid Heiken Scalper Overview MSX Hybrid Heiken Scalper is a MetaTrader 5 indicator based on a modified Heiken Ashi methodology with closed-bar smoothing. The indicator is designed to display trend direction through color-coded candles while reducing sensitivity to short-term market fluctuations. All calculations are performed using completed candles, allowing historical values to remain fixed after bar close. Features • Modified Heiken Ashi calculation • Closed-bar processing • Color-code
FREE
Are you tired of drawing trendlines every time you're analyzing charts? Or perhaps you would like more consistency in your technical analysis. Then this is for you. This indicator will draw trend lines automatically when dropped on a chart. How it works Works similar to standard deviation channel found on mt4 and mt5. It has 2 parameters: 1. Starting Bar 2. Number of bars for calculation The   starting bar   is the bar which drawing of the trend lines will begin, while the   number of bars for c
FREE
Free automatic Fibonacci is an indicator that automatically plots a Fibonacci retracement based on the number of bars you select on the BarsToScan setting in the indicator. The Fibonacci is automatically updated in real time as new highest and lowest values appears amongst the selected bars. You can select which level values to be displayed in the indicator settings. You can also select the color of the levels thus enabling the trader to be able to attach the indicator several times with differe
FREE
Donchian Channel is an indicator created by Richard Donchian. It is formed by taking the highest high and the lowest low of the last specified period in candles. The area between high and low is the channel for the chosen period. Its configuration is simple. It is possible to have the average between the upper and lower lines, plus you have alerts when price hits one side. If you have any questions or find any bugs, please contact me. Enjoy!
FREE
High Low Open Close
Alexandre Borela
4.98 (46)
Если вам нравится этот проект, оставьте 5-звездочный обзор. Данный показатель рисует открытые, высокие, низкие и закрывающие цены на указанные период и его можно отрегулировать для специфического часового пояса. Это важные уровни, которые выглядят многие институциональные и профессиональные трейдеры и могут быть полезны для вас, чтобы знать места, где они могут быть больше активный. Доступные периоды: Предыдущий день. Предыдущая неделя. Предыдущий месяц. Предыдущий квартал. Предыдущий год. Или
FREE
PZ Penta O MT5
PZ TRADING SLU
3.8 (5)
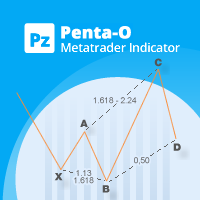
The Penta-O is a 6-point retracement harmonacci pattern which usually precedes big market movements. Penta-O patterns can expand and repaint quite a bit. To make things easier this indicator implements a twist: it waits for a donchian breakout in the right direction before signaling the trade. The end result is an otherwise repainting indicator with a very reliable trading signal. The donchian breakout period is entered as an input. [ Installation Guide | Update Guide | Troubleshooting | FAQ | A
FREE
Friend of the Trend: Ваш Трекер Трендов Освойте рынок с помощью Friend of the Trend — индикатора, который упрощает анализ трендов и помогает определить лучшие моменты для покупки, продажи или ожидания. С интуитивно понятным и визуально привлекательным дизайном, Friend of the Trend анализирует движения цен и предоставляет четкие сигналы через цветной гистограмму: Зеленые полосы : Указывают на восходящий тренд, сигнализируя о возможностях для покупки. Красные полосы : Предупреждают о нисходящем тр
FREE
Important Lines
Terence Gronowski
4.88 (24)
Индикатор отображает линии пивот, уровни максимума, минимума и закрытия предыдущего дня, а также минимум и максимум предыдущего часа. Нужно просто установить этот индикатор на график, чтобы отобразить все эти важные линии, нет необходимости настраивать множество отдельных индикаторов. Почему важны определенные линии Максимум и минимум предыдущего дня : эти уровни используются для торговли на дневном графике. Очень часто, если цена становится выше или ниже минимума/максимума предыдущего дня, про
FREE
Smart Trendline Detector Smart Trendline Detector is an automatic multi-timeframe trendline analysis indicator for MetaTrader 5 that detects and ranks rising support and falling resistance structures using market swing points. Instead of filling the chart with every possible trendline, the indicator evaluates qualifying structures and displays only a controlled number of the strongest candidates according to configurable ranking criteria. The result is a cleaner chart with relevant trendline str
FREE
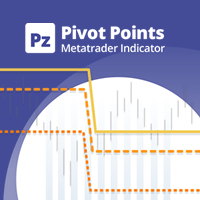
Ищете качественный индикатор точек разворота? Значит, PZ Pivot Points - это то, что вам нужно! Он строит уровни не только за текущий день. Он строит исторические уровни для проведения тестирования на истории Вы сами выбираете таймфрейм Цвета и размеры настраиваются Что такое "точки разворота"? Анализ точек разворота зачастую применяется совместно с расчетом уровней поддержки и сопротивления, как и в случае с анализом трендовых линий. При анализе точек разворота первые уровни поддержки и сопроти
FREE
Apex Point is a trend-following indicator for MetaTrader 5, transforming complex market data into signals for traders. It displays blue dots for uptrends, red dots for downtrends, and yellow crosses at potential reversals, helping users identify momentum shifts quickly. Key features include a confirmation system requiring multiple bars (default: 3) to validate changes, reducing false signals; dynamic ATR-based offsets for adaptive trailing, with instant ratcheting in the trend direction and smo
FREE
Renko subwindow
Alexandre Vincent Traber
Overview Renko SubWindow строит график Renko в виде цветных свечей в отдельном окне индикатора, не затрагивая основной график. Размер кирпича можно задать фиксированным в пунктах или рассчитывать динамически по ATR для адаптивных кирпичей на основе волатильности. How it works Реконструирует кирпичи Renko на основе цен закрытия текущего символа/таймфрейма. Новый кирпич формируется, когда цена превышает заданный размер кирпича от закрытия предыдущего. Кирпичи отображаются как цветные свечи: бычий
FREE
Зоны коррекции Фибоначчи последнего свинг-движения FibRetrace Zones: бесплатный визуальный помощник к советнику FibRetrace. Индикатор строит уровни коррекции Фибоначчи и выделяет зону отката на последнем свинг-движении, чтобы вы видели, где находятся входы на откате, ещё до сделки. Зона окрашивается по направлению: зелёная для бычьих сетапов, красная для медвежьих. Работает на любом символе и любом таймфрейме. ОСНОВНЫЕ ВОЗМОЖНОСТИ Автоматическое определение свингов с настраиваемым периодом Класс
FREE
MACD Enhanced
Nikita Berdnikov
4 (4)
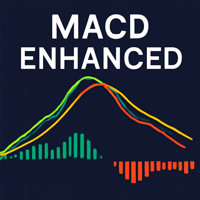
Представляем   MACD  Enhanced  – усовершенствованный индикатор MACD (Moving Average Convergence Divergence), который предоставляет трейдерам расширенные возможности для анализа тренда и момента на финансовых рынках. Индикатор использует разницу между быстрой и медленной экспоненциальными скользящими средними для определения импульса, направления и силы тренда, создавая четкие визуальные сигналы для потенциальных точек входа и выхода. Внимание!   Для достижения наилучших результатов рекомендуется
FREE
RSI back arrows
Smaylle Rafael Coelho Mariano
The   RSI Back Arrows   indicator is a powerful tool designed for traders who rely on the Relative Strength Index (RSI) to identify potential market reversals. This indicator specifically highlights when the RSI has exited the   oversold   or   overbought   zones, providing clear visual signals to inform trading decisions. Key Features: Visual Cues : The indicator marks arrows on the chart when the RSI crosses back into a neutral zone, making it easy to spot potential entry and exit points. Over
FREE
STAMINA HUD – Advanced Market & Trend Dashboard (MT5) STAMINA HUD   is a professional   market information panel   designed for traders who want   clarity, speed, and control   directly on the chart. It provides a   clean heads-up display (HUD)   with essential market data and   multi-timeframe trend direction , without cluttering the chart or generating trading signals. What STAMINA HUD Shows   Current Price   Spread (in real pips)   Today High–Low range (pips)   Average D
FREE
Trading Sessions by Mahefa R is an indicator for MetaTrader 5 that visually identifies the four main trading sessions: New York, London, Tokyo, and Sydney . Designed to provide a clean, intuitive, and professional market view, it highlights the most active periods of the Forex market using smart visualization of session ranges , session-specific candle colors , and daily separators . Main Features: Automatic detection of the 4 major sessions New York London Tokyo Sydney Each session is fully c
FREE
A volume-at-price heatmap with POC, value area, estimated buy/sell pressure, confirmed signals and alerts. POC Volume Profile Heatmap is a MetaTrader 5 indicator that organizes historical volume across price levels. It identifies the Point of Control, displays the selected value area, and estimates buying and selling pressure at the POC. The indicator is intended for traders who use volume-at-price structure to study acceptance, rejection and interaction around high-activity price levels. It c
FREE
Об индикаторе: DALA Forecast - универсальный инструмент предсказания динамики временных рядов любой природы. Для предсказания используется модифицированные методы анализа нелинейной динамики, на основе которых строится предсказательная модель с применением методов машинного обучения.  Для получения ознакомительной версии индикатора вы можете связаться со мной в личных сообщениях. Как пользоваться индикатором: Примените индикатор к выбранному вами финансовому интрументу или индикатору с нужными
FREE
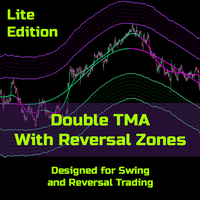
Note from Developer: This is the lite version of the Double TMA with Bands Indicator. You can find the paid version that comes with alerts and on screen signal arrows built in here . I will also be selling an EA based on this trading system soon once all backtesting and optimization have been completed. Unlock your trading potential with the Double TMA Indicator with Reversal Detection! Designed for swing and reversal trading, this versatile tool integrates two Triangular Moving Averages (
FREE
Girassol Sunflower MT5 Indicator
Saullo De Oliveira Pacheco
3.86 (7)
This is the famous Sunflower indicator for Metatrader5. This indicator marks possible tops and bottoms on price charts. The indicator identifies tops and bottoms in the asset's price history, keep in mind that the current sunflower of the last candle repaints, as it is not possible to identify a top until the market reverses and it is also not possible to identify a bottom without the market stop falling and start rising. If you are looking for a professional programmer for Metatrader5, please
FREE
Добро пожаловать в наш   паттерн ценовой волны   MT5 --(паттерн ABCD)-- Паттерн ABCD является мощным и широко используемым торговым паттерном в мире технического анализа. Это гармонический ценовой паттерн, который трейдеры используют для определения потенциальных возможностей покупки и продажи на рынке. С помощью паттерна ABCD трейдеры могут предвидеть потенциальное движение цены и принимать обоснованные решения о том, когда открывать и закрывать сделки. Версия советника:   Price Wave EA MT5
FREE
Данный информационный индикатор будет полезен тем, кто всегда хочет быть в курсе текущей ситуации на счете. VERSION MT 4 -  Больше полезных индикаторов Индикатор отображает такие данные, как прибыль в пунктах, процентах и валюте, а также спред по текущей паре и время до закрытия бара на текущем таймфрейме. Существует несколько вариантов расположения информационной строки на графике: Справа от цены (бегает за ценой); Как комментарий (в левом верхнем углу графика); В выбранном углу экрана. Так же
FREE
PROMETHEUS TECHNICAN VERSION Free | By THE SONS A gift from The Sons — no strings, no trial, no expiry. Every trader deserves access to professional-grade market intelligence. That belief is why Prometheus Technical Version exists, and why it costs nothing. Consider it our handshake to the trading community. What You're Getting This is not a simplified tool dressed up as a gift. Prometheus Technican Version is a fully built, institutional-quality technical analysis indicator running a dual-model
FREE
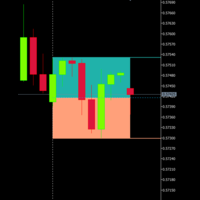
Blame The Box is a lightweight session range and breakout analysis indicator engineered specifically for MetaTrader 5. Built to support and enhance your personal trading strategy, it automatically identifies custom intraday consolidation ranges, maps out dynamic breakout levels, and displays real-time position sizing directly on your chart. Important Note: Blame The Box is an analytical and risk-calculation tool designed to assist your own technical analysis and discretionary trading strategy.
FREE
С этим продуктом покупают
Trend Sniper X
Sarvarbek Abduvoxobov
4.86 (43)
Trend Sniper X — это трендовый индикатор для MetaTrader 5, работающий на нескольких таймфреймах, который помогает трейдерам точно и ясно определять направление тренда и потенциальные точки разворота. для MT4: https://www.mql5.com/en/market/product/193245 Информация о цене: Текущая цена является промо-ценой и может измениться по мере выхода предстоящих обновлений и новых функций. Бонусное предложение: Чтобы получить БЕСПЛАТНЫЙ авто-трейд советник Assistant EA для этого индикатора, пожалуйста, на
Smart Trend Trading System — MetaTrader 5 После покупки напишите мне на MQL5, чтобы БЕСПЛАТНО получить Smart Universal Expert Advisor, а также доступ к онлайн-курсу, руководство в формате PDF и доступ к закрытой группе. STTS объединяет направление тренда, сигналы входа и выхода, зоны разворота и важные ценовые уровни прямо на графике. Торгуйте по системе вручную или подключите отдельный совместимый советник для автоматического исполнения с выбранными вами настройками. ОДНА СИСТЕМА. ЧЕТЫРЕ ТОРГОВ
Новый король в городе — Индикатор + управление ордерами (TP1 + TP2 + TP3) + опциональный Telegram-сигнал-сендер ВКЛЮЧЁН (БЕСПЛАТНО) (ПОЛНОЦЕННАЯ ТОРГОВАЯ И СИГНАЛЬНАЯ СИСТЕМА) Gold Slayer EA Этот индикатор включает в себя продвинутую стратегию, торговую систему с настраиваемым управлением ордерами и систему mean reversion, которая сочетает расширения Envelope и поддерживается несколькими интеллектуальными фильтрами подтверждения, такими как RSI, для поиска высоковероятных точек разворота с сигн
Zoryk Gold
Reda El Koutbane
4.78 (18)
Скидка заканчивается через 24 часа — следующая цена $ 69 ZORYK — продвинутая сигнальная система для XAUUSD в MetaTrader 5 Вам знакомо это чувство. Вы долго анализируете золото. Ждёте подходящего момента для входа. Наконец открываете сделку — и цена сразу начинает двигаться против вас. Вы закрываете позицию слишком рано, передвигаете Stop Loss или сомневаетесь всего несколько секунд. После этого рынок достигает именно той цели, которую вы ожидали изначально, но уже без вас. Проблема не всегда за
Получите своё торговое преимущество в поле зрения! M5 Sniper — это новый индикатор от MeanFX. Он сочетает точные торговые сигналы с адаптивными уровнями TP/SL — в результате создавая лучшие возможные статистические сделки! Цена увеличивается каждые 5 покупок, следующая цена — 69$ Напишите мне после покупки, чтобы получить советы/руководство и бонусного EA Что выделяет его среди других? Проверенная статистическая эффективность на Gold XAUUSD ( работает практически на каждом активе , с акцентом н
SuperScalp Pro
Van Minh Nguyen
4.54 (37)
SuperScalp Pro - Professional Multi-Layer Confluence Scalping System SuperScalp Pro — это продвинутый индикатор для скальпинга, который расширяет возможности классического Supertrend с помощью нескольких интеллектуальных фильтров подтверждения. Он помогает выявлять торговые возможности Buy/Sell с более высокой вероятностью успеха и значительно сокращать количество ложных сигналов. Чёткие стрелки Buy и Sell отображаются непосредственно на графике вместе с автоматически рассчитываемыми в реальном
В 2019 году я показал всему миру, на что способен этот индикатор. Я торговал по его сигналам вручную, на реальном счёте, в открытую — счёт был замониторен на Myfxbook, и я подробно освещал свой эксперимент в Facebook. Итог: 10 000 долларов за четыре месяца превратились в 941 411. Риск был сознательно экстремальным — просадка доходила до 54%, ведь в нашей профессии прибыль и риск всегда идут рука об руку. Скрин с Myfxbook — первая картинка в галерее. Похоже, вас можно поздравить: ваши поиски окон
ULTRA - это технический индикатор, который который работает по принципу “Все включено” - самостоятельно анализирует рынок, дает торговые сигналы, показывает уровни для установки стоп лосс, а также подсказывает когда нужно закрывать сделки, чтобы получить профит или минимизировать убыток. То есть, не важно, что ты не умеешь анализировать рынок, определять уровни - где поставить SL или плохо совладаешь с мани-менеджментом. ULTRA все это сделает вместо тебя! БОНУС ДЛЯ ПОКУПАТЕЛЯ : После покупки ULT
SMC Intraday Formula
VividMind Digital Solutions
5 (26)
Давайте сначала будем честны. Ни один индикатор сам по себе не сделает вас прибыльным. Если кто-то говорит вам обратное — он продаёт вам мечту. Любой индикатор, который показывает идеальные стрелки покупки/продажи, можно сделать безупречным — просто увеличьте нужный участок истории и сделайте скриншот успешных сделок. Мы так делать не будем. SMC Intraday Formula — это инструмент. Он считывает структуру рынка за вас, определяет зоны с наивысшей вероятностью движения цены и точно показывает, как
Gann Made Easy   - это профессиональная, но при этом очень простая в применении Форекс система, основанная на лучших принципах торговли по методам господина У.Д. Ганна. Индикатор дает точные BUY/SELL сигналы, включающие в себя уровни Stop Loss и Take Profit. ПОЖАЛУЙСТА, СВЯЖИТЕСЬ СО МНОЙ ПОСЛЕ ПОКУПКИ, ЧТОБЫ ПОЛУЧИТЬ ТОРГОВЫЕ ИНСТРУКЦИИ И ОТЛИЧНЫЕ ДОПОЛНИТЕЛЬНЫЕ ИНДИКАТОРЫ БЕСПЛАТНО! Вероятно вы уже не раз слышали о торговли по методам Ганна. Как правило теория Ганна отпугивает от себя не только
GoldenX Entry MT5
VividMind Digital Solutions
5 (17)
GoldenX Entry — это индикатор для MT5 с адаптивным алгоритмом Smart Entry Trend, системой оценки сигналов, детектором рыночных режимов и фильтром волатильности. Каждый сигнал включает рассчитанный уровень входа, три уровня Take-Profit (TP1, TP2, TP3) и уровень Stop-Loss. Он построен на нескольких аналитических слоях, предназначенных для адаптации к различным рыночным условиям, объединяя многоуровневую аналитическую систему со встроенным оптимизатором и системой статистического отслеживания. Инди
M1 SNIPER   — это простая в использовании торговая система. Это стрелочный индикатор, разработанный для тайм фрейма M1. Индикатор можно использовать как отдельную систему для скальпинга на тайм фрейме M1, а также как часть вашей существующей торговой системы. Хотя эта торговая система была разработана специально для торговли на M1, ее можно использовать и с другими тайм фреймами. Первоначально я разработал этот метод для торговли XAUUSD и BTCUSD. Но я считаю этот метод полезным и для торговли на
Gold Entry Sniper – Профессиональная Мульти-Таймфрейм ATR Панель для Скальпинга и Свинг-Трейдинга на Золоте Gold Entry Sniper — это передовой индикатор для MetaTrader 5, разработанный для точных сигналов на покупку/продажу по XAUUSD и другим инструментам. Основан на логике ATR Trailing Stop и мульти-таймфрейм анализе , этот инструмент идеально подходит как для скальперов, так и для среднесрочных трейдеров, обеспечивая чёткие точки входа с высокой вероятностью . Основные возможности и преимуществ
Auto Optimized SpeedAngle — это система векторизации импульса институционального уровня, которая исключает подгонку под исторические данные (curve-fitting) за счет непрерывной форвард-оптимизации (Walk-Forward Optimization, WFO). Вместо того чтобы полагаться на статические входные параметры, которые теряют эффективность при смене рыночных режимов, индикатор динамически перекалибрует свои настройки, используя валидацию на вневыборочных данных (Out-of-Sample, OOS). Это гарантирует, что отображаемы
Gold Trend Coach MT5
Cristhian Alexander Gaibor Cuasquer
5 (3)
Gold Trend Coach — трендовый индикатор по золоту (XAUUSD) для MetaTrader 5 с сигналами на покупку и продажу, стоп-лоссом и тремя целями тейк-профита, подтверждёнными на закрытии бара, мультитаймфреймовой панелью коуча и оповещениями на телефон и в Telegram. Создан для скальпинга на M5 и интрадея на M15 в лондонскую и нью-йоркскую сессии. Gold Trend Coach: трендовые сигналы по золоту XAUUSD с входом, стопом и тремя целями. Стартовая цена $39 за первые 20 копий, далее $59. Напишите мне после поку
Следующее обновление — версия 2.52 уже скоро! [НОВОЕ] Приготовьтесь к 4 новым важным функциям, призванным улучшить ваш анализ рынка и торговый процесс. Мы выводим анализ рынка на новый уровень с помощью 4 новых функций, разработанных с учётом ваших потребностей в трейдинге. Представляем: 1. TRADE OVERVIEW DASHBOARD 2. CONFLUENCE AT ZONE 3. STRONG & WEAK HIGH/LOW 4. OTE 1. TRADE OVERVIEW DASHBOARD Панель, которая помогает легче понимать общую картину рынка, предоставляя рекомендации для поддержк
Atomic Analyst — MetaTrader 5 После покупки напишите мне на MQL5, чтобы БЕСПЛАТНО получить Smart Universal Expert Advisor, а также доступ к онлайн-курсу, руководство в формате PDF и доступ к закрытой группе. Atomic Analyst объединяет анализ ценового движения, направление тренда, сигналы входа и выхода, уровни Stop Loss и несколько уровней Take Profit прямо на графике. УВИДЬТЕ СИГНАЛ. ОЦЕНИТЕ ТОРГОВУЮ СИТУАЦИЮ. Atomic Analyst представляет результаты анализа в понятном визуальном виде: • Стрелки п
Boba Analysis Suite
Trade Ready Solutions LLC
5 (2)
Boba Analysis Suite Boba Analysis Suite — аналитический индикатор для MetaTrader 5. Он объединяет структуру рынка, значимые ценовые зоны и общий рыночный контекст в одном представлении на графике. Индикатор разработан на основе практического опыта трейдера и наставника по трейдингу. Он помогает выстроить последовательный процесс анализа: оценивать направление рынка, определять важные уровни и рассматривать несколько таймфреймов в совокупности. Анализ с учётом контекста Значение отдельных сигнало
Azimuth Pro
Ottaviano De Cicco
5 (7)
Azimuth Pro V2: Синтетический фрактальный структурный анализ и подтверждённые входы для MT5 Обзор Azimuth Pro — многоуровневый индикатор свинговой структуры от Merkava Labs . Четыре вложенных уровня свингов, привязанный к свингам VWAP, определение ABC-паттернов, трёхтаймфреймная структурная фильтрация и подтверждённые входы на закрытой свече — один график, один рабочий процесс от микро-свингов до макро-циклов. Это не слепой сигнальный продукт. Это рабочий процесс, основанный на структуре, для т
Zain Gold Scalping
Ahmed Gamal Abdel Nasser Mohamed
Комплексный инструмент анализа Price Action, основанный на двух независимых алгоритмах входа (каждый из которых подтверждается границей волатильности) и дополненный набором из девяти настраиваемых фильтров, позволяющих гибко регулировать степень консервативности или агрессивности торговых сигналов. Базовая стратегия Два независимых сценария входа, каждый из которых срабатывает только при выходе цены за пределы динамической границы волатильности. Это обеспечивает два различных способа выявления
FiboSniper Pro – Multi-Filter Fibonacci System with Auto SL/TP and Control Panel FiboSniper Pro — это технический индикатор, который объединяет динамические Fibonacci Envelopes с несколькими фильтрами подтверждения для формирования отборных сигналов Buy и Sell. Уровни Fibonacci рассчитываются на основе Moving Average и ATR, а затем фильтруются с помощью ADX, EMA, RSI, ATR, Volume, Time и структуры свечи. Индикатор отображает на графике автоматические уровни Stop Loss и Take Profit на основе ATR,
Power Candles V3 — самооптимизирующийся индикатор силы Power Candles V3 преобразует силу валюты и инструмента в готовый к использованию торговый план на каждом графике, к которому он прикреплен. Вместо того, чтобы просто раскрашивать свечи, он выполняет автоматическую оптимизацию в режиме реального времени в фоновом режиме и предоставляет вам оптимальные значения Stop Loss, Take Profit и порог сигнала для выбранного вами символа. Один клик — и все готово для реальной торговли: на графике появляю
Quantum TrendPulse
Bogdan Ion Puscasu
5 (26)
Представляем   Quantum TrendPulse   , совершенный торговый инструмент, который объединяет мощь   SuperTrend   ,   RSI   и   Stochastic   в один комплексный индикатор, чтобы максимизировать ваш торговый потенциал. Разработанный для трейдеров, которые ищут точность и эффективность, этот индикатор помогает вам уверенно определять рыночные тренды, сдвиги импульса и оптимальные точки входа и выхода. Основные характеристики: Интеграция SuperTrend:   легко следуйте преобладающим рыночным тенденциям и п
Индикатор Tokyo Indicator обеспечивает наглядное представление о направлении тренда, потенциальных торговых сигналах и текущей рыночной ситуации. Его ступенчатая линия тренда с цветовой индикацией позволяет различать «бычьи» фазы (выделены синим цветом) и «медвежьи» фазы (выделены пурпурным цветом). Соответствующие стрелки указывают на возможные точки входа в рынок (покупку или продажу) при смене тренда. Встроенная информационная панель объединяет данные о текущем сигнале, рыночном настроении,
Adaptive Price Action Engine Купи индикатор — получи советник (EA) к нему бесплатно Самооптимизирующийся мульти-таймфреймовый анализ тренда и свечных моделей Рынок постоянно меняется — и не каждая модель Price Action имеет одинаковую ценность в разных рыночных режимах. Adaptive Price Action Engine создан для адаптации к изменяющимся рыночным условиям, объединяя трендовую структуру, мульти-таймфреймовый анализ, свечные модели и статистическую оптимизацию в единой аналитической системе. Два адапти
Superhero
Ihor Otkydach
5 (3)
SUPERHERO индикатор - это мультивалютная торговая система, которая создана по принципу "Все включено". Индикатор самостоятельно анализирует рынок и дает сигналы когда открывать и когда закрывать сделки. Используются ордера Стоп Лосс и Тейк профит. Соотношение R:R = 1:1 Эта система может присылать на смартфон PUSH-уведомления, так что вы сможете делать сделки "на ходу" без привязки к ПК. Отлично подходит для Проп Фирм трейдинга. БОНУС ДЛЯ КАЖДОГО ПОКУПАТЕЛЯ: Каждый покупатель этого индикатора пол
Trend Catcher   анализирует движения рыночных цен, используя комбинацию собственных и индивидуально разработанных адаптивных индикаторов анализа тренда. Он определяет истинное направление рынка, отфильтровывая краткосрочные шумы и фокусируясь на силе импульса, расширении волатильности и поведении ценовой структуры. Он также использует комбинацию сглаживающих и фильтрующих тренд индикаторов, таких как скользящие средние, RSI и фильтры волатильности. Мониторинг реальных операций, а также другие
Мультивалютный индикатор силы и импульса MT5 Dynamic Forex28 Navigator — это развитие наших давних популярных индикаторов, объединяющее силу трёх в одном: Advanced Currency Strength28 Indicator (700 отзывов) Advanced Currency IMPULSE with ALERT (530 отзывов) CS28 Combo Signals (недавний бонус) Оба индикатора-предшественника вместе получили более 1,200 отзывов на MQL5 Market и с 2016 года являются неотъемлемой частью сообщества MT4. Dynamic Forex28 Navigator MT5 переносит ту же проверенную логику
Apex Patterns PRO Купите индикатор — получите Expert Advisor на его основе БЕСПЛАТНО. Самооптимизирующаяся система анализа графических паттернов и пробоев Традиционные сканеры паттернов полагаются на фиксированные входные параметры, что часто приводит к снижению их эффективности при изменении рыночной волатильности и структуры. Apex Patterns PRO разработан для адаптации к меняющимся рыночным условиям, объединяя распознавание структурных графических паттернов, фильтрацию по моментуму и статистич
Crystal Heikin Ashi Signals—Professional Trend & Signal Detection Indicator Advanced Heikin Ashi Visualization with Intelligent Signal System for Manual & Automated Trading Final Price: $149 ---------> Price goes up $10 after every 10 sales . Limited slots available — act fast . Overview User Guide PDF Crystal Heikin Ashi Signals is a professional-grade MetaTrader 5 indicator that combines pure Heikin Ashi candle visualization with an advanced momentum-shift detection system. Designed for both m
Другие продукты этого автора
If you like this product, please give it a  5 star rating as a token of appreciation. This CRT indicator draws the premium and discount zones of a single candle from any timeframe on your chart. You choose which candle (current or previous) using CandleOffset, and the indicator automatically retrieves that candle’s high, low, and midpoint which is the same as CANDLE RANGE THEORY (CANDLE RANGE THEORY). It then visually displays: Premium Zone (Upper 50%) A shaded rectangle from the candle’s midp
FREE
This indicator   is a sophisticated MetaTrader 5 tool that calculates and displays Average Daily Range (ADR) levels on your chart. It draws horizontal lines representing expected price movement ranges based on historical daily volatility, helping traders identify potential daily high and low targets. ADR (Average Daily Range)   = The average difference between the daily high and low over a specified period (default: 14 days). Unlike ATR which includes gaps between days, ADR focuses purely on int
FREE
If you like this product, please give it a  5 star rating as a token of appreciation. Inside Bar: A candle that is completely contained within the high-low range of the previous candle Outside Bar: A candle that completely engulfs the high-low range of the previous candle (also called an "Engulfing Bar") Inside Bars Consolidation Signals : Indicates market indecision/compression Breakout Setup : Often precedes significant price moves Continuation Patterns : Can signal pause in trend before con
FREE
If you like this product, please give it a  5 star rating as a token of appreciation. This indicator plots horizontal trend lines at the opening price of each quarter (Q1–Q4) on the chart. These lines visually represent quarterly open levels of the current year, which traders often use as support/resistance or reference points. Automatically plots Q1–Q4 opening levels as trend lines on the chart. Lines are dashed, colored, and labeled. Handles both current and historical quarters. Cleans up line
FREE
Th is i ndicator   is a versatile MetaTrader 5 tool that calculates and displays Average True Range (ATR) levels on your chart. It draws horizontal lines representing price levels based on ATR multiples from the daily opening price, helping traders identify potential support and resistance zones. 1.   Multiple ATR Levels ATR1 : Standard ATR level (default: 1x ATR) ATR2 : Intermediate level (default: 2x ATR) ATR3 : Extreme level (default: 3x ATR) Each level displays both upper (High) and lower (L
FREE
If you like this product, please give it a  5 star rating as a token of appreciation. This indicator projects Higher-Timeframe (HTF) candles onto the current chart and optionally shows their OHLC lines and Fair Value Gaps (FVGs) using ICT 3-candle logic. Projects multiple higher timeframe candles. Accurately preserves HTF OHLC on any lower timeframe. Allows spacing adjustment between projected candles. Optionally displays OHLC horizontal reference lines. Automatically detects and draws HTF Fair
FREE
If you like this product, please give it a  5 star rating as a token of appreciation. This indicator calculates and draws pivot points and support/resistance levels for both daily and weekly timeframes: Pivot (central) level Support levels S1, S2, S3 Resistance levels R1, R2, R3 It allows showing daily, weekly, or both sets of pivots , giving traders visual references for potential support/resistance areas. Pivot mode: Choose which pivots to display (weekly, daily, or both). Colors and style: C
FREE
If you like this product, please give it a  5 star rating as a token of appreciation. This indicator identifies and displays Fair Value Gaps (FVG) on price charts. Fair Value Gaps are price zones where there's a significant imbalance between buying and selling pressure, creating "gaps" in price action. The indicator detects two types and when they are mitigated(touched): Bullish FVG: When a candle's low is above the high of a candle two periods earlier. Bearish FVG: When a candle's high is bel
FREE
If you like this product, please give it a  5 star rating as a token of appreciation. This indicator draws vertical lines marking key Forex trading sessions (Asian, London, New York) for a configurable number of past days. These “Silver Bullet” lines help traders quickly visualize session start and end times on the chart. DaysToDisplay: How many previous days’ session lines to show. Session colors: Customizable line colors for each session. Session start hours: Local server hours for each sessi
FREE
If you like this product, please give it a  5 star rating as a token of appreciation. This indicator plots horizontal lines on the chart representing the previous year’s high and low prices . These levels are widely used in technical analysis as major support/resistance references. Automatically identifies the previous calendar year’s high and low . Plots horizontal lines on the chart at these levels. Customizable color, width, and style of the lines. Deletes lines on deinitialization. Updates
FREE
The indicator reads MT5’s built-in economic calendar and organizes events into three horizontal lanes : High-impact events (red) Medium-impact events (orange) Low-impact events (gray) (optional) Each lane scrolls horizontally across the chart like a ticker. You can choose whether to show: Today’s events only Or all events for the current week This is a complete fundamental dashboard for MT5. It gives you: Real-time scrolling economic events Interpreted color-coded results Day/Week filterin
This is an extremely clean, efficient, and well-designed CBDR engine. Calculates ICT’s Central Bank Dealers Range (CBDR) Using only candle bodies — NOT wicks (open–close structure). For a defined time window (e.g., 00:00–05:00 New York). For each past day and also for today in real time. Draws the following on chart: A rectangle showing the entire CBDR body range The CBDR High line (body top) The CBDR Low line (body bottom) An optional midline A pip label showing total CBDR size Optional extens
This MetaTrader 5 indicator plots ICT Killzone session markers on the chart using vertical lines . It draws the start and end times for three institutional trading sessions— Asian , London , and New York —for a user-defined number of recent historical days. No buffers or plots are used; instead, the indicator relies entirely on chart objects (OBJ_VLINE) . 1. Inputs and Parameters The indicator allows full customization of each killzone segment: General DaysToDisplay : number of past days to dra
This MT5 (CRT) indicator displays   key price zones   from different timeframes on your current chart, helping you visualize where price might find support or resistance based on higher timeframe structure using CANDLE RANGE THEORY. The indicator draws   three price zones   from selected historical candles: Premium Zone : Upper 50% of a historical candle's range Discount Zone : Lower 50% of a historical candle's range Midline : Exactly halfway between high and low Each zone represents an area w
Aklamavo Market Sessions Monitor-EA (Expert Advisor) is a   Global Stock Exchange Market Hours Dashboard   for MetaTrader 5. It provides a comprehensive visual display of the opening status and trading hours of 7 major stock exchanges around the world. The EA creates a real-time dashboard that shows whether each stock exchange is currently: OPEN   (Green background) CLOSED   (Red background) PRE-MARKET   (Light Green background) POST-MARKET   (Light Pink background) Unique Features: Progress Ind
This EA is an   RSI Crossover Trading System   with advanced position management features . This is not one of those EAs with fake/manipulated test results out there. RSI Crossover Advanced Robot  is robust and  suitable for traders who want automated RSI-based trading with professional-grade position management. It's particularly useful in trending markets where RSI signals can provide reliable entry and exit points. Recommended settings tested with 1HR timeframe using ICMarkets Tickers on 1 y
This is a   Cumulative Volume Delta (CVD) Indicator   for MetaTrader 5 that visualizes order flow imbalance between buying and selling pressure . The indicator calculates and displays the   cumulative difference between buying (Bid) and selling (Ask) volumes   over time, providing insights into whether buyers or sellers are controlling the market. 1. Visual Displays: Cumulative Delta Line   (Blue): Running total of volume delta across multiple bars Positive Bar Delta Histogram   (Green): Individ
This is a   Market Depth (DOM - Depth of Market) Indicator   for MetaTrader 5 that displays real-time order book data in a visual ladder format. The DOM provides a comprehensive view of market depth with clear visual cues for volume imbalances, making it useful for both scalping and swing trading decisions This indicator provides traders with a professional-grade market depth visualization that can be customized to match individual trading preferences and strategies.  You can easily switch betwe
This Volume Delta Profile is an advanced MetaTrader 5 indicator that visualizes   volume delta (order flow imbalance)   using a volume profile-style histogram. It shows the difference between buying and selling pressure at specific price levels, helping traders identify supply and demand zones. This indicator provides a unique perspective on market dynamics by visualizing the imbalance between buying and selling pressure, offering insights beyond traditional volume analysis. Core Concept Positiv
This Volume Footprint indicator is essentially a   professional-grade market profile tool   that provides deep insight into market microstructure, showing exactly where trading activity is occurring and who's in control (buyers or sellers) at each price level. Key Features 1.   Footprint Display Divides each bar into multiple price levels (configurable via   PriceLevelsPerBar ) Shows   BID volume   (selling pressure) on the left side of each level Shows   ASK volume   (buying pressure) on the r
Фильтр:
Нет отзывов
Ответ на отзыв