 MetaTrader 5
 Эксперты
 Индикаторы
 Библиотеки
 Утилиты
 Виджеты
 Правила
Смотри обучающее видео по маркету на YouTube
Как купить торгового робота или индикатор
Запусти робота на
виртуальном хостинге
виртуальном хостинге
Протестируй индикатор/робота перед покупкой
Хочешь зарабатывать в Маркете?
Как подать продукт, чтобы его покупали
Новые технические индикаторы для MetaTrader 5 - 106
 На основании сигналов технических индикаторов принимаются решения относительно открытия или закрытия сделки на фондовом и форекс-рынках. Суть индикаторов заключается в математическом преобразовании цены и/или объемов финансового инструмента для прогнозирования изменений цен в будущем.
Протестируйте технические индикаторы, чтобы лучше предсказывать поведение рынка и зарабатывать на этом.

AlgoMatrix EMA Ribbon Trend Pro (MT5) Профессиональный индикатор EMA Ribbon для MetaTrader 5
Обзор — Для трейдеров, которые следуют за трендом
AlgoMatrix EMA Ribbon Trend Pro — это профессиональный индикатор тренда на основе EMA Ribbon для MetaTrader 5, разработанный для трейдеров, которым важны чёткое подтверждение тренда, дисциплинированные входы и стабильные сигналы без перерисовки.
Индикатор помогает торговать только в направлении реального тренда, избегая бокового рынка и хаотичных движе

EXTREME POI Indicator Join the telegram community for an exciting trading journey. https://t.me/automated_TLabs Professional Trading Indicator for MetaTrader 5/Metatrader 4
EXTREME POI is an advanced institutional-grade trading indicator designed to identify high-probability Points of Interest (POI) based on Smart Money Concepts. The indicator combines multiple sophisticated techniques to detect areas where institutional traders are likely to enter the market.
Working Pairs GOLD, EURUSD,
FREE

Полосы Mogalef — Динамическая структура диапазона и целевые зоны (MT5) Полосы Mogalef — это визуальный индикатор рыночной структуры, который рассматривает рынок как динамический диапазон , смещающийся поэтапно. Вместо отдельных “сигналов” он дает контекстные уровни, чтобы: понимать, где цена сейчас “работает” (рабочая зона), находить потенциальные зоны продолжения/расширения (цели), и фильтровать шум за счет устойчивого, неимпульсивного обновления (с инерцией). Индикатор рассчитан на дискрецио

The Trading Sessions Dashboard is a powerful and user-friendly MT5 indicator designed to provide traders with real-time insights into the major forex trading sessions. It displays the status of each session (Active or Closed) along with the remaining time until closure or the next opening, helping you align your trading strategy with market hours. Built for clarity and professionalism, this indicator is perfect for beginners and experienced traders alike, ensuring you never miss key session tran

Market Info Pro: Ваш Идеальный Дашборд для Трейдинга на MT5 Поднимите свой опыт трейдинга на Forex с Market Info Pro — продвинутым индикатором, который предоставляет всю необходимую информацию о рынке одним взглядом на вашем графике MT5. Ключевые Функции: Отображение в реальном времени спреда, аска, бида, текущей сессии, времени до закрытия свечи и многое другое. Расширенная информация: баланс, эквити, свободная маржа, используемая маржа, леверидж, открытые сделки, прибыль/убыток, своп, комиссия

https://youtu.be/WFQaaQ4EJWQ ENG VERS.
Volume Profile Ultimate v1.17 – คุณสมบัติล่าสุด (Latest Features) ภาษาไทย (Thai) หมวดหมู่ คุณสมบัติ ป้องกันกราฟค้าง ตรวจจับกราฟนิ่ง (Tick ไม่เคลื่อนที่) และการคำนวณค้างอัตโนมัติ กู้คืนอัตโนมัติ เมื่อตรวจพบการค้าง ระบบจะล้างออบเจ็กต์ รีเซ็ตการคำนวณ และสร้างใหม่เอง ️ จำกัดความถี่การอัปเดต การตรวจจับโซนจะทำทุก 10–30 วินาที (ไม่ใช่ทุกครั้งที่แท่งเคลื่อน) ลดภาระ CPU จัดการออบเจ็กต์อย่างมีประสิทธิภาพ สร้างและลบ Fibo / Circle / Zone เฉพาะที่จำเป็น,

Here our more valuable tools
SMC Trend Trading , Easy SMC Trading , Institutional SMC Architect Volume Analysis Tools , Volume flow Profile , Market volume profile , FVG with Volume , Liquidity Heatmap Profile , Volume Spread Analysis 1. Institutional Supply & Demand Zones Auto-Detection: Automatically draws zones at valid pivot points. Smart Extension: Zones extend into the future for easy visibility but automatically cut off when price breaks them. Mitigation Logic: When

"We have developed a highly accurate trading signal system applicable to all assets on the 15-minute (M15) timeframe. Calibrated against actual Gold price behavior, this system allows users to trade every candlestick effectively, regardless of market conditions—whether the market is trending, moving sideways, or reversing. The system features real-time arrows and color-coded indicators that signal immediate Buy or Sell entry points. This allows traders to use it as a reliable confirmation tool t
FREE

N/B: All our product purchase comes with our free ‘’DAILY SCALPER EA’’ - bit.ly/4qlFLNh Whatsapp Developer for yours after successful purchase
UNLOCK THE 4-CANDLE SECRET: Trade Like a PRO with "Inside Bar Dominator"
ATTENTION ALL TRADERS!
Are you tired of:
· Losing trades from false breakouts? · Missing entries because you're stuck analyzing charts? · Complex indicators that give conflicting signals? · Struggling to find clear stop loss and take profit levels?
What if I told you th
+++++++++++++++++++++++++++++++++++++++++++++++++++++++++++++++++++++++++++++++++++++++++++++++++++++++ +++ Link to EURUSD Only Free Version --> https://www.mql5.com/en/market/product/156904 +++ Full License --> https://www.mql5.com/en/market/product/156842 +++++++++++++++++++++++++++++++++++++++++++++++++++++++++++++++++++++++++++++++++++++++++++++++++++++++ +++ XMAS SALE
+++ Get this indicator for free when renting the Forecast System Full License (one license for one account)
+++ Please

IQ Trade Status – A Professional Trade Panel to track all your LIVE TRADES in a single dashboard. IQ Trade Status is not just a trade panel; it is a professional dashboard designed for MetaTrader. It replaces the default Terminal window with a clean, structured, and actionable overview of your account and open trades.
The dashboard is designed to help you instantly answer three critical questions: How much have I made today? How much will I lose if all my trades go wrong? Is my account over-lev

Volume Profile Trading System is NOT just another volume indicator. It's a complete trading ecosystem that combines professional volume profile visualization with an intelligent automated trading strategy. While other indicators show you WHERE volume is concentrated, Volume Profile Trading System shows you WHERE , WHEN , and HOW to trade it! displaying real volume distribution by price instead of time. It helps traders identify fair value zones, institutional activity, and high

ZIVA TrendX is a professional trend-oriented indicator engineered to provide a clear and structured assessment of market direction through a cloud-based analytical framework. The indicator analyzes price behavior relative to dynamically derived trend boundaries, forming a continuous cloud structure that visually represents the prevailing market bias. This structure enables traders to maintain alignment with dominant directional conditions while filtering short-term market noise. All internal ca

swing trading logic and professional MQL5 development at first glance. The candlestick chart in the center represents real market structure, showing both bearish (red) and bullish (green) movements. This highlights the indicator’s ability to capture medium-term price swings , not just short scalps. The transition from red candles on the left to green candles on the right visually communicates trend reversal and continuation , which is the core of swing trading. The curved arrows play an importa
FREE
Pairs Synthetic Pro (Synthetic Pairs & Spread) Master Correlation Trading Correlation trading and statistical arbitrage are now within your reach thanks to the Pairs Synthetic Pro indicator. This tool goes beyond simple ratio analysis, acting as a specialized radar for detecting price imbalances between two assets to anticipate market corrections. For example, when Brent rises while WTI lags, the price spread widens. Our indicator, integrated with adaptive Bollinger Bands, identifies when this d

About:
The Nadaraya-Watson Envelope is a sophisticated yet practical technical indicator that helps traders identify overbought and oversold conditions using advanced kernel regression methods. This is the MT5 only Version.
For MT4 Version go here: https://www.mql5.com/en/market/product/158640/
Key Features ATR-Based Bands: Three upper and three lower bands provide graduated overbought/oversold zones Logarithmic Scale Calculation Center Line - bullish (teal) or bearish (red)
What is the Nad
FREE

StrikeZone Macd Atr is an advanced volatility-adaptive oscillator that scales the traditional MACD using ATR.
This approach solves the common problem of conventional MACD: it does not react properly to changing volatility.
With ATR scaling, momentum becomes clearer, smoother, and more meaningful across all market conditions. Key Features 1. ATR-Scaled MACD Oscillator The indicator adjusts (MACD – Signal) by ATR ratio, allowing: Reduced noise during high-volatility periods Enhanced sensitivity du
FREE
Hi Traders, THV MTF Candle Range with Fibo is a powerful MT5 indicator designed to help traders clearly identify key price levels, higher-timeframe structure, and high-probability reaction zones directly on the chart without switching time frames. Key Features:
Options to select the number of HTF candles to display on your lower-timeframe chart Displays High / Low / Mid / Fibonacci levels of higher-timeframe (HTF) candle ranges Option to display Fibonacci levels for all HTF candles or only the
Описание работы Индикатор MA7 Lavender основан на стандартном индикаторе Stochastic Oscillator. Показывает пересечение главной и сигнальной линий в зонах перекупленности и перепроданности. Подробная информация о индикаторе MA7 Lavender .
Настройки индикатора General settings В данной группе располагаются настройки индикатора Stochastic Oscillator.
Message settings В данной группе располагаются настройки уведомлений при появлении стрелок.
Arrow display settings В данной группе располагаются на
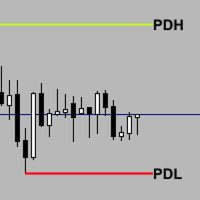
Previous_Highs_Lows-Socarix-STS Previous_Highs_Lows-Socarix-STS automatically plots the previous day, week and month highs and lows (PDH/PDL, PWH/PWL, PMH/PML), extending these levels forward in time and labeling them clearly.
It highlights confluences when several levels share the same price and can mark crossed levels with an “X”, with optional fading. Weekly and monthly levels use smart logic: levels that were already crossed earlier in the current week/month are hidden for today. Fully custo
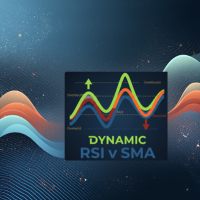
Clr-Dynamic RSI v SMA Indicator : A Comprehensive Analysis of Features and Advantages
The Clr-Dynamic RSI v SMA indicator represents a significant evolutionary leap in technical analysis tools, transforming the classic Relative Strength Index (RSI) from a potentially ambiguous oscillator into a sophisticated, multi-dimensional trading system. At its core, this indicator retains the mathematical foundation of the RSI, measuring the speed and change of price movements, but radically enhances its
Hi Traders, The THV EMA Distance Monitor is a lightweight and flexible MT5 indicator designed to display the real-time distance between price and multiple Exponential Moving Averages (EMA) directly on the chart. The indicator allows traders to enable or disable up to five EMAs, each with a customizable period, making it adaptable to different trading strategies and market conditions. For each selected EMA, the distance from the current price is calculated and displayed in a clear on-chart panel.
FREE

Professional Multi-Timeframe Technical Analysis Tool Transform Your Technical Analysis with 4 Powerful Tools in One Advanced Fractal ZigZag Pro is a powerful 4-in-1 technical analysis indicator that combines Fractal Detection, N-Wave Analysis, ZigZag Patterns, and Divergence Detection with an intelligent real-time information panel. 4 powerful analysis tools in one indicator 36 customizable alert combinations Drag-and-drop movable information panel Multi-timeframe support (15min, 1H, 4H)

Buy Sell Arrow Swing MT5 – Market Structure Swing Indicator Buy Sell Arrow Swing MT5 is a technical indicator designed to identify market swing points and structural turning areas. It helps traders visualize price structure and potential trend direction changes in real time. The indicator analyzes price action to detect key market structure points and displays signals directly on the chart using arrows. Core Functionality The indicator identifies and marks the following market structure elements
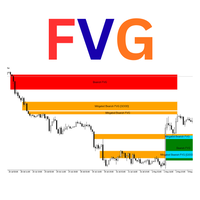
Luta FVG Pro – Professional Fair Value Gap (FVG) Indicator
Detects Institutional Fair Value Gaps on H4 timeframe with the same way used by ICT/SMC traders.
Features: • Real-time Bullish & Bearish FVG detection • Automatic Mitigation tracking • Inverted FVG signals (very powerful reversal setups) • "GOOD" FVG marking (gaps ≥ 2× minimum size – higher probability) • Clean rectangles with smart labels (Bullish FVG / Mitigated / Inverted) • Overlap filter option • Maximum 50 active zones (no chart
FREE

USD STRENGHT VERSUS MARKET USD (DXY) Versus Market Panel is a professional visual indicator designed to analyze US Dollar strength and pressure against major trading symbols in real time. The indicator compares USD performance (based on DXY logic or internal strength calculation) versus selected symbols, allowing traders to quickly identify dominant currency flow, relative strength, and market bias from a single panel view. Built with a clean, lightweight, and non-intrusive panel , this tool hel
FREE

TCM Breakeven Calculator Ultra is a professional utility designed to instantly visualize your True Weighted Average Entry Price with the Total Lot Size . Unlike simple averages, this tool mathematically accounts for Lot Sizes , giving you the exact price where your net position reaches zero loss. It automatically scans your terminal and isolates trades based on the chart you are viewing. If you are trading multiple pairs (e.g., EURUSD and Gold) simultaneously, this indicator will onl
FREE
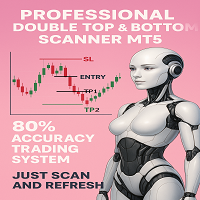
N/B: All our product purchase comes with our free ‘’DAILY SCALPER EA’’ - bit.ly/4qlFLNh Whatsapp Developer for yours after successful purchase
PROFESSIONAL DOUBLE TOP/BOTTOM PATTERN SCANNER
The Ultimate Reversal Trading System for Forex & Crypto Traders
TRANSFORM YOUR TRADING WITH INSTANT PATTERN RECOGNITION
Are you tired of missing profitable reversal setups? Exhausted from staring at charts for hours, trying to spot double tops and bottoms? Frustrated with false breakouts and misse

QuantFusion BTC Pro is a professional-grade, multi-dimensional trading indicator optimized for Bitcoin/USD markets. By integrating advanced technical analysis, smart money concepts, and intelligent signal filtering, the indicator is designed to deliver high-probability trading signals. Its Multi-Category Alignment System requires confirmation from independent technical categories to validate entries and minimize false signals. Advanced Signal Generation System Dual-Level Quality: Generates stan
Hi Traders, The Volume Spike Alert Indicator is a lightweight, non-lagging tool designed to help traders identify unusual volume activity in real time. This indicator calculates the average tick volume over a user-defined number of previous bars and compares it with the current candle’s volume. When the current volume exceeds the average by a specified percentage, the indicator triggers alerts, allowing traders to quickly spot potential breakouts, institutional activity, or strong market interes
FREE

Want to AUTOMATE this strategy? We have released the fully automated Expert Advisor based on this logic. Check out Range Vector Fibo Logic EA here: https://www.mql5.com/en/market/product/158065
UPGRADE AVAILABLE: Tired of manual trading? I just released the Automated MTF Version with Mobile Alerts and Auto-Targets. Get the Pro Version here: https://www.mql5.com/en/market/product/159350 Range Vector Fibo Logic (Indicator) One Candle Strategy Stop waking up at 3 AM to draw lines manually. Range
FREE

Description (English): Trend Test by Subho – Advanced Trend & Step Channel System Trend Test by Subho is a powerful all-in-one trend trading system designed to filter noise and provide clear market direction. This indicator combines two sophisticated algorithms: the Trend Test () and the Subho Step Channel into a single chart overlay. It also features a stylish Live Dashboard that alerts you to the current trend status in real-time. Key Features: Trend Test () Logic: An advanced tr
FREE

Candle color RSI (Relative Strength Index) indicators change candlestick colors on the price chart to visually show RSI conditions like overbought/oversold levels or bullish/bearish momentum, using colors like red for overbought/bearish and green for oversold/bullish, helping traders spot reversals or strength at a glance without looking at the separate RSI pane. These custom indicators often color candles red above 70 (overbought), green below 30 (oversold), and keep default colors in between
FREE

Description Overview : Session Sentinel Pro is a lightweight, chart-based indicator that watches your account equity live and presents a clear view of daily trading performance. It provides closed and floating P&L, session and per-day maximum drawdown, symbol-level breakdowns, and automatically persists daily summaries to the MT5 Files folder so you can review recent performance across days.
Why it helps : The indicator helps traders stay disciplined by clearly showing intraday performance, max
FREE

Supply and demand in trading describes how buyer (demand) and seller (supply) actions set asset prices, with high demand/low supply raising prices (premium) and low demand/high supply lowering them (discount); traders identify these imbalances as "zones" on charts (e.g., Rally-Base-Rally for demand, Drop-Base-Drop for supply) to find potential entry/exit points, aiming to buy at discount demand zones and sell at premium supply zones, using volume and price action to confirm institutional acti
FREE
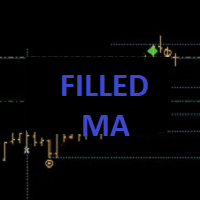
++++++++++++++++++++++++++++++++++ +++ Trend Tool ++++++++++++++++++++++++++++++++++ Hallo Trader, This is a trend tool that I use... based on four moving averages. Price below or above the EMA200 is indication for the long term trend. Also the direction of the slope counts. You can customise in settings if you want. The tool is aligned with my Forecast System and the Bounce Zones. - Forecast System --> https://www.mql5.com/en/market/product/156904 - Bounce Zones --> https://www.mql5.com/en/mar
FREE

A custom indicator that displays a real-time countdown showing how much time remains before the current candle closes and the next one opens. Equipped with a 10-second audio countdown , providing a visual–auditory reminder so traders don’t miss critical moments before a candle closes and can execute decisions with precision. Highly useful for traders who rely on precise timing whether for entries, exits, or analyzing momentum that forms exactly at candle open and close.
FREE

Edri Extreme Points Buy & Sell A reversal-based entry indicator designed to identify high-probability turning points in the market. How to Use Green arrow (Buy signal): Appears below the candle when conditions favour a potential bullish reversal. Consider entering long positions. Red arrow (Sell signal): Appears above the candle when conditions favour a potential bearish reversal. Consider entering short positions. Optional Mean Reversion Bands Enable this feature in the settings to display dyna

MM Ultimate Pro Analyzer v10.0 - USER GUIDEBASIC USAGEStep 1: Add to Chart Open any chart in MetaTrader 5 Go to Navigator → Indicators Find MM Ultimate Pro Analyzer Drag it onto your chart A settings window will appear Step 2: Configure for Your Timeframe Choose settings based on what you trade: Timeframe NumberOfCandles VolumeAveragePeriod M1-M5 (Scalping) 10-20 50 M15-M30 (Day Trading) 5-10 30 H1-H4 (Swing Trading) 3-7 20 D1+ (Position Trading) 3-5 14 Step 3: Understand the Button Bar At the t
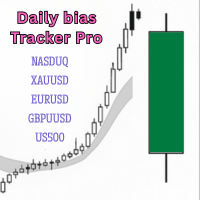
This indicator helps traders easily understand potential market direction. It combines the Average True Range (ATR) and Volume-Weighted Moving Average (VWMA) to measure market volatility and create a dynamic cloud.
Bullish Bias Rules: A bullish momentum phase begins when a candle closes above the upper cloud. You can expect the bias to remain bullish until a candle closes below the lower cloud. Note: The bullish trend remains active even if the price (candle) moves between the two clouds. Onc

This indicator is a hybrid SMC + Trend + Oscillator tool that draws market-structure objects on the chart and also plots trend shift lines + arrows and a colored oscillator histogram.
It includes these modules:
Phantom Shift (ATR trend shift / trailing bands)
Swing Structure (BOS/CHoCH + swing points)
Internal Structure (iBOS/iCHoCH)
Order Blocks (swing + internal)
Equal Highs / Equal Lows (EQH / EQL)
Fair Value Gaps (FVG)
Premium / Discount zones (range zones)
Phantom Oscillator (MA
Master Smart Money Concepts with Precision. The FVG Pro with Fibonacci Zones is a sophisticated Price Action tool designed for MetaTrader 5. It automates the identification of Fair Value Gaps (Imbalances) and simultaneously projects key Fibonacci retracement levels within those gaps. In Smart Money trading, a Fair Value Gap (FVG) often acts as a magnet for price. However, knowing where inside the gap price will reverse is the challenge. This indicator solves that by automatically plottin
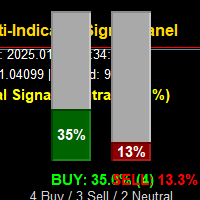
Overview The Multi-Indicator Signal Panel is a comprehensive technical analysis tool for MetaTrader 5 that combines signals from 9 different technical indicators into a single, easy-to-read visual interface. Instead of cluttering your chart with multiple indicators, this tool analyzes them all and presents the combined results through intuitive vertical bar graphs and clear recommendations.
Visual Interface: Two Vertical Bar Graphs (Green = Buy, Red = Sell) Real-time signal str
HTF Liquidity Sweeps Dashboard Pro
Tagline: See the Big Picture. Trade the Sweep. Never Switch Timeframes Again. Overview:
Stop losing focus by constantly switching between timeframes. The HTF Liquidity Sweeps Dashboard projects Higher Timeframe (H1, H4, Daily) candles directly onto your current chart's empty space. Designed for ICT, SMC, and Price Action traders, this tool allows you to monitor macro-trends and liquidity sweeps while executing on lower timeframes with laser precision. W

VSA Pulse System
Stop trading shapes. Start trading Energy. The advanced VSA + Price Action logic engine. Recommended Experience Level: Intermediate to Advanced Description:
Most indicators show you history (lag). The VSA Pulse System shows you reality (physics). This indicator decodes the "Energy" behind every candle. It moves beyond simple "Bullish" or "Bearish" labels and identifies the intent of the Smart Money. It answers the three most critical questions in trading: Is this move r

Title: HTF Candle Insight - See the Big Picture on One Chart Introduction: Stop switching tabs constantly! HTF Candle Insight allows you to visualize Higher Timeframe price action directly on your current trading chart. Whether you are a Scalper, Day Trader, or Swing Trader, seeing the "Big Picture" candle structure is crucial for identifying trends, reversals, and key levels (Support/Resistance). Key Features: Dual HTF Overlay: Display up to 2 different Higher Timeframes simultaneously (e.g.,

Every Trader trades in a market zone. If you are not living in the time zone you are trading, you need a clock to show you what time it is in your favorite time zone, and it should be small at the same time to not interrupt your trading process. In this small indicator, you have access to 3 major clocks around the world, and you can easily look at them. We have some other products that I am sure will help you with your trading career. Please have a look at the link: LINK our all-in-one trading

Overview Liquidity Indicator is a market analysis tool designed to help traders identify potential market reaction zones based on liquidity behavior and price action. Instead of using traditional moving averages, this indicator analyzes liquidity flow and pivot structures to highlight areas where price may react. This indicator is intended to support technical analysis and decision-making, not to predict or guarantee market outcomes.

N/B: All our product purchase comes with our free ‘’DAILY SCALPER EA’’ - bit.ly/4qlFLNh Whatsapp Developer for yours after successful purchase
PIN BAR POWER REVERSAL SCANNER MT5
UNLOCK THE SECRET OF INSTITUTIONAL TRADING WITHOUT THE HEDGE FUND BUDGET
What If I Told You There's a Way to Spot Reversals BEFORE They Happen?
Professional traders know: Pin bars at key levels are where fortunes are made. The institutions use them. The smart money follows them. And now, YOU can trade them w

Unlock the power of Smart Money Concepts (SMC) with the cleanest FVG indicator on the market. Smart FVG Pro is not just another gap detector. It is designed for professional traders who need to filter out noise and focus on high-probability reversal zones. Unlike standard indicators that clutter your chart with every minor gap, Smart FVG Pro uses advanced filtering logic (Trend + Volatility) and a unique "Smart Mitigation" system to automatically remove invalidated zones, keeping your chart clea

N/B: All our product purchase comes with our free ‘’DAILY SCALPER EA’’ - bit.ly/4qlFLNh Whatsapp Developer for yours after successful purchase
REVERSAL ENTRY PRO INDICATOR
The Smart Money's Secret Weapon for Pinpointing Extreme Reversal Zones
INTRODUCTION: THE TRADER'S DILEMMA
Every trader knows the frustration: You see a market reaching extremes, but when do you enter? How do you distinguish between a minor pullback and a major trend reversal? Where do you place your stop loss that'

Ultimate SMC: Professional Smart Money Concepts Indicator Unlock the hidden movements of the market. Trade with the institutions, not against them. The Ultimate SMC indicator is designed for serious traders who want to apply Smart Money Concepts (SMC) to their charts automatically. Manual SMC analysis is time-consuming and prone to subjective error. This tool removes the guesswork by algorithmically detecting Order Blocks, Fair Value Gaps, and Structural breaks in real-time. Whether you are a s

SuperTrend Visualizer – The Ultimate Trend-Following System
For MT4 version : https://www.mql5.com/en/market/product/158694
Stop guessing the market direction. SuperTrend Visualizer transforms your MetaTrader 5 chart into a clear, color-coded trading system. Unlike standard indicators that only draw a line, this tool automatically colors your candles based on the trend, helping you spot entries and exits instantly. Why SuperTrend Visualizer? Standard charts can be messy. This indicator uses

Check our selling page: LINK Our Best Product: LINK Product setting: Candles count: a parameter to count the candles on the chart. Timeframe: You can have this concept in multiple timeframes Swing: With this parameter, you can choose when this indicator finds the swings. (very basic and essential. Choose different numbers to see how it works.)
Product Introduction This indicator is built around the core principles of the Smart Money Concept (SMC) and is designed to help traders clearly unders

Индикатор предназначен для графиков ренко, построенных вот этим советником Что показывает индикатор: Скорость тренда: Низкий столбец гистограммы — бар сформировался быстро, что свидетельствует о сильном импульсе и высокой скорости движения цены, тренд. Периоды консолидации: Высокий столбец — рынок "топтался" долго, медленно набирая нужный диапазон. Это указывает на вялость, баланс или накопление, флэт. Изменение волатильности: Рост высоты столбцов при неизменном размере кирпича — прямое у

Swing BOS Structure is a market structure indicator for MetaTrader 5.
The indicator automatically detects: • Swing High (SH) • Swing Low (SL) • Break of Structure (BOS) • Change of Character (CHoCH)
Swings are confirmed only after a defined number of candles, ensuring no repainting. BOS signals indicate trend continuation. CHoCH signals indicate a potential change in market structure and may appear less frequently depending on market conditions and timeframe.
The indicator is lightweight, fa
FREE

DAILY OH/OL SDEV QUANT MODEL - STATISTICAL TRADING WITH PRECISION RISK MANAGEMENT
TRADE WITH MATHEMATICAL CERTAINTY - KNOW YOUR EXACT STOP-LOSS AND TAKE-PROFIT BEFORE YOU ENTER
This indicator analyzes 5,000+ days of price history to give you: Exact entry levels (sigma bands locked at daily open) Exact stop-loss distance (from M

Dynamic Market Oscillator (DMO) – Clean Dynamic Horizontal Levels Marker The Dynamic Market Oscillator is a versatile, minimalist overlay indicator that automatically drawing clean, real-time horizontal price levels with markers and extendable dashed rays. It is perfect for traders who want an uncluttered chart while instantly seeing the most important ongoing support and resistance zones. Works perfectly on ALL markets : Forex pairs (EURUSD, GBPUSD, USDJPY, exotics) Cryptocurrencies (BTCUSD, E

Website Description Identify high-probability Buy setups with the Dual-Force Pullback Signal Pro indicator. This powerful tool generates a strong "Buy" signal only when a constructive MACD pullback is confirmed on two different MACD settings (Slow and Fast) and the RSI is above 50, indicating bullish momentum and confirmation. The signals are delivered via sound, pop-up alerts, and push notifications, ensuring you never miss a confirmed entry. It's specifically designed for the M5 timeframe for

Descrição sugerida (português) AVA ICT Pro Signals é um indicador profissional para MetaTrader 5 baseado em conceitos ICT, projetado para encontrar pontos de reversão e continuidade com alta precisão. Ele combina pivôs inteligentes, detecção de FVG e leitura de momentum para gerar sinais de compra e venda visualmente claros no gráfico. O indicador não repinta, é leve e funciona em qualquer par e timeframe, o que permite usar a mesma lógica em Forex, índices, ouro e criptomoedas. As entradas são

The ZigZag Buy Level is a specialized tool for traders who utilize market structure and classic ZigZag patterns to define key support and entry points. It automatically identifies "Main Highs"—significant highs confirmed by the subsequent price action—and then calculates a high-probability "Buy Level" based on a specified percentage pullback from that Main High to the last corrective low. This indicator helps you anticipate deep retracement entries, clearly marking them on the chart with labels

SMC VALID EA (MT5) Version: 1.10
Author: Marrion Brave Wabomba
Category: Smart Money Concepts (SMC) and ICT concepts ICT Smart Money Daily Zones (SMC Pro) ICT Smart Money Daily Zones (SMC Pro) – ICT Daily Buy & Sell Zones Pro is a professional-grade Smart Money Concepts (SMC) / ICT trading indicator for MetaTrader 5, designed to clearly map institutional daily levels and guide traders with high-probability decision zones . This indicator automatically analyzes the Daily timeframe (PDH / PD

END OF YEAR OFFER: TILL 3RD OF AUGUST LEAVE COMMENT AND REVIEW FOR ICT EA ICT Core Levels is a professional MetaTrader 5 indicator built around Inner Circle Trader (ICT) concepts , designed to give traders a clear, structured view of the market using market structure, key price levels, trading sessions, and Fair Value Gaps (FVGs) — all in one clean, highly customizable tool. This indicator automatically maps out the most important institutional reference points , helping traders align with smar

Multi Kernel Regression Indicator MT5 Professional Non-Repainting Trend Following System with 17 Advanced Kernel Functions Overview The Multi Kernel Regression indicator is a sophisticated technical analysis tool that applies advanced statistical kernel regression methods to price data, offering traders a powerful edge in identifying trends and potential reversal points. Unlike traditional moving averages, kernel regression provides adaptive smoothing that responds intelligently to market dynam

Eternal Memory Levels Pro is an institutional-grade level activation and grid detection system designed to identify high-impact price zones where large market participants become active. The indicator continuously builds and memorizes dynamic support and resistance grids and monitors sequential level breaks. When multiple key levels are violated in the same direction, it signals a high-probability institutional activation, often followed by strong directional expansion. This is not a repainting

# Multi-Timeframe Moving Average Grid Indicator ## Product Overview This indicator displays multiple moving average lines across different timeframes on a single chart. It includes a dashboard that shows the nearest support and resistance levels based on the moving averages. The indicator is designed to help traders analyze price action relative to moving averages from multiple timeframes simultaneously.
does the same job as Money Map Grid --- ## Key Features ### Multi-Timeframe Displa

Title
SlamBam Signal — Non-Repainting Trend & Market Regime Filter (MT5)
Tagline
Signals that tell you when to trade — and when not to.
Short Description
A professional, non-repainting trend and market regime filter for MetaTrader 5, designed to provide stable signals, clean alerts, and deterministic market context for manual traders and EAs.
Full Description
SlamBam Signal is a commercial-grade trend and market regime indicator for MetaTrader 5.
It is designed to help traders and autom

The Super Signals Channel Indicator for MT5 is an effective Forex trading tool designed to track market movements. The MT5 signal point indicator effectively detects trend reversals after they have already occurred. The Super Signals Channel indicator is a fully automated technical tool that includes a number of parameters to track market trends. It automatically examines the ever-changing price dynamics of the market, compares the information with earlier data and generates a trading signal. Be

Trendline Breakouts with Targets - Never Miss a Breakout Again Stop Drawing Lines Manually. Let the Chart Do It For You. Remember the last time you drew a perfect trendline, only to have price break through it while you were away from your screen? Or spent hours analyzing charts trying to find the "right" trendlines, second-guessing every line you drew? Those days are over. The Trendline Breakouts indicator does the heavy lifting for you - automatically spotting the trendlines that actually matt
Версия MT4: https://www.mql5.com/ru/market/product/125434 Версия MT5: https://www.mql5.com/ru/market/product/157662
Помощник MT4: https://www.mql5.com/ru/market/product/107986
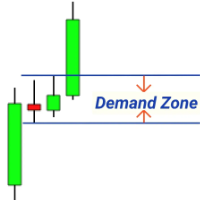
РАЛЛИ БАЗОВОЕ РАЛЛИ (RBR), ПАДЕНИЕ БАЗОВОЕ РАЛЛИ (DBR), ПАДЕНИЕ БАЗОВОЕ ПАДЕНИЕ (DBD), РАЛЛИ БАЗОВОЕ ПАДЕНИЕ (RBD), РАЗРЫВ СПРАВЕДЛИВОЙ ЦЕННОСТИ (FVG) / ДИСБАЛАНС, СКРЫТАЯ БАЗА
Представляем индикатор «Supply Demand MT4» — ваш лучший инструмент для точной и уверенной навигации в динамичном мире финансовых рынков. Этот п
MetaTrader Маркет - торговые роботы и технические индикаторы для трейдеров, доступные прямо в терминале.
Платежная система MQL5.community разработана для сервисов платформы MetaTrader и автоматически доступна всем зарегистрированным пользователям сайта MQL5.com. Ввод и вывод денежных средств возможен с помощью WebMoney, PayPal и банковских карт.

Вы упускаете торговые возможности:
- Бесплатные приложения для трейдинга
- 8 000+ сигналов для копирования
- Экономические новости для анализа финансовых рынков
Регистрация
Вход
Вы принимаете политику сайта и условия использования
Если у вас нет учетной записи, зарегистрируйтесь