 MetaTrader 5
 Эксперты
 Индикаторы
 Библиотеки
 Утилиты
 Виджеты
 Правила
Смотри обучающее видео по маркету на YouTube
Как купить торгового робота или индикатор
Запусти робота на
виртуальном хостинге
виртуальном хостинге
Протестируй индикатор/робота перед покупкой
Хочешь зарабатывать в Маркете?
Как подать продукт, чтобы его покупали
Новые технические индикаторы для MetaTrader 5 - 105
 На основании сигналов технических индикаторов принимаются решения относительно открытия или закрытия сделки на фондовом и форекс-рынках. Суть индикаторов заключается в математическом преобразовании цены и/или объемов финансового инструмента для прогнозирования изменений цен в будущем.
Протестируйте технические индикаторы, чтобы лучше предсказывать поведение рынка и зарабатывать на этом.

Dual Bollinger Session Channel Профессиональные фиксированные сессионные каналы Боллинджера для MetaTrader 5
Разработан для анализа ценового действия, пробоев и институциональной рыночной структуры с использованием данных реальных торговых сессий.
Обзор продукта Dual Bollinger Session Channel — это профессиональный технический индикатор для MetaTrader 5, который строит фиксированные статистические ценовые каналы на основе двух независимых расчётов полос Боллинджера, выполненных исключительно п
Получите ВСЕ мои индикаторы для MT4 и MT5 БЕСПЛАТНО — Узнайте как
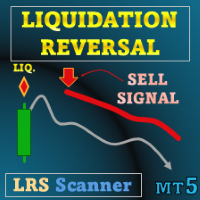
Специальное предложение : ALL TOOLS , всего $35 за каждый! Новые инструменты будут по цене $30 в течение первой недели или для первых 3 покупок ! Trading Tools Channel on MQL5 : Присоединяйтесь к моему каналу MQL5, чтобы получать последние новости от меня Liquidation Reversal Signals — это индикатор, разработанный для отметки направленных фаз ликвидации и подтверждения точек разворота путём объединения

SweepMaster – LSSD & APCE Обнаружение ликвидности, детектор стоп‑охоты и адаптивный движок уверенности в паттернах Индикатор обнаружения ликвидности с интеграцией трех торговых режимов (скальпинг, стандарт, свинг), двигателем уверенности APCE, анализом поглощения объема и адаптивными уровнями поддержки и сопротивления. Разработан для анализа потока ордеров в реальном времени. Рекомендуемый таймфрейм: H1 SweepMaster — это индикатор технического анализа, предназначенный для идентификации в реально

Deep Momentum Analyzer - это индикатор определения тренда на основе искусственного интеллекта, который визуализирует рыночный импульс через интуитивное гистограммное отображение, помогая трейдерам точно и четко определять бычьи и медвежьи рыночные условия. Обзор Deep Momentum Analyzer преобразует сложные рыночные данные в четкие, практичные торговые сигналы с использованием передовых аналитических алгоритмов. Этот профессиональный индикатор дает трейдерам мгновенную визуальную обратную связь о и
FREE

Fibonacci Auto Levels Pro MT5 – Уровни коррекции, расширения и точки разворота (Pivot Points) Fibonacci Auto Levels Pro MT5 — это продвинутый инструмент технического анализа, который автоматически определяет точки разворота рынка и рисует полные структуры Коррекции (Retracement), Расширения (Extension) и Точек разворота (Pivot Point) Фибоначчи на графике. Этот индикатор объединяет несколько независимых систем в один унифицированный аналитический инструмент: Точки разворота (Pivot Points) (Режим

Стратегия RSI Bollinger Bands Arrow Стратегия RSI Bollinger Bands Arrow – это чистый и эффективный технический индикатор, разработанный для выявления высоковероятных точек разворота с использованием комбинации RSI и полос Боллинджера. Эта стратегия использует индикатор RSI вместе с полосами Боллинджера, чтобы: Продавать , когда цена находится выше верхней полосы Боллинджера. Покупать , когда цена находится ниже нижней полосы Боллинджера. Сигналы генерируются только тогда, когда оба индикатора по

Rossi Campos Arrows Indicator – Торгуйте с индикатором, который действительно работает Если вы ищете больше ясности при входе и выходе с рынка, этот индикатор создан для вас.
Я разработал эксклюзивный индикатор для MetaTrader 5, который одновременно сочетает два самых уважаемых технических фильтра: Полосы Боллинджера и RSI. Алгоритм выполняет всю тяжёлую работу за вас: Когда появляется реальная возможность для покупки, на графике отображается зелёная стрелка. Когда приходит время продавать, появ

NeuroSignal AI v1.0: Ваш ИИ-навигатор для торговли XAUUSD Встречайте будущее торгового анализа. NeuroSignal AI — это не просто индикатор, а целая экосистема для принятия решений, работающая на основе передового искусственного интеллекта, который анализирует множество индикаторов. Созданный специально для работы с уникальной волатильностью XAUUSD (Золото) , этот инструмент предоставляет четкие сигналы с оценкой уверенности и профессиональный риск-менеджмент прямо на графике MetaTrader 5.

Квантовый анализ волатильности и определение рыночных режимов Schrödinger Market Wells (SMW) предлагает альтернативный подход к традиционному техническому анализу. В отличие от стандартных полос волатильности (как Bollinger Bands), основанных исключительно на простых статистических отклонениях, SMW моделирует ценовое движение, используя принципы финансовой квантовой механики . Этот индикатор интерпретирует цену как частицу, взаимодействующую внутри «Потенциальной ямы» (Potential Well). Это позво

Монитор пробоя "в один клик" Больше никаких пропущенных пробоев. Price Alert Line создан для трейдеров, которым нужны скорость и простота. Вместо сложных меню для настройки алертов на графике появляется кнопка. Одним кликом вы ставите горизонтальную линию, которая следит за ценой и сразу оповещает, когда цена её пересекает. Новая функция (Smart UI): кнопки автоматически принимают цвет своих линий. Линия сопротивления красная — кнопка красная; поддержка синяя — кнопка синяя. Основные функции 1. У

AlgoMatrix EMA Ribbon Trend Pro (MT5) Профессиональный индикатор EMA Ribbon для MetaTrader 5
Обзор — Для трейдеров, которые следуют за трендом
AlgoMatrix EMA Ribbon Trend Pro — это профессиональный индикатор тренда на основе EMA Ribbon для MetaTrader 5, разработанный для трейдеров, которым важны чёткое подтверждение тренда, дисциплинированные входы и стабильные сигналы без перерисовки.
Индикатор помогает торговать только в направлении реального тренда, избегая бокового рынка и хаотичных движе

EXTREME POI Indicator Join the telegram community for an exciting trading journey. https://t.me/automated_TLabs Professional Trading Indicator for MetaTrader 5/Metatrader 4
EXTREME POI is an advanced institutional-grade trading indicator designed to identify high-probability Points of Interest (POI) based on Smart Money Concepts. The indicator combines multiple sophisticated techniques to detect areas where institutional traders are likely to enter the market.
Working Pairs GOLD, EURUSD,
FREE

Полосы Mogalef — Динамическая структура диапазона и целевые зоны (MT5) Полосы Mogalef — это визуальный индикатор рыночной структуры, который рассматривает рынок как динамический диапазон , смещающийся поэтапно. Вместо отдельных “сигналов” он дает контекстные уровни, чтобы: понимать, где цена сейчас “работает” (рабочая зона), находить потенциальные зоны продолжения/расширения (цели), и фильтровать шум за счет устойчивого, неимпульсивного обновления (с инерцией). Индикатор рассчитан на дискрецио
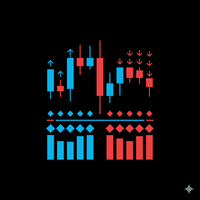
TrendPower All-In-One Strict v1.00 Description TrendPower All-In-One Strict is a comprehensive trend-following trading system designed for MetaTrader 5. It acts as a "confluence detector," meaning it filters market noise by requiring multiple technical indicators to agree before generating a signal. The indicator utilizes a "Strict" logic engine, meaning a signal is only generated when momentum, trend direction, and volatility filters all align perfectly. It displays data in a separate sub-win

HiloPower – Advanced Trend and Market Strength Indicator for MetaTrader 5 HiloPower is not just another trend indicator developed from the traditional Hi-Lo. It was designed to offer a more complete and intelligent reading of the market, combining direction, strength, and intensity of movements. With it, the trader can see not only where the price is going, but also how strong and volatile that movement really is.
FREE
N/B: All our product purchase comes with our free ‘’DAILY SCALPER EA’’ - bit.ly/4qlFLNh Whatsapp Developer for yours after successful purchase
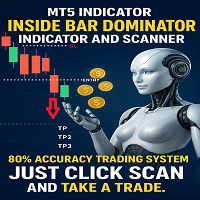
UNLOCK THE 4-CANDLE SECRET: Trade Like a PRO with "Inside Bar Dominator"
ATTENTION ALL TRADERS!
Are you tired of:
· Losing trades from false breakouts? · Missing entries because you're stuck analyzing charts? · Complex indicators that give conflicting signals? · Struggling to find clear stop loss and take profit levels?
What if I told you th
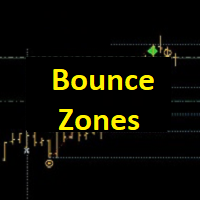
+++++++++++++++++++++++++++++++++++++++++++++++++++++++++++++++++++++++++++++++++++++++++++++++++++++++ +++ Link to EURUSD Only Free Version --> https://www.mql5.com/en/market/product/156904 +++ Full License --> https://www.mql5.com/en/market/product/156842 +++++++++++++++++++++++++++++++++++++++++++++++++++++++++++++++++++++++++++++++++++++++++++++++++++++++ +++ XMAS SALE
+++ Get this indicator for free when renting the Forecast System Full License (one license for one account)
+++ Please

IQ Trade Status – A Professional Trade Panel to track all your LIVE TRADES in a single dashboard. IQ Trade Status is not just a trade panel; it is a professional dashboard designed for MetaTrader. It replaces the default Terminal window with a clean, structured, and actionable overview of your account and open trades.
The dashboard is designed to help you instantly answer three critical questions: How much have I made today? How much will I lose if all my trades go wrong? Is my account over-lev

Volume Profile Trading System is NOT just another volume indicator. It's a complete trading ecosystem that combines professional volume profile visualization with an intelligent automated trading strategy. While other indicators show you WHERE volume is concentrated, Volume Profile Trading System shows you WHERE , WHEN , and HOW to trade it! displaying real volume distribution by price instead of time. It helps traders identify fair value zones, institutional activity, and high

ZIVA TrendX is a professional trend-oriented indicator engineered to provide a clear and structured assessment of market direction through a cloud-based analytical framework. The indicator analyzes price behavior relative to dynamically derived trend boundaries, forming a continuous cloud structure that visually represents the prevailing market bias. This structure enables traders to maintain alignment with dominant directional conditions while filtering short-term market noise. All internal ca

The DFG Chart Indicator displays the historical DFG levels used in the DFG dashboard. These levels are generated dynamically using moving averages and Fibonacci ratios. The Fibonacci Bands automatically adjust to reflect changes in the price range and trend direction. The indicator also features buttons for selecting chart symbol and timeframe, along with a wide range of customization options. Key Features Dynamic DFG Levels
Automatically calculated using moving averages and Fibonacci ratios. H
FREE

Optimized Trend Tracker Oscillator Indicator for MT5 (OTTO) A precision-engineered trend tracking oscillator designed for traders who demand clarity, adaptability, and multi-layered signal confirmation. OTTO combines adaptive volatility modelling, advanced moving averages, and trend-stop logic to produce an oscillator that reacts intelligently to market structure rather than noise. This indicator is suitable for traders who want early trend detection, dynamic stop-zones, and visually clean cross
Pairs Synthetic Pro (Synthetic Pairs & Spread) Master Correlation Trading Correlation trading and statistical arbitrage are now within your reach thanks to the Pairs Synthetic Pro indicator. This tool goes beyond simple ratio analysis, acting as a specialized radar for detecting price imbalances between two assets to anticipate market corrections. For example, when Brent rises while WTI lags, the price spread widens. Our indicator, integrated with adaptive Bollinger Bands, identifies when this d
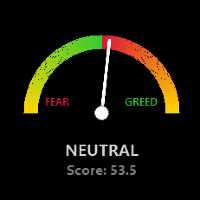
Global Market Risk Sentiment Meter 1. Overview
The Global Market Risk Sentiment Meter is an analytical indicator designed for the MetaTrader 5 (MQL5) platform. It employs an Inter-Market Analysis approach to assess the aggregate data of specific global financial markets. By evaluating real-time price changes across US Indices, Global Equities, Cryptocurrencies, and historical Safe Haven assets (Gold and the US Dollar Index), the indicator calculates a composite sentiment score. This data is vis
FREE

Shadow Bands Pro – MT5 说明(中英文) English Description (MT5) Shadow Bands Pro – Advanced Reversion System for MT5 This MT5 edition of Shadow Bands Pro takes full advantage of the MT5 platform, offering faster calculations, more timeframes, and better testing capabilities.
It remains a non-repainting (on close) trend-reversal / mean-reversion tool with dynamic channels, entity-break logic, and an integrated statistics panel. Key Features Optimized for MT5’s 64-bit, multi-threaded architecture Non-
FREE

StrikeZone Macd Atr is an advanced volatility-adaptive oscillator that scales the traditional MACD using ATR.
This approach solves the common problem of conventional MACD: it does not react properly to changing volatility.
With ATR scaling, momentum becomes clearer, smoother, and more meaningful across all market conditions. Key Features 1. ATR-Scaled MACD Oscillator The indicator adjusts (MACD – Signal) by ATR ratio, allowing: Reduced noise during high-volatility periods Enhanced sensitivity du
FREE

StrikeZone ATR is a professional-grade ATR-based volatility indicator designed for precision intraday trading.
It visualizes volatility strength using a dynamic histogram and smoothed deviation line, helping traders instantly identify expansion, contraction, trend strength, and reversal zones. Key Features TradingView-style ATR histogram (Up/Down bars with multi-color levels) Smoothed deviation line for clearer volatility trend Instant detection of volatility spikes and quiet zones Color-coded b
FREE
KST Pro Tools: Advanced Momentum Indicator KST Pro Tools is an advanced implementation of the famous Know Sure Thing (KST) indicator by Martin Pring. Designed for traders seeking an objective reading of momentum, this tool filters out market noise to highlight only the phases of directional acceleration. Through an intelligent filtering logic, KST Pro Tools allows you to quickly identify dominant trends and distinguish strong momentum phases from periods of market neutrality. Key Features Optimi

New Trend Stage— это уникальный индикатор нового поколения, создающий динамические проекции рыночного движения на основе реальных данных текущего дня. Это не классические каналы. Это — улучшенная система авторской геометрии, построенная на принципах временных смещений, динамики диапазонов и адаптивных уровней.
Индикатор автоматически определяет, вычисляет реальный диапазон за последние N часа относительно каждого экстремума и строит точные направленные проекции будущего движения цены. Это даёт
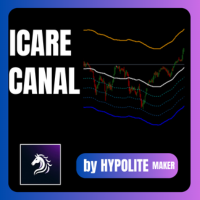
ICARUS CHANNEL The ICARUS CHANNEL is a technical indicator designed to identify extreme price zones and optimize your entry and exit points in the market. How It Works The tool is based on a Simple Moving Average (SMA) , which represents the fair market value. Around this line, it identifies overbought (Premium) and oversold (Discount) zones: Premium Zone (Orange): Price is considered too high. Ideal for selling (short). Discount Zone (Blue): Price is considered a bargain. Ideal for buying (long

Multi-RSI: 4 RSI in 1 for Comprehensive and Fast Market Analysis Analyze market strength and momentum like a professional. Multi-RSI combines four distinct RSI indicators into a single window, providing a clear view of market dynamics across multiple timeframes. Each RSI features a configurable period to adapt to your specific trading strategies and styles. Key Features 4 RSI in one indicator: Track multiple timeframes simultaneously. Fully customizable periods: Individually adjust each RSI to f
Hi Traders, THV MTF Candle Range with Fibo is a powerful MT5 indicator designed to help traders clearly identify key price levels, higher-timeframe structure, and high-probability reaction zones directly on the chart without switching time frames. Key Features:
Options to select the number of HTF candles to display on your lower-timeframe chart Displays High / Low / Mid / Fibonacci levels of higher-timeframe (HTF) candle ranges Option to display Fibonacci levels for all HTF candles or only the
Описание работы Индикатор MA7 Lavender основан на стандартном индикаторе Stochastic Oscillator. Показывает пересечение главной и сигнальной линий в зонах перекупленности и перепроданности. Подробная информация о индикаторе MA7 Lavender .
Настройки индикатора General settings В данной группе располагаются настройки индикатора Stochastic Oscillator.
Message settings В данной группе располагаются настройки уведомлений при появлении стрелок.
Arrow display settings В данной группе располагаются на
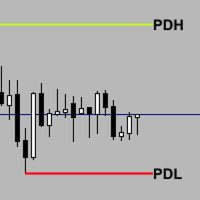
Previous_Highs_Lows-Socarix-STS Previous_Highs_Lows-Socarix-STS automatically plots the previous day, week and month highs and lows (PDH/PDL, PWH/PWL, PMH/PML), extending these levels forward in time and labeling them clearly.
It highlights confluences when several levels share the same price and can mark crossed levels with an “X”, with optional fading. Weekly and monthly levels use smart logic: levels that were already crossed earlier in the current week/month are hidden for today. Fully custo

HMA Color – Master Smoothed Overview HMA Color – Master Smoothed is a MetaTrader 5 indicator based on a Hull Moving Average calculation with an additional smoothing layer. The indicator displays market direction using a color-changing HMA line and optional visual candle representation. The objective is to provide a simplified visual view of trend direction while reducing short-term fluctuations in the displayed curve. Features • Hull Moving Average calculation • Additional smoothing layer • Aut
FREE
Clr-Dynamic RSI v SMA Indicator : A Comprehensive Analysis of Features and Advantages
The Clr-Dynamic RSI v SMA indicator represents a significant evolutionary leap in technical analysis tools, transforming the classic Relative Strength Index (RSI) from a potentially ambiguous oscillator into a sophisticated, multi-dimensional trading system. At its core, this indicator retains the mathematical foundation of the RSI, measuring the speed and change of price movements, but radically enhances its
MSX Hybrid Heiken Scalper Overview MSX Hybrid Heiken Scalper is a MetaTrader 5 indicator based on a modified Heiken Ashi methodology with closed-bar smoothing. The indicator is designed to display trend direction through color-coded candles while reducing sensitivity to short-term market fluctuations. All calculations are performed using completed candles, allowing historical values to remain fixed after bar close. Features • Modified Heiken Ashi calculation • Closed-bar processing • Color-code
FREE
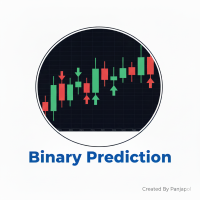
Binary Prediction: The Ultimate Decision Support Tool for Binary Options Traders Binary Prediction is a meticulously developed indicator tailored specifically to meet the demands of Binary Options trading. It is designed to simplify complex market analysis, providing clear, reliable trading signals for both novice and experienced traders looking to enhance their decision-making process. Core Features & Advantages: Dedicated Binary Options Algorithm: The core logic is fine-tuned to capture cruc
FREE

RITZ Candle Kaufman’s AMA is a precision market-flow indicator built around Kaufman’s Adaptive Moving Average (KAMA / AMA) — a dynamic smoothing algorithm that automatically adjusts to changing volatility.
This enhanced version interprets AMA momentum directly into smart candle-color signals , giving traders a clean, noise-filtered view of trend strength and directional bias. Where most indicators repaint or react too slowly, RITZ Candle AMA delivers stable, non-repainting color shifts based on
FREE
Hi Traders, The THV EMA Distance Monitor is a lightweight and flexible MT5 indicator designed to display the real-time distance between price and multiple Exponential Moving Averages (EMA) directly on the chart. The indicator allows traders to enable or disable up to five EMAs, each with a customizable period, making it adaptable to different trading strategies and market conditions. For each selected EMA, the distance from the current price is calculated and displayed in a clear on-chart panel.
FREE

Quantum Frequency Indicator MT5 Universal Market Frequency Analyzer for MT5 Trade Forex, Crypto, Stocks & Indices With Advanced Frequency-Based Signals Overview The Quantum Frequency Indicator (QFI) MT5 Version is a next-generation analytical tool designed to detect the hidden frequency structures within financial markets. Based on 14 years of research into market vibrations, price cycles and energy flow patterns, QFI provides traders with highly refined Buy and Sell zones across all major

AI Adaptive Market Holographic System Indicator Based on Microstructure and Field Theory Abstract: This paper aims to explore the construction principles and implementation mechanism of a novel financial market analysis tool—the Micro gravity regression AIselfregulation system. This system fuses Market Microstructure theory, classical mechanics (elasticity and gravity models), information entropy theory, and adaptive AI algorithms. By aggregating Tick-level data in real-time, physically modeling
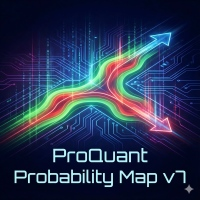
ProQuant Probability Map: A Dual-Quant Prediction System to Navigate the Future Say goodbye to blind guessing. Let historical data be your compass. The ProQuant Probability Map is an advanced quantitative tool exclusively designed for MetaTrader 5. Unlike traditional lagging indicators (such as RSI or MACD), it calculates historical price distribution probabilities in real-time, directly projecting a "Heatmap" of potential future price levels onto the right side of your chart. Version 7 introduc
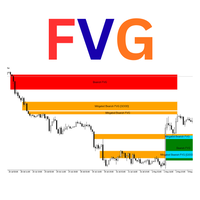
Luta FVG Pro – Professional Fair Value Gap (FVG) Indicator
Detects Institutional Fair Value Gaps on H4 timeframe with the same way used by ICT/SMC traders.
Features: • Real-time Bullish & Bearish FVG detection • Automatic Mitigation tracking • Inverted FVG signals (very powerful reversal setups) • "GOOD" FVG marking (gaps ≥ 2× minimum size – higher probability) • Clean rectangles with smart labels (Bullish FVG / Mitigated / Inverted) • Overlap filter option • Maximum 50 active zones (no chart
FREE
GridLinesX is a lightweight and efficient utility for MetaTrader 5 designed to help traders visualize price levels with precision. Whether you are a Grid Trader, a Scalper, or simply need to mark psychological price levels, GridLinesX automates the process instantly. Forget about drawing manual horizontal lines one by one. Simply define your High/Low range and the grid step (in points), and the tool will generate a clean, customizable grid overlay on your chart. Key Features: Customizable Range:
FREE

USD STRENGHT VERSUS MARKET USD (DXY) Versus Market Panel is a professional visual indicator designed to analyze US Dollar strength and pressure against major trading symbols in real time. The indicator compares USD performance (based on DXY logic or internal strength calculation) versus selected symbols, allowing traders to quickly identify dominant currency flow, relative strength, and market bias from a single panel view. Built with a clean, lightweight, and non-intrusive panel , this tool hel
FREE

TCM Breakeven Calculator Ultra is a professional utility designed to instantly visualize your True Weighted Average Entry Price with the Total Lot Size . Unlike simple averages, this tool mathematically accounts for Lot Sizes , giving you the exact price where your net position reaches zero loss. It automatically scans your terminal and isolates trades based on the chart you are viewing. If you are trading multiple pairs (e.g., EURUSD and Gold) simultaneously, this indicator will onl
FREE
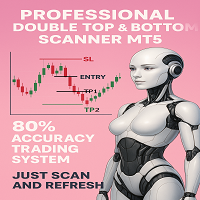
N/B: All our product purchase comes with our free ‘’DAILY SCALPER EA’’ - bit.ly/4qlFLNh Whatsapp Developer for yours after successful purchase
PROFESSIONAL DOUBLE TOP/BOTTOM PATTERN SCANNER
The Ultimate Reversal Trading System for Forex & Crypto Traders
TRANSFORM YOUR TRADING WITH INSTANT PATTERN RECOGNITION
Are you tired of missing profitable reversal setups? Exhausted from staring at charts for hours, trying to spot double tops and bottoms? Frustrated with false breakouts and misse

Candle color RSI (Relative Strength Index) indicators change candlestick colors on the price chart to visually show RSI conditions like overbought/oversold levels or bullish/bearish momentum, using colors like red for overbought/bearish and green for oversold/bullish, helping traders spot reversals or strength at a glance without looking at the separate RSI pane. These custom indicators often color candles red above 70 (overbought), green below 30 (oversold), and keep default colors in between
FREE

Want to AUTOMATE this strategy? We have released the fully automated Expert Advisor based on this logic. Check out Range Vector Fibo Logic EA here: https://www.mql5.com/en/market/product/158065
UPGRADE AVAILABLE: Tired of manual trading? I just released the Automated MTF Version with Mobile Alerts and Auto-Targets. Get the Pro Version here: https://www.mql5.com/en/market/product/159350 Range Vector Fibo Logic (Indicator) One Candle Strategy Stop waking up at 3 AM to draw lines manually. Range
FREE

Supply and demand in trading describes how buyer (demand) and seller (supply) actions set asset prices, with high demand/low supply raising prices (premium) and low demand/high supply lowering them (discount); traders identify these imbalances as "zones" on charts (e.g., Rally-Base-Rally for demand, Drop-Base-Drop for supply) to find potential entry/exit points, aiming to buy at discount demand zones and sell at premium supply zones, using volume and price action to confirm institutional acti
FREE
Hi Traders, The Volume Spike Alert Indicator is a lightweight, non-lagging tool designed to help traders identify unusual volume activity in real time. This indicator calculates the average tick volume over a user-defined number of previous bars and compares it with the current candle’s volume. When the current volume exceeds the average by a specified percentage, the indicator triggers alerts, allowing traders to quickly spot potential breakouts, institutional activity, or strong market interes
FREE

APT – Advance Pivot Trader Indicator for MetaTrader 5 APT – Advance Pivot Trader is a technical indicator developed for MetaTrader 5.
The indicator is based entirely on mathematical and algorithmic calculations and is designed to analyze market structure using pivot-based logic. Professional Trading Tools for Every Trader: https://www.mql5.com/en/users/royalcrescent777/seller
Join our Community & Signal channels: https://www.mql5.com/en/channels/xauusd-signal Timeframe and Risk Guidance The in
FREE

>> Announcements Channel << ATR Plus is an enhanced version of the classic ATR that shows not just volatility itself, but the directional energy of the market .
The indicator converts ATR into a normalized oscillator (0–100), allowing you to clearly see: who dominates the market — buyers or sellers when a trend begins when a trend loses strength when the market shifts into a range where volatility reaches exhaustion zones ATR Plus is perfect for momentum, trend-following, breakout and volatilit
FREE
++++++++++++++++++++++++++++++++++ +++ Trend Tool ++++++++++++++++++++++++++++++++++ Hallo Trader, This is a trend tool that I use... based on four moving averages. Price below or above the EMA200 is indication for the long term trend. Also the direction of the slope counts. You can customise in settings if you want. The tool is aligned with my Forecast System and the Bounce Zones. - Forecast System --> https://www.mql5.com/en/market/product/156904 - Bounce Zones --> https://www.mql5.com/en/mar
FREE

his indicator automatically identifies key support and resistance levels by analyzing volume patterns. Unlike traditional S/R tools that rely only on price, Volume S/R finds levels where the market truly reacted. DETECTION LOGIC: - High Volume Zones: Price levels where strong buying/selling occurred - Low Volume Zones: Areas of weak interest - potential breakout or reversal zones
SMART FILTERING: - Nearby levels are automatically merged to avoid chart clutter - Maximum levels limit keeps yo
FREE

A custom indicator that displays a real-time countdown showing how much time remains before the current candle closes and the next one opens. Equipped with a 10-second audio countdown , providing a visual–auditory reminder so traders don’t miss critical moments before a candle closes and can execute decisions with precision. Highly useful for traders who rely on precise timing whether for entries, exits, or analyzing momentum that forms exactly at candle open and close.
FREE

PhotonAurum Beam – Proprietary Price Pulse Indicator Descriptions PhotonAurum Beam reveals the silent rhythm of price — a proprietary visual intelligence system developed by Bob’s Channel for elite traders who see what others miss. 98% Accuracy!!! Forget lagging indicators and noisy alerts. PhotonAurum Beam silently scans the market in real time, then marks critical turning zones the moment they form — with surgical precision and zero repainting. This isn’t just another signal tool. It’s your v

**News Monitor Allert**
Trading the financial markets without being aware of the economic calendar is a critical mistake that leads to unnecessary losses. Even the best technical strategy can fail instantly during a high-impact news release. This utility provides the ultimate solution, acting as a safeguard for your capital.
One of the most powerful features of this indicator is its ease of use. Unlike many other tools on the market, **you do not need to configure any external links, download

Edri Extreme Points Buy & Sell A reversal-based entry indicator designed to identify high-probability turning points in the market. How to Use Green arrow (Buy signal): Appears below the candle when conditions favour a potential bullish reversal. Consider entering long positions. Red arrow (Sell signal): Appears above the candle when conditions favour a potential bearish reversal. Consider entering short positions. Optional Mean Reversion Bands Enable this feature in the settings to display dyna

MM Ultimate Pro Analyzer v10.0 - USER GUIDEBASIC USAGEStep 1: Add to Chart Open any chart in MetaTrader 5 Go to Navigator → Indicators Find MM Ultimate Pro Analyzer Drag it onto your chart A settings window will appear Step 2: Configure for Your Timeframe Choose settings based on what you trade: Timeframe NumberOfCandles VolumeAveragePeriod M1-M5 (Scalping) 10-20 50 M15-M30 (Day Trading) 5-10 30 H1-H4 (Swing Trading) 3-7 20 D1+ (Position Trading) 3-5 14 Step 3: Understand the Button Bar At the t
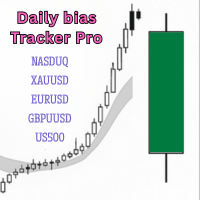
This indicator helps traders easily understand potential market direction. It combines the Average True Range (ATR) and Volume-Weighted Moving Average (VWMA) to measure market volatility and create a dynamic cloud.
Bullish Bias Rules: A bullish momentum phase begins when a candle closes above the upper cloud. You can expect the bias to remain bullish until a candle closes below the lower cloud. Note: The bullish trend remains active even if the price (candle) moves between the two clouds. Onc

This indicator is a hybrid SMC + Trend + Oscillator tool that draws market-structure objects on the chart and also plots trend shift lines + arrows and a colored oscillator histogram.
It includes these modules:
Phantom Shift (ATR trend shift / trailing bands)
Swing Structure (BOS/CHoCH + swing points)
Internal Structure (iBOS/iCHoCH)
Order Blocks (swing + internal)
Equal Highs / Equal Lows (EQH / EQL)
Fair Value Gaps (FVG)
Premium / Discount zones (range zones)
Phantom Oscillator (MA
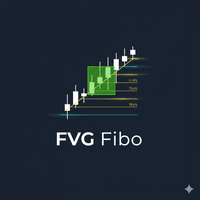
Master Smart Money Concepts with Precision. The FVG Pro with Fibonacci Zones is a sophisticated Price Action tool designed for MetaTrader 5. It automates the identification of Fair Value Gaps (Imbalances) and simultaneously projects key Fibonacci retracement levels within those gaps. In Smart Money trading, a Fair Value Gap (FVG) often acts as a magnet for price. However, knowing where inside the gap price will reverse is the challenge. This indicator solves that by automatically plottin
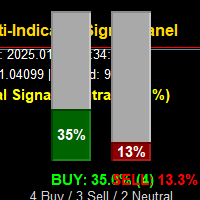
Overview The Multi-Indicator Signal Panel is a comprehensive technical analysis tool for MetaTrader 5 that combines signals from 9 different technical indicators into a single, easy-to-read visual interface. Instead of cluttering your chart with multiple indicators, this tool analyzes them all and presents the combined results through intuitive vertical bar graphs and clear recommendations.
Visual Interface: Two Vertical Bar Graphs (Green = Buy, Red = Sell) Real-time signal str
HTF Liquidity Sweeps Dashboard Pro
Tagline: See the Big Picture. Trade the Sweep. Never Switch Timeframes Again. Overview:
Stop losing focus by constantly switching between timeframes. The HTF Liquidity Sweeps Dashboard projects Higher Timeframe (H1, H4, Daily) candles directly onto your current chart's empty space. Designed for ICT, SMC, and Price Action traders, this tool allows you to monitor macro-trends and liquidity sweeps while executing on lower timeframes with laser precision. W

VSA Pulse System
Stop trading shapes. Start trading Energy. The advanced VSA + Price Action logic engine. Recommended Experience Level: Intermediate to Advanced Description:
Most indicators show you history (lag). The VSA Pulse System shows you reality (physics). This indicator decodes the "Energy" behind every candle. It moves beyond simple "Bullish" or "Bearish" labels and identifies the intent of the Smart Money. It answers the three most critical questions in trading: Is this move r

Title: HTF Candle Insight - See the Big Picture on One Chart Introduction: Stop switching tabs constantly! HTF Candle Insight allows you to visualize Higher Timeframe price action directly on your current trading chart. Whether you are a Scalper, Day Trader, or Swing Trader, seeing the "Big Picture" candle structure is crucial for identifying trends, reversals, and key levels (Support/Resistance). Key Features: Dual HTF Overlay: Display up to 2 different Higher Timeframes simultaneously (e.g.,

Every Trader trades in a market zone. If you are not living in the time zone you are trading, you need a clock to show you what time it is in your favorite time zone, and it should be small at the same time to not interrupt your trading process. In this small indicator, you have access to 3 major clocks around the world, and you can easily look at them. We have some other products that I am sure will help you with your trading career. Please have a look at the link: LINK our all-in-one trading

Overview Liquidity Indicator is a market analysis tool designed to help traders identify potential market reaction zones based on liquidity behavior and price action. Instead of using traditional moving averages, this indicator analyzes liquidity flow and pivot structures to highlight areas where price may react. This indicator is intended to support technical analysis and decision-making, not to predict or guarantee market outcomes.
MetaTrader Маркет - уникальная площадка по продаже роботов и технических индикаторов, не имеющая аналогов.
Памятка пользователя MQL5.community расскажет вам и о других возможностях, доступных трейдерам только у нас: копирование торговых сигналов, заказ программ для фрилансеров, автоматические расчеты через платежную систему, аренда вычислительных мощностей в MQL5 Cloud Network.

Вы упускаете торговые возможности:
- Бесплатные приложения для трейдинга
- 8 000+ сигналов для копирования
- Экономические новости для анализа финансовых рынков
Регистрация
Вход
Вы принимаете политику сайта и условия использования
Если у вас нет учетной записи, зарегистрируйтесь