

MQL5取引ツール(第23回):カメラ制御対応DirectX 3Dグラフによる二項分布分析
 21
21
 0
0

はじめに
現在、二項分布を2次元(2D)でグラフ表示するツールがありますが、奥行きを利用した可視化がない場合、確率質量関数のパターンを詳細に確認することが難しくなることがあります。バーの重なりは平面的に見え、頻度の差が空間的なコントラストとして見えにくくなり、分析視点を切り替える際にも、単純な切り替えではなく再起動が必要になります。本記事は、より深い確率的洞察を得るために、インタラクティブな3次元(3D)描画機能を統計可視化ツールへ拡張したいMetaQuotes Language 5 (MQL5)開発者およびアルゴリズムトレーダーを対象としています。
前回の記事(第22回)では、インタラクティブなCanvas上で、シミュレーションサンプルのヒストグラムと理論的な確率質量関数曲線を表示する、二項分布可視化用のMQL5可視化ツールを構築しました。第23回となる今回は、MQL5の二項分布ビューワーにDirect3Dを統合し、2D/3Dモードの切り替えと、回転、ズーム、自動フィットを可能にするカメラ制御機能を実装します。本記事では、グラウンドプレーンや軸を含む3Dヒストグラムバーの描画方法、PMF曲線の投影方法、そして2D統計情報、凡例、テーマ設定を維持する方法について説明します。また、クラスベースのアーキテクチャ、マウス操作、リアルタイム更新、頻度やPMF形状の確認を改善するためのパラメータ調整についても扱います。本記事では以下のトピックを扱います。
この記事を読み終える頃には、二項分布分析のための3D機能を備えた実用的なMQL5ツールを手に入れ、さらにカスタマイズできる状態になります。それでは、始めましょう。
DirectX 3D可視化フレームワークのアーキテクチャを理解する
MQL5のDirectX 3D可視化フレームワークは、ハードウェアアクセラレーションによるグラフィックスを活用し、チャート上で複雑な3Dシーンを描画します。このフレームワークはCanvasシステムと統合されており、シームレスな2D/3Dモードの切り替えと、インタラクティブな操作を可能にします。DirectXは、ヒストグラムバー用のボックス、グラウンドプレーン、軸用のラインなど、3Dオブジェクトを効率的に描画するために使用されます。同時に、カメラ位置、ライティング、投影処理を管理することで、データ表示に奥行きと遠近感を与えます。このアーキテクチャは、回転、ズーム、自動フィットなどの動的なユーザー操作をサポートしており、2Dでは確認しにくいパターンを視覚的な奥行きによって明らかにできるため、トレード環境における分布データのような多次元データの探索に適しています。
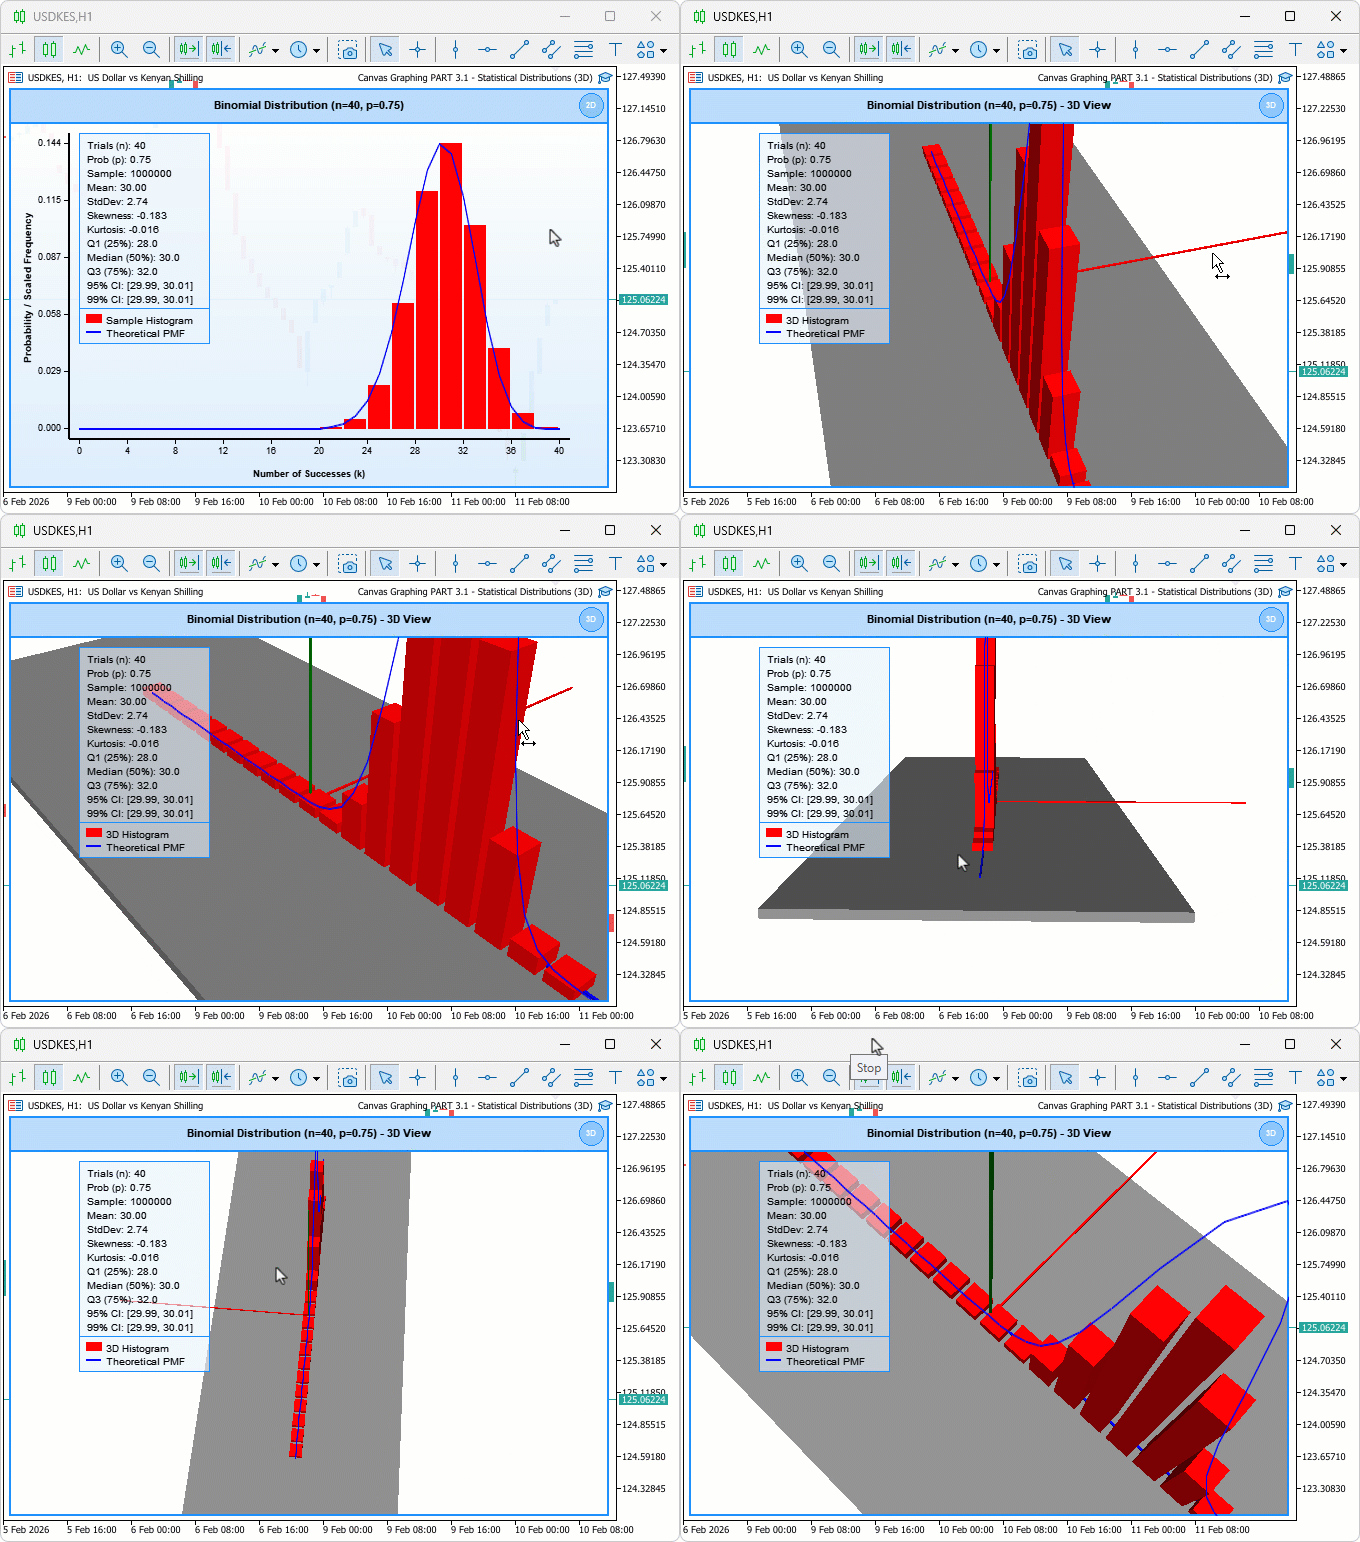
本記事では、2D二項分布グラフ描画ツールを基盤として、3Dモードを追加します。この3Dモードでは、ヒストグラムバーを3Dで可視化し、グラウンドプレーンや方向確認用の色付き軸を組み込み、カメラ操作によって確率質量関数や頻度をより詳細に確認できるようにします。設計の概要は、Canvas作成、3Dオブジェクト初期化、シミュレーションデータの読み込み、リアルタイム応答のためのイベント駆動型更新処理を管理するクラスベース構造です。2Dおよび3D描画ロジックをカプセル化するビジュアライザークラスを定義し、ボックスプリミティブを使用して3D要素を作成します。また、カメラ制御のための投影行列とビュー行列を設定し、ドラッグ操作、サイズ変更、ホイールズームなどのインタラクティブ機能とモード切り替えを統合します。最終的に、このフレームワークは平面的なデータグラフをインタラクティブな3Dモデルへ変換し、より深い分析と洞察を可能にします。以下が完成イメージです。
MQL5での実装
3D対応のためのライブラリ、列挙型、入力設定の追加
3D描画を可能にするためには、まずプログラムの基盤を拡張する必要があります。そのため、3D CanvasおよびDirectXボックスをサポートする適切なライブラリを追加します。さらに、プログラムを再起動することなく、実行中に2Dモードと3Dモードを切り替えられるようにする列挙型を定義します。そして、プログラムの読み込み時点から3D環境の外観や動作を制御する入力パラメータと定数を設定します。そのためのロジックを以下に実装します。
//+------------------------------------------------------------------+
//|    Canvas Graphing PART 3.1 - Statistical Distributions (3D).mq5 |
//|                           Copyright 2026, Allan Munene Mutiiria. |
//|                                   https://t.me/Forex_Algo_Trader |
//+------------------------------------------------------------------+
#property copyright "Copyright 2026, Allan Munene Mutiiria."
#property link      "https://t.me/Forex_Algo_Trader"
#property version   "1.00"
#property strict

#include <Canvas\Canvas.mqh>
#include <Canvas\Canvas3D.mqh>
#include <Canvas\DX\DXBox.mqh>
#include <Math\Stat\Binomial.mqh>
#include <Math\Stat\Math.mqh>

//+------------------------------------------------------------------+
//| Enumerations                                                     |
//+------------------------------------------------------------------+
enum ResizeDirection {
   NO_RESIZE,                                           // No resize
   RESIZE_BOTTOM_EDGE,                                  // Resize bottom edge
   RESIZE_RIGHT_EDGE,                                   // Resize right edge
   RESIZE_CORNER                                        // Resize corner
};

enum ViewModeType {
   VIEW_2D_MODE,                                        // 2D mode
   VIEW_3D_MODE                                         // 3D mode
};

//+------------------------------------------------------------------+
//| Inputs                                                           |
//+------------------------------------------------------------------+
sinput group "=== VIEW MODE SETTINGS ==="
input ViewModeType     viewMode = VIEW_2D_MODE;         // View Mode (2D or 3D)

sinput group "=== 3D VIEW SETTINGS ==="
input bool               autoFitCamera = true;          // Auto-Fit Camera on Load
input double             initialCameraDistance = 60.0;  // Initial Camera Distance (3D)
input double             initialCameraAngleX = 0.6;     // Initial Camera Angle X (3D)
input double             initialCameraAngleY = 0.8;     // Initial Camera Angle Y (3D)

sinput group "=== 3D GROUND AND AXES SETTINGS ==="
input color              groundPlaneColor = clrLightGray; // Ground Plane Color
input double             groundPlaneOpacity = 0.6;      // Ground Plane Opacity (0-1)
input float              groundPlaneWidth = 50.0;       // Ground Plane Width (X direction)
input float              groundPlaneDepth = 20.0;       // Ground Plane Depth (Z direction)
input float              groundPlaneThickness = 0.5;    // Ground Plane Thickness (Y direction)
input bool               show3DAxes = true;             // Show 3D Axes
input color              axisXColor = clrRed;           // X Axis Color
input color              axisYColor = clrGreen;         // Y Axis Color
input color              axisZColor = clrBlue;          // Z Axis Color
input float              axisLength = 20.0;             // Axis Length
input float              axisThickness = 0.1f;          // Axis Thickness

//+------------------------------------------------------------------+
//| Constants                                                        |
//+------------------------------------------------------------------+
const int MIN_CANVAS_WIDTH = 300;
const int MIN_CANVAS_HEIGHT = 200;
const int HEADER_BAR_HEIGHT = 35;
const int SWITCH_ICON_SIZE = 24;
const int SWITCH_ICON_MARGIN = 6;
実装は、まず必要な追加ライブラリをインクルードすることから始めます。#include <Canvas\Canvas3D.mqh>を追加して3D描画機能を有効化し、#include <Canvas\DX\DXBox.mqh>を追加して3Dモデルで使用するDirectXボックスプリミティブを利用できるようにします。次に、ユーザー表示モード用の列挙型を追加します。ViewModeType列挙型には、表示形式を切り替えるためのVIEW_2D_MODEとVIEW_3D_MODEが含まれます。続いて、整理のためにグループ化された追加の入力パラメータを設定します。まず、viewModeによって表示モードを選択できるようにし、デフォルト値はVIEW_2D_MODEに設定します。3D専用の設定として、カメラ位置を自動調整するautoFitCamera、初期カメラ距離を設定するinitialCameraDistance、初期カメラ角度を設定するinitialCameraAngleXおよびinitialCameraAngleYなどの入力項目を追加します。
さらに、3Dグラウンドおよび軸に関する入力項目も追加します。これには、groundPlaneColor、groundPlaneOpacity、groundPlaneWidth、groundPlaneDepth、groundPlaneThicknessなどのグラウンドプレーン設定、そしてshow3DAxesによる3D軸表示の切り替え、axisXColorなどの軸カラー設定、axisLengthおよびaxisThicknessによる軸の長さと太さの調整が含まれます。これにより、3D環境を柔軟にカスタマイズできます。最後に、モード切り替えボタン用として、SWITCH_ICON_SIZEやSWITCH_ICON_MARGINなどの追加アイコン関連定数を宣言します。変更箇所を明確にするため、該当部分をハイライトしています。 次に、すべてのグローバル変数と関数をクラスへリファクタリングし、管理を容易にするとともに、コードをモジュール化します。まずはグローバル変数から開始し、これらをクラスのメンバー変数へ移行します。
ビジュアライザークラスとメンバー変数の定義
コードを整理し、拡張可能な構造にするため、このツール全体を単一のクラスへリファクタリングします。これにより、すべての状態変数、描画ロジック、操作処理を1つのクラス内で管理します。このセクションでは、クラス定義を作成し、Canvas識別情報、ウィンドウサイズ、ユーザー操作状態、3Dカメラの向き、バー・グラウンドプレーン・軸などのDirectXシーンオブジェクト、さらに可視化を駆動するすべてのデータ配列や統計指標を管理するために必要なメンバー変数を宣言します。
//+------------------------------------------------------------------+
//| Distribution visualization window class                          |
//+------------------------------------------------------------------+
class DistributionVisualizer
  {
protected:
   CCanvas3D         m_mainCanvas;           // Main 3D-capable canvas
   string            m_canvasObjectName;     // Chart object name for the canvas bitmap

   int               m_currentPositionX;     // Current X position of the canvas on chart
   int               m_currentPositionY;     // Current Y position of the canvas on chart
   int               m_currentWidth;         // Current canvas width in pixels
   int               m_currentHeight;        // Current canvas height in pixels

   bool              m_isDragging;           // True while user is dragging the canvas
   bool              m_isResizing;           // True while user is resizing the canvas
   int               m_dragStartX;           // Mouse X when drag began
   int               m_dragStartY;           // Mouse Y when drag began
   int               m_canvasStartX;         // Canvas X when drag began
   int               m_canvasStartY;         // Canvas Y when drag began
   int               m_resizeStartX;         // Mouse X when resize began
   int               m_resizeStartY;         // Mouse Y when resize began
   int               m_resizeInitialWidth;   // Canvas width at resize start
   int               m_resizeInitialHeight;  // Canvas height at resize start
   ResizeDirection   m_activeResizeMode;     // Currently active resize direction
   ResizeDirection   m_hoverResizeMode;      // Resize direction under cursor hover

   bool              m_isHoveringCanvas;      // True when mouse is over the canvas
   bool              m_isHoveringHeader;      // True when mouse is over the header bar
   bool              m_isHoveringResizeZone;  // True when mouse is in a resize grip zone
   bool              m_isHoveringSwitchIcon;  // True when mouse is over the mode switch icon
   int               m_lastMouseX;            // Last recorded mouse X coordinate
   int               m_lastMouseY;            // Last recorded mouse Y coordinate
   int               m_previousMouseButtonState; // Mouse button state on previous event

   ViewModeType      m_currentViewMode;      // Active view mode (2D or 3D)
   bool              m_are3DObjectsCreated;  // True once 3D scene objects have been built

   CDXBox            m_histogramBars[];      // Array of 3D boxes representing histogram bars
   CDXBox            m_groundPlane;          // 3D box used as the ground reference plane
   CDXBox            m_axisX;                // 3D box representing the X axis
   CDXBox            m_axisY;                // 3D box representing the Y axis
   CDXBox            m_axisZ;                // 3D box representing the Z axis

   double            m_cameraDistance;       // Distance from camera to scene origin
   double            m_cameraAngleX;         // Camera elevation angle (radians)
   double            m_cameraAngleY;         // Camera azimuth angle (radians)
   int               m_mouse3DStartX;        // Mouse X when 3D rotation drag began
   int               m_mouse3DStartY;        // Mouse Y when 3D rotation drag began
   bool              m_isRotating3D;         // True while user is rotating the 3D scene

   double            m_sampleData[];                   // Raw binomial sample values
   double            m_histogramIntervals[];           // Histogram bin center positions
   double            m_histogramFrequencies[];         // Scaled frequency per histogram bin
   double            m_theoreticalXValues[];           // X values for the theoretical PMF curve
   double            m_theoreticalYValues[];           // Y values for the theoretical PMF curve
   double            m_minDataValue;                   // Minimum value in data range
   double            m_maxDataValue;                   // Maximum value in data range
   double            m_maxFrequency;                   // Peak raw frequency across all bins
   double            m_maxTheoreticalValue;            // Peak theoretical PMF value
   bool              m_isDataLoaded;                   // True once distribution data is ready

   double            m_sampleMean;                     // Computed sample mean
   double            m_sampleStandardDeviation;        // Computed sample standard deviation
   double            m_sampleSkewness;                 // Computed sample skewness
   double            m_sampleKurtosis;                 // Computed sample excess kurtosis
   double            m_percentile25;                   // 25th percentile (Q1)
   double            m_percentile50;                   // 50th percentile (median)
   double            m_percentile75;                   // 75th percentile (Q3)
   double            m_confidenceInterval95Lower;      // Lower bound of 95% confidence interval
   double            m_confidenceInterval95Upper;      // Upper bound of 95% confidence interval
   double            m_confidenceInterval99Lower;      // Lower bound of 99% confidence interval
   double            m_confidenceInterval99Upper;      // Upper bound of 99% confidence interval
};
ここでは、二項分布の2Dおよび3D可視化を管理する「ウィンドウマネージャ」として、グラフ描画ツール全体のロジックをカプセル化するDistributionVisualizerクラスを定義します。protectedセクションでは、まず3D対応の描画をおこなうためのCCanvas3Dオブジェクトであるm_mainCanvas、オブジェクト識別用の文字列m_canvasObjectName、現在位置やサイズを管理する整数変数であるm_currentPositionXやm_currentWidthなどを宣言します。また、ResizeDirection列挙型を使用したm_isDragging、m_dragStartX、m_activeResizeModeなど、ユーザー操作状態を管理するためのブール値や整数変数も含まれます。表示関連の変数として、ViewModeTypeから取得するm_currentViewMode、3Dオブジェクトが作成済みかを管理するm_are3DObjectsCreatedを用意します。さらに、3D要素を構築するため、CDXBox配列であるm_histogramBars、そして個別のボックスオブジェクトであるm_groundPlane、m_axisX、m_axisY、m_axisZを宣言します。
カメラ制御については、m_cameraDistance、m_cameraAngleX、m_cameraAngleYなどのdouble型変数を使用し、3D操作用のトラッカーとしてm_mouse3DStartXやm_isRotating3Dを用意します。データ保存には、サンプルデータ、ヒストグラム、理論値を保持する配列であるm_sampleDataやm_histogramFrequenciesを使用します。また、最小値・最大値を管理する変数、データ読み込み状態を示すフラグm_isDataLoaded、さらにm_sampleMeanやm_confidenceInterval95Lowerなどの統計情報を保持するメンバー変数も含まれます。ここでは、すべてのメンバー変数を個別に説明することはしません。その多くは以前のバージョンと同じものであり、今回追加された内容については理解しやすいように詳細なコメントを付けています。これで準備が整ったため、次に変数を初期化するためのpublicコンストラクタを作成します。
クラスインスタンスの初期化と破棄
クラス構造が完成したので、次にコンストラクタを用意します。コンストラクタは、描画やユーザー操作が開始される前に、すべてのメンバー変数を安全で予測可能な初期状態へ設定します。また、デストラクタでは、3Dバー、グラウンドプレーン、軸などに関連するDirectXリソースを明示的に解放します。これにより、オブジェクトが不要になった際にGPUメモリが残されたままになることを防ぎ、プログラムを正常に終了できるようにします。
public:
   //+------------------------------------------------------------------+
   //| Initialize all member variables to safe defaults                 |
   //+------------------------------------------------------------------+
   DistributionVisualizer(void)
     {
      //--- Set canvas object name
      m_canvasObjectName = "DistCanvas";
      //--- Set initial canvas X position from input
      m_currentPositionX = initialCanvasX;
      //--- Set initial canvas Y position from input
      m_currentPositionY = initialCanvasY;
      //--- Set initial canvas width from input
      m_currentWidth = initialCanvasWidth;
      //--- Set initial canvas height from input
      m_currentHeight = initialCanvasHeight;

      //--- Reset drag state
      m_isDragging = false;
      //--- Reset resize state
      m_isResizing = false;
      //--- Reset drag origin X
      m_dragStartX = 0;
      //--- Reset drag origin Y
      m_dragStartY = 0;
      //--- Reset canvas position snapshot X
      m_canvasStartX = 0;
      //--- Reset canvas position snapshot Y
      m_canvasStartY = 0;
      //--- Reset resize origin X
      m_resizeStartX = 0;
      //--- Reset resize origin Y
      m_resizeStartY = 0;
      //--- Reset width snapshot for resize
      m_resizeInitialWidth = 0;
      //--- Reset height snapshot for resize
      m_resizeInitialHeight = 0;
      //--- Reset active resize direction
      m_activeResizeMode = NO_RESIZE;
      //--- Reset hover resize direction
      m_hoverResizeMode = NO_RESIZE;

      //--- Reset canvas hover flag
      m_isHoveringCanvas = false;
      //--- Reset header hover flag
      m_isHoveringHeader = false;
      //--- Reset resize zone hover flag
      m_isHoveringResizeZone = false;
      //--- Reset switch icon hover flag
      m_isHoveringSwitchIcon = false;
      //--- Reset last mouse X
      m_lastMouseX = 0;
      //--- Reset last mouse Y
      m_lastMouseY = 0;
      //--- Reset previous mouse button state
      m_previousMouseButtonState = 0;

      //--- Set view mode from input
      m_currentViewMode = viewMode;
      //--- Mark 3D objects as not yet created
      m_are3DObjectsCreated = false;

      //--- Set camera distance from input
      m_cameraDistance = initialCameraDistance;
      //--- Set camera elevation angle from input
      m_cameraAngleX = initialCameraAngleX;
      //--- Set camera azimuth angle from input
      m_cameraAngleY = initialCameraAngleY;
      //--- Reset 3D rotation drag origin X
      m_mouse3DStartX = -1;
      //--- Reset 3D rotation drag origin Y
      m_mouse3DStartY = -1;
      //--- Mark 3D rotation as inactive
      m_isRotating3D = false;

      //--- Reset data range minimum
      m_minDataValue = 0.0;
      //--- Reset data range maximum
      m_maxDataValue = 0.0;
      //--- Reset peak histogram frequency
      m_maxFrequency = 0.0;
      //--- Reset peak theoretical PMF value
      m_maxTheoreticalValue = 0.0;
      //--- Mark data as not yet loaded
      m_isDataLoaded = false;

      //--- Reset sample mean
      m_sampleMean = 0.0;
      //--- Reset standard deviation
      m_sampleStandardDeviation = 0.0;
      //--- Reset skewness
      m_sampleSkewness = 0.0;
      //--- Reset kurtosis
      m_sampleKurtosis = 0.0;
      //--- Reset 25th percentile
      m_percentile25 = 0.0;
      //--- Reset median
      m_percentile50 = 0.0;
      //--- Reset 75th percentile
      m_percentile75 = 0.0;
      //--- Reset 95% CI lower bound
      m_confidenceInterval95Lower = 0.0;
      //--- Reset 95% CI upper bound
      m_confidenceInterval95Upper = 0.0;
      //--- Reset 99% CI lower bound
      m_confidenceInterval99Lower = 0.0;
      //--- Reset 99% CI upper bound
      m_confidenceInterval99Upper = 0.0;
}
DistributionVisualizerクラスのコンストラクタでは、インスタンス生成時にメンバ変数をデフォルト値または入力値に基づいて初期化します。まず、Canvas名をDistCanvasに設定し、初期位置やサイズにはユーザー入力から取得した値を割り当てます。次に、インタラクション用のフラグをfalseにリセットし、座標トラッカーを0に設定します。また、サイズ変更モードをNO_RESIZEに初期化します。ホバー状態もfalseに設定し、マウスのトラッカー値を0にします。表示モードにはviewModeの値を設定し、3Dオブジェクト用のフラグはfalseに初期化します。カメラについては、初期距離と角度を設定し、3Dマウスの値を-1に、回転フラグをfalseに設定します。最後に、データの最小値・最大値、およびロード状態を適切な初期値に設定し、統計的な指標もすべて0に初期化します。これにより、クラスは各種操作を実行できる準備が整います。次に、初期化解除時に要素を破棄する必要があるため、クラスのデストラクタでその処理を実装します。デストラクタは通常、コンストラクタと同じようにクラス名を使用しますが、その前にチルダ(~)を付ける点が異なります。
//+------------------------------------------------------------------+
//| Release all 3D scene objects on destruction                      |
//+------------------------------------------------------------------+
~DistributionVisualizer(void)
  {
   //--- Get total number of histogram bar boxes
   int count = ArraySize(m_histogramBars);
   //--- Loop over every bar and release its DirectX resources
   for(int i = 0; i < count; i++)
     {
      m_histogramBars[i].Shutdown();
     }
   //--- Release ground plane DirectX resources
   m_groundPlane.Shutdown();
   //--- Release X axis DirectX resources
   m_axisX.Shutdown();
   //--- Release Y axis DirectX resources
   m_axisY.Shutdown();
   //--- Release Z axis DirectX resources
   m_axisZ.Shutdown();
  }
ここではDistributionVisualizerクラスのデストラクタをを定義し、オブジェクトが破棄される際にリソースが適切に解放されるようにします。まず、m_histogramBarsに対してArraySizeを使用してヒストグラムバーの数を取得し、その後、各バーを順番にループ処理してShutdownメソッドを呼び出します。これにより、3Dバーに関連付けられたDirectXリソースが解放されます。次に、m_groundPlane、m_axisX、m_axisY、m_axisZに対してもShutdownを呼び出し、グラウンドプレーンや各軸オブジェクトのリソースを解放します。これにより、メモリリークを防ぎ、クリーンな終了処理を実現します。デストラクタは自動的に呼び出されるという点を理解しておくことが重要です。デストラクタの定義は必須ではありませんが、リソースを適切に解放するために定義することが推奨されます。
次に、クラスのメンバー関数を定義します。関数は、クラス内部で宣言した後、スコープ演算子(::)を使用してクラス外部で定義することもできます。しかし今回は、複雑さを減らすため、クラス内部のpublic領域で関数として宣言する方法を採用します。まずは3Dの可視化から始めます。
3Dヒストグラムバーとカメラの構築
ここでは、3Dシーンの中心となる部分を構築します。DirectXのボックスプリミティブとして各ヒストグラムバーを生成し、色を設定するための関数を定義します。また、実際のバーの高さに基づいて、シーン全体が画面内に収まるように自動調整されたカメラ距離を計算します。さらに、バーを視覚的に配置するための基準となるグラウンドプレーンを作成し、空間内での方向や位置関係を把握できるようにX軸、Y軸、Z軸のラインを構築します。加えて、現在の角度や距離の値に基づいて、各フレームごとにカメラのワールド座標位置とライティング方向を更新します。そして、元となる分布データが変更された場合には、各バーの位置やスケールを動的に再配置・再調整します。これらの処理によって、データ変化に対応したリアルタイムな3Dヒストグラム表示を実現します。
//+------------------------------------------------------------------+
//| Allocate and configure one DXBox per histogram bin               |
//+------------------------------------------------------------------+
bool create3DHistogramBars()
  {
   //--- Allocate the bar array to match the required bin count
   ArrayResize(m_histogramBars, histogramCells);

   //--- Decompose histogram colour into RGB byte components
   uchar r = (uchar)((histogramColor)       & 0xFF);
   uchar g = (uchar)((histogramColor >> 8)  & 0xFF);
   uchar b = (uchar)((histogramColor >> 16) & 0xFF);

   //--- Create and configure each bar box
   for(int i = 0; i < histogramCells; i++)
     {
      //--- Create unit box; actual transform applied later in update step
      if(!m_histogramBars[i].Create(m_mainCanvas.DXDispatcher(), m_mainCanvas.InputScene(),
                                    DXVector3(-0.5f, 0.0f, -0.5f),
                                    DXVector3(0.5f, 1.0f, 0.5f)))
        {
         Print("ERROR: Failed to create 3D box for bar ", i);
         return false;
        }

      //--- Set the bar's base diffuse colour from the histogram colour input
      m_histogramBars[i].DiffuseColorSet(DXColor(r / 255.0f, g / 255.0f, b / 255.0f, 1.0f));
      //--- Add a subtle specular highlight for depth perception
      m_histogramBars[i].SpecularColorSet(DXColor(0.2f, 0.2f, 0.2f, 0.3f));
      //--- Set specular shininess exponent
      m_histogramBars[i].SpecularPowerSet(32.0f);
      //--- Disable self-emission (bars lit only by scene lights)
      m_histogramBars[i].EmissionColorSet(DXColor(0.0f, 0.0f, 0.0f, 0.0f));

      //--- Register the bar with the 3D scene
      m_mainCanvas.ObjectAdd(GetPointer(m_histogramBars[i]));
     }

   return true;
  }

//+------------------------------------------------------------------+
//| Compute an optimal camera distance and angles for the scene      |
//+------------------------------------------------------------------+
void autoFitCameraPosition()
  {
   //--- Abort if not in 3D mode or data has not been loaded
   if(m_currentViewMode != VIEW_3D_MODE || !m_isDataLoaded) return;

   //--- Fixed scene width used for distance estimation
   float totalWidth  = 30.0f;
   //--- Track the tallest bar in the scene
   float maxBarHeight = 0.0f;

   //--- Use the peak theoretical value as the Y scale reference
   double rangeY = m_maxTheoreticalValue;
   //--- Guard against division by zero
   if(rangeY == 0) rangeY = 1;

   //--- Find the maximum normalised bar height across all bins
   for(int i = 0; i < histogramCells; i++)
     {
      float normalizedHeight = (float)(m_histogramFrequencies[i] / rangeY);
      float barHeight = normalizedHeight * 15.0f;
      if(barHeight > maxBarHeight) maxBarHeight = barHeight;
     }

   //--- Determine bounding extents for the entire scene
   float sceneWidth  = totalWidth;
   float sceneHeight = MathMax(maxBarHeight, 15.0f);
   float sceneDepth  = 10.0f;

   //--- Compute the scene bounding diagonal for FOV-based fitting
   float diagonal = MathSqrt(sceneWidth  * sceneWidth  +
                             sceneHeight * sceneHeight +
                             sceneDepth  * sceneDepth);

   //--- Match the projection FOV used in initialize3DContext
   float fov = (float)(DX_PI / 6.0);
   //--- Derive camera distance so the scene fills the view with a 1.5x margin
   m_cameraDistance = (diagonal / 2.0f) / MathTan(fov / 2.0f) * 1.5;

   //--- Set a comfortable default elevation angle
   m_cameraAngleX = 0.5;
   //--- Set a comfortable default azimuth angle
   m_cameraAngleY = 0.7;

   //--- Enforce minimum distance to avoid clipping near-plane
   if(m_cameraDistance <  35.0) m_cameraDistance =  35.0;
   //--- Enforce maximum distance to keep bars visible
   if(m_cameraDistance > 100.0) m_cameraDistance = 100.0;

   Print("Auto-fit camera: Distance = ", m_cameraDistance,
         ", AngleX = ", m_cameraAngleX, ", AngleY = ", m_cameraAngleY);
  }

//+------------------------------------------------------------------+
//| Create the flat ground reference plane in 3D space               |
//+------------------------------------------------------------------+
bool createGroundPlane()
  {
   //--- Build a thin box spanning the configured width and depth
   if(!m_groundPlane.Create(m_mainCanvas.DXDispatcher(), m_mainCanvas.InputScene(),
                            DXVector3(-groundPlaneWidth / 2.0f, -groundPlaneThickness, -groundPlaneDepth / 2.0f),
                            DXVector3( groundPlaneWidth / 2.0f,  0.0f,                  groundPlaneDepth / 2.0f)))
     {
      Print("ERROR: Failed to create ground plane");
      return false;
     }

   //--- Decompose ground colour into RGB byte components (BGR layout)
   uchar r = (uchar)((groundPlaneColor >> 16) & 0xFF);
   uchar g = (uchar)((groundPlaneColor >> 8)  & 0xFF);
   uchar b = (uchar)( groundPlaneColor         & 0xFF);
   //--- Apply the configured ground colour and opacity
   m_groundPlane.DiffuseColorSet(DXColor(r / 255.0f, g / 255.0f, b / 255.0f,
                                         (float)groundPlaneOpacity));
   //--- Remove specular highlight for a flat matte look
   m_groundPlane.SpecularColorSet(DXColor(0.0f, 0.0f, 0.0f, 0.0f));

   //--- Register the ground plane with the 3D scene
   m_mainCanvas.ObjectAdd(GetPointer(m_groundPlane));

   return true;
  }

//+------------------------------------------------------------------+
//| Create colour-coded X, Y, and Z coordinate axis boxes            |
//+------------------------------------------------------------------+
bool create3DAxes()
  {
   //--- Create X axis as a thin horizontal box along positive X
   if(!m_axisX.Create(m_mainCanvas.DXDispatcher(), m_mainCanvas.InputScene(),
                      DXVector3(0.0f, 0.0f, 0.0f),
                      DXVector3(axisLength, axisThickness, axisThickness)))
     {
      Print("ERROR: Failed to create X axis");
      return false;
     }
   //--- Extract X axis colour components
   uchar rx = (uchar)((axisXColor >> 16) & 0xFF);
   uchar gx = (uchar)((axisXColor >> 8)  & 0xFF);
   uchar bx = (uchar)( axisXColor         & 0xFF);
   //--- Apply X axis diffuse colour
   m_axisX.DiffuseColorSet(DXColor(rx / 255.0f, gx / 255.0f, bx / 255.0f, 1.0f));
   //--- Remove specular for clean axis appearance
   m_axisX.SpecularColorSet(DXColor(0.0f, 0.0f, 0.0f, 0.0f));
   //--- Register X axis with the scene
   m_mainCanvas.ObjectAdd(GetPointer(m_axisX));

   //--- Create Y axis as a thin vertical box along positive Y
   if(!m_axisY.Create(m_mainCanvas.DXDispatcher(), m_mainCanvas.InputScene(),
                      DXVector3(0.0f, 0.0f, 0.0f),
                      DXVector3(axisThickness, axisLength, axisThickness)))
     {
      Print("ERROR: Failed to create Y axis");
      return false;
     }
   //--- Extract Y axis colour components
   uchar ry = (uchar)((axisYColor >> 16) & 0xFF);
   uchar gy = (uchar)((axisYColor >> 8)  & 0xFF);
   uchar by = (uchar)( axisYColor         & 0xFF);
   //--- Apply Y axis diffuse colour
   m_axisY.DiffuseColorSet(DXColor(ry / 255.0f, gy / 255.0f, by / 255.0f, 1.0f));
   //--- Remove specular for clean axis appearance
   m_axisY.SpecularColorSet(DXColor(0.0f, 0.0f, 0.0f, 0.0f));
   //--- Register Y axis with the scene
   m_mainCanvas.ObjectAdd(GetPointer(m_axisY));

   //--- Create Z axis as a thin depth box along positive Z
   if(!m_axisZ.Create(m_mainCanvas.DXDispatcher(), m_mainCanvas.InputScene(),
                      DXVector3(0.0f, 0.0f, 0.0f),
                      DXVector3(axisThickness, axisThickness, axisLength)))
     {
      Print("ERROR: Failed to create Z axis");
      return false;
     }
   //--- Extract Z axis colour components
   uchar rz = (uchar)((axisZColor >> 16) & 0xFF);
   uchar gz = (uchar)((axisZColor >> 8)  & 0xFF);
   uchar bz = (uchar)( axisZColor         & 0xFF);
   //--- Apply Z axis diffuse colour
   m_axisZ.DiffuseColorSet(DXColor(rz / 255.0f, gz / 255.0f, bz / 255.0f, 1.0f));
   //--- Remove specular for clean axis appearance
   m_axisZ.SpecularColorSet(DXColor(0.0f, 0.0f, 0.0f, 0.0f));
   //--- Register Z axis with the scene
   m_mainCanvas.ObjectAdd(GetPointer(m_axisZ));

   return true;
  }

//+------------------------------------------------------------------+
//| Recompute and apply the view matrix from spherical coordinates   |
//+------------------------------------------------------------------+
void updateCameraPosition()
  {
   //--- Only apply in 3D mode
   if(m_currentViewMode != VIEW_3D_MODE) return;

   //--- Start with a camera positioned along the negative Z axis
   DXVector4 camera = DXVector4(0.0f, 0.0f, (float)(-m_cameraDistance), 1.0f);

   //--- Rotate camera around the X axis by the elevation angle
   DXMatrix rotationX;
   DXMatrixRotationX(rotationX, (float)m_cameraAngleX);
   DXVec4Transform(camera, camera, rotationX);

   //--- Rotate the result around the Y axis by the azimuth angle
   DXMatrix rotationY;
   DXMatrixRotationY(rotationY, (float)m_cameraAngleY);
   DXVec4Transform(camera, camera, rotationY);

   //--- Apply the final camera world position
   m_mainCanvas.ViewPositionSet(DXVector3(camera));

   //--- Place the key light slightly above the camera position
   DXVector3 cameraPos = DXVector3(camera.x, camera.y, camera.z);
   DXVector3 lightPos  = DXVector3(cameraPos.x, cameraPos.y + 10.0f, cameraPos.z);
   //--- Scene origin is always the light target
   DXVector3 target    = DXVector3(0.0f, 0.0f, 0.0f);

   //--- Compute the raw light direction vector
   DXVector3 lightDir;
   lightDir.x = target.x - lightPos.x;
   lightDir.y = target.y - lightPos.y;
   lightDir.z = target.z - lightPos.z;

   //--- Compute the vector length for normalisation
   float length = MathSqrt(lightDir.x * lightDir.x +
                           lightDir.y * lightDir.y +
                           lightDir.z * lightDir.z);
   //--- Normalise the direction vector if it has non-zero length
   if(length > 0.0f)
     {
      lightDir.x /= length;
      lightDir.y /= length;
      lightDir.z /= length;
     }

   //--- Apply the normalised light direction to the scene
   m_mainCanvas.LightDirectionSet(lightDir);
  }

//+------------------------------------------------------------------+
//| Reposition and scale every 3D histogram bar to match data        |
//+------------------------------------------------------------------+
void update3DHistogramBars()
  {
   //--- Abort if data has not been loaded
   if(!m_isDataLoaded) return;

   //--- Compute the X data range for spatial mapping
   double rangeX = m_maxDataValue - m_minDataValue;
   //--- Use the peak PMF value as the height scale reference
   double rangeY = m_maxTheoreticalValue;
   //--- Guard against division by zero for X
   if(rangeX == 0) rangeX = 1;
   //--- Guard against division by zero for Y
   if(rangeY == 0) rangeY = 1;

   //--- Total scene width used to space the bars evenly
   float totalWidth = 30.0f;
   //--- Compute even spacing for each bar slot
   float barSpacing = totalWidth / (float)histogramCells;
   //--- Make each bar 80% of its slot to leave a small gap
   float barWidth   = barSpacing * 0.8f;
   //--- Shift origin so bars are centred on the scene
   float offsetX    = -totalWidth / 2.0f;

   //--- Update scale and position of every bar
   for(int i = 0; i < histogramCells; i++)
     {
      //--- Normalise this bin's frequency against the peak PMF
      float normalizedHeight = (float)(m_histogramFrequencies[i] / rangeY);
      //--- Map to scene height units (max 15 units tall)
      float barHeight = normalizedHeight * 15.0f;
      //--- Enforce a minimum visible height so bars are always rendered
      if(barHeight < 0.5f) barHeight = 0.5f;

      //--- Compute the bar's X centre in scene space
      float xPos = offsetX + (float)i * barSpacing + barWidth / 2.0f;

      //--- Build scale, translation and combined transform matrices
      DXMatrix scale, translation, transform;
      DXMatrixScaling(scale, barWidth, barHeight, barWidth);
      DXMatrixTranslation(translation, xPos, 0.0f, 0.0f);
      DXMatrixMultiply(transform, scale, translation);

      //--- Apply the combined world transform to this bar
      m_histogramBars[i].TransformMatrixSet(transform);
     }
  }
まず、create3DHistogramBars関数を定義し、ヒストグラム用の3Dバーを初期化します。m_histogramBars配列をArrayResizeを使用してhistogramCellsと同じサイズに変更します。次に、ビット演算を使用してhistogramColorからRGB成分を抽出します。その後、各セルをループ処理し、CDXBoxの各インスタンスを作成します。CreateメソッドにはDXディスパッチャ、入力シーン、および単位ボックス用のベクトル寸法を渡します。作成に失敗した場合は、エラーを出力してfalseを返します。成功した場合は、DiffuseColorSetを使用して正規化されたRGB値から拡散色を設定します。さらに、SpecularColorSetで鏡面反射色を設定し、SpecularPowerSetで光沢強度を指定します。EmissionColorSetでは発光値を0に設定します。最後に、ObjectAddを使用してポインタ経由でボックスをCanvasに追加し、成功時にはtrueを返します。
最適な表示位置になるようにカメラを自動調整するため、autoFitCameraPosition関数を実装します。この関数では、現在の表示モードがVIEW_3D_MODEではない場合、または、まだ読み込まれていない場合は、すぐに処理を終了します。まず、全体の幅を設定します。次に、各頻度値をY範囲で割り、15.0f倍にスケーリングした正規化バー高さを計算します。ループ処理によって最大のバー高さを取得します。その後、MathMaxを使用して高さを含むシーン全体の寸法を計算し、MathSqrtで対角線長を求めます。そして、視野角に基づいてMathTanを使用し、m_cameraDistanceを計算します。この値には1.5倍の補正係数を適用します。さらに、m_cameraAngleXとm_cameraAngleYに固定角度を設定し、カメラ距離を35.0から100.0の範囲内に制限します。最後に、デバッグ用として設定値を出力します。
次に、createGroundPlane関数を作成し、3D空間内に基準となる床面を追加します。m_groundPlaneに対してCreateメソッドを呼び出し、入力された寸法と厚みに基づいて原点を中心としたベクトルを渡します。作成に失敗した場合は、エラーを出力してfalseを返します。続いて、groundPlaneColorからRGB値を抽出し、DiffuseColorSetを使用して拡散色を設定します。この際、groundPlaneOpacityを使用して透明度も反映します。鏡面反射は0に設定し、ObjectAddを通じてCanvasへ追加します。正常に完了した場合はtrueを返します。方向を示すために、create3DAxes関数を定義し、X軸、Y軸、Z軸を構築します。show3DAxesがtrueの場合のみ軸を作成します。各軸について、それぞれの方向に応じた適切なベクトルサイズを指定してCreateを呼び出します。続いて、axisXColorなどの対応する色からRGB値を取得し、DiffuseColorSetを用いて拡散色を完全不透明(アルファ値255)に設定し、SpecularColorSetを用いて鏡面反射を無効化します。その後、ObjectAddを使用してオブジェクトをCanvasへ追加します。すべての処理が成功した場合はtrueを返し、途中でいずれかの処理が失敗した場合はエラーメッセージを出力してfalseを返します。
続いて、updateCameraPosition関数を実装し、3Dビューを調整します。3Dモードではない場合は処理を終了します。まず、Z軸方向にm_cameraDistanceだけ負方向へ移動したカメラベクトルを作成します。次に、DXMatrixRotationXとDXMatrixRotationYを使用し、設定された角度に基づいた回転行列を生成します。その後、DXVec4Transformを使用してベクトルを順番に変換し、ViewPositionSetによってカメラの表示位置を設定します。さらに、方向性ライトをシミュレートするため、カメラ上部にライト位置を設定します。そして、原点をターゲットとして、距離計算にMathSqrtを使用しながら方向ベクトルを算出して正規化します。最後に、LightDirectionSetを使用してライティング方向を適用します。
最後に、update3DHistogramBars関数を定義し、バーの位置とスケールを動的に更新します。データが存在しない場合は処理を終了します。まず、安全対策を含めて各範囲値を計算します。次に、全体幅を30.0fに設定し、間隔とバー幅を計算します。さらに、中央配置のためのオフセット値を求めます。その後、ループ処理によってバーの高さを正規化し、15.0f倍にスケーリングします。ただし、最低値は0.5fとして設定します。各バーのX座標を計算し、DXMatrixScalingを使用してスケール行列を作成します。また、DXMatrixTranslationで移動行列を作成し、それらをDXMatrixMultiplyで乗算します。最後に、生成した変換行列を各バーへTransformMatrixSetで適用し、3D空間上の位置と大きさを設定します。次におこなう処理は、3D表示用のヘッダーと枠線を描画することです。
3Dモードでのヘッダー、切り替えアイコン、枠線の描画
3Dモードであっても、ツールには適切なヘッダーバーが必要です。そこには分布タイトルを表示し、ユーザーがワンクリックで2Dモードへ戻れるように、明確に配置された切り替えボタンを表示します。さらに、Canvas全体を囲む枠線も必要です。これらはすべてDirectXシーン上に重ねて描画される2Dオーバーレイとして実装します。これにより、現在どちらの表示モードが有効であっても、ユーザーインターフェースの一貫性と操作性を維持できます。
//+------------------------------------------------------------------+
//| Draw the circular 2D/3D toggle icon in the header bar            |
//+------------------------------------------------------------------+
void drawSwitchIcon()
  {
   //--- Compute the icon's top-left corner from the canvas right margin
   int iconX = m_currentWidth  - SWITCH_ICON_SIZE - SWITCH_ICON_MARGIN;
   //--- Vertically centre the icon within the header bar
   int iconY = (HEADER_BAR_HEIGHT - SWITCH_ICON_SIZE) / 2;

   //--- Compute icon background colour from hover state
   color iconBgColor = m_isHoveringSwitchIcon
                       ? DarkenColor(themeColor, 0.1)     // Slightly darker on hover
                       : LightenColor(themeColor, 0.5);   // Default lighter shade

   uint argbIconBg = ColorToARGB(iconBgColor, 255);

   //--- Fill the circular icon background
   m_mainCanvas.FillCircle(iconX + SWITCH_ICON_SIZE / 2, iconY + SWITCH_ICON_SIZE / 2,
                           SWITCH_ICON_SIZE / 2, argbIconBg);

   //--- Draw the circular icon border using the theme colour
   uint argbBorder = ColorToARGB(themeColor, 255);
   m_mainCanvas.Circle(iconX + SWITCH_ICON_SIZE / 2, iconY + SWITCH_ICON_SIZE / 2,
                       SWITCH_ICON_SIZE / 2, argbBorder);

   //--- Set a small bold font for the mode label
   m_mainCanvas.FontSet("Arial Bold", 10);
   uint argbLabel = ColorToARGB(clrWhite, 255);

   //--- Display "2D" or "3D" depending on the active mode
   string modeLabel = (m_currentViewMode == VIEW_2D_MODE) ? "2D" : "3D";
   m_mainCanvas.TextOut(iconX + SWITCH_ICON_SIZE / 2, iconY + (SWITCH_ICON_SIZE - 10) / 2,
                        modeLabel, argbLabel, TA_CENTER);
  }

//+------------------------------------------------------------------+
//| Draw the header bar overlaid on the 3D rendered scene            |
//+------------------------------------------------------------------+
void drawHeaderBarOn3D()
  {
   //--- Compute the header fill colour from the current interaction state
   color headerColor;
   if(m_isDragging)
      headerColor = DarkenColor(themeColor, 0.1);       // Slightly darker while dragging
   else if(m_isHoveringHeader)
      headerColor = LightenColor(themeColor, 0.4);      // Medium light on hover
   else
      headerColor = LightenColor(themeColor, 0.7);      // Very light at rest

   uint argbHeader = ColorToARGB(headerColor, 255);

   //--- Paint over the top portion of the 3D render with the header colour
   m_mainCanvas.FillRectangle(0, 0, m_currentWidth - 1, HEADER_BAR_HEIGHT, argbHeader);

   //--- Overlay a border frame on the header if enabled
   if(showBorderFrame)
     {
      uint argbBorder = ColorToARGB(themeColor, 255);
      m_mainCanvas.Rectangle(0, 0, m_currentWidth - 1, HEADER_BAR_HEIGHT, argbBorder);
      m_mainCanvas.Rectangle(1, 1, m_currentWidth - 2, HEADER_BAR_HEIGHT - 1, argbBorder);
     }

   //--- Set the bold title font
   m_mainCanvas.FontSet("Arial Bold", titleFontSize);
   uint argbText = ColorToARGB(titleTextColor, 255);

   //--- Format the title string with current parameters and 3D label
   string titleText = StringFormat("Binomial Distribution (n=%d, p=%.2f) - 3D View",
                                   numTrials, successProbability);
   //--- Draw the title centred horizontally within the header
   m_mainCanvas.TextOut(m_currentWidth / 2, (HEADER_BAR_HEIGHT - titleFontSize) / 2,
                        titleText, argbText, TA_CENTER);

   //--- Draw the interactive 2D/3D mode switch icon
   drawSwitchIcon();
  }
//+------------------------------------------------------------------+
//| Draw the outer and inner border rectangles for 3D overlay        |
//+------------------------------------------------------------------+
void draw3DBorder()
  {
   //--- Use a slightly darker border when hovering a resize zone
   color borderColor = m_isHoveringResizeZone ? DarkenColor(themeColor, 0.2) : themeColor;
   uint  argbBorder  = ColorToARGB(borderColor, 255);

   //--- Draw the outermost border rectangle over the 3D render
   m_mainCanvas.Rectangle(0, 0, m_currentWidth - 1, m_currentHeight - 1, argbBorder);
   //--- Draw an inner border rectangle for a double-line effect
   m_mainCanvas.Rectangle(1, 1, m_currentWidth - 2, m_currentHeight - 2, argbBorder);
  }
ここでは、ビューを切り替えるためのトグルボタンをヘッダー内に描画するdrawSwitchIcon関数を定義します。まず、SWITCH_ICON_SIZEやSWITCH_ICON_MARGINなどの定数を基にアイコンの位置を計算します。次に、ホバー状態の場合はDarkenColorを使用して暗くした背景色を選択し、それ以外の場合はLightenColorを使用して明るくした背景色を設定します。その後、ColorToARGBを使用してARGB形式へ変換しFillCircleメソッドで円形の背景を塗りつぶします。続いて、Circleを使用して境界用の円を追加します。FontSetで太字フォントを設定し、白色のARGBテキストを準備します。「m_currentViewMode」の値に応じてラベルを「2D」または「3D」としてフォーマットし、TextOutを使用して中央に配置します。これにより、ユーザーが現在の表示状態を確認しながら、直感的にビューを切り替えられるインタラクティブな操作性を提供します。
次に、3Dモード用のヘッダーをオーバーレイ表示するdrawHeaderBarOn3D関数を作成します。これは2Dモードのヘッダーと似ていますが、タイトル表示が変更されています。まず、ドラッグ状態またはホバー状態に基づいてヘッダー色を決定します。色の調整にはDarkenColorまたはLightenColorを使用します。その後、FillRectangleで矩形領域を塗りつぶします。showBorderFrameがtrueの場合は、Rectangleを使用して枠線を追加します。続いてFontSetでフォントを設定し、StringFormatを使用して「- 3D View」を含むタイトル文字列を生成します。生成したタイトルはTextOutで中央に描画します。最後にdrawSwitchIconを呼び出し、ビュー切り替え用のアイコンを追加します。3D表示領域を囲むために、draw3DBorder関数を実装します。この関数では、サイズ変更時のホバー状態に応じて境界色を選択します。ホバー中の場合はDarkenColorを使用して色を暗くします。その後、ColorToARGBでARGB形式へ変換し、Rectangleを使用して内側と外側の矩形枠線を描画します。これにより、2Dモードの境界表示と一貫した外観を維持します。次に、3D平面との一貫性を保つため、3D理論曲線を描画します。今回はシンプルにするため、通常のライン曲線を使用します
理論曲線を3Dシーンへ投影する
ヒストグラムバーはDirectXシーン内で実際の3Dオブジェクトとして存在します。一方、理論的な確率質量関数曲線は、透視空間へ投影された2Dオーバーレイとして描画します。つまり、各曲線点に対して、ビュー行列と射影行列を組み合わせた変換処理を手動で適用し、画面上の配置位置を計算します。その後、Canvas上にアンチエイリアス処理されたラインとして描画します。さらに、ヘッダーバー上に曲線の一部が描画されることを防ぐため、クリッピング機能も追加します。これにより、3D表示中でもインターフェース領域とグラフ描画領域を明確に分離できます。
//+------------------------------------------------------------------+
//| Project the theoretical PMF curve into 3D screen space           |
//+------------------------------------------------------------------+
void draw3DTheoreticalCurve()
  {
   //--- Abort if data has not been loaded yet
   if(!m_isDataLoaded) return;

   //--- Compute the data ranges for world-space mapping
   double rangeX = m_maxDataValue - m_minDataValue;
   double rangeY = m_maxTheoreticalValue;
   if(rangeX == 0) rangeX = 1;
   if(rangeY == 0) rangeY = 1;

   //--- Match the total scene width used for the histogram bars
   float totalWidth = 30.0f;
   float offsetX    = -totalWidth / 2.0f;

   //--- Retrieve the current view-projection matrices for projection
   DXMatrix projection, view, worldToScreen;
   m_mainCanvas.ViewMatrixGet(view);
   m_mainCanvas.ProjectionMatrixGet(projection);
   //--- Combine view and projection into a single world-to-clip matrix
   DXMatrixMultiply(worldToScreen, view, projection);

   uint curveColor = ColorToARGB(theoreticalCurveColor, 255);

   //--- Transform and draw each consecutive pair of PMF samples
   for(int i = 0; i < ArraySize(m_theoreticalXValues) - 1; i++)
     {
      //--- Map PMF X and Y values into 3D world space
      float x1 = offsetX + (float)((m_theoreticalXValues[i]     - m_minDataValue) / rangeX * totalWidth);
      float y1 = (float)(m_theoreticalYValues[i]     / rangeY * 20.0);
      float x2 = offsetX + (float)((m_theoreticalXValues[i + 1] - m_minDataValue) / rangeX * totalWidth);
      float y2 = (float)(m_theoreticalYValues[i + 1] / rangeY * 20.0);

      //--- Build homogeneous 3D points on the Z = 0 plane
      DXVector4 p1_3d = DXVector4(x1, y1, 0.0f, 1.0f);
      DXVector4 p2_3d = DXVector4(x2, y2, 0.0f, 1.0f);

      //--- Project both points into clip space
      DXVec4Transform(p1_3d, p1_3d, worldToScreen);
      DXVec4Transform(p2_3d, p2_3d, worldToScreen);

      //--- Perform perspective divide only for points in front of the near plane
      if(p1_3d.w > 0.0f && p2_3d.w > 0.0f)
        {
         DXVec4Scale(p1_3d, p1_3d, 1.0f / p1_3d.w);
         DXVec4Scale(p2_3d, p2_3d, 1.0f / p2_3d.w);

         //--- Convert NDC coordinates to pixel coordinates
         int sx1 = (int)((float)m_currentWidth  * (0.5f + 0.5f * p1_3d.x));
         int sy1 = (int)((float)m_currentHeight * (0.5f - 0.5f * p1_3d.y));
         int sx2 = (int)((float)m_currentWidth  * (0.5f + 0.5f * p2_3d.x));
         int sy2 = (int)((float)m_currentHeight * (0.5f - 0.5f * p2_3d.y));

         //--- Clip line endpoints against the header bar boundary
         if(clipLineToHeader(sx1, sy1, sx2, sy2))
           {
            //--- Draw multiple offset passes for the configured line width
            for(int w = 0; w < curveLineWidth; w++)
               m_mainCanvas.LineAA(sx1, sy1 + w, sx2, sy2 + w, curveColor);
           }
        }
     }
  }

//+------------------------------------------------------------------+
//| Clip a line segment to exclude the header bar region             |
//+------------------------------------------------------------------+
bool clipLineToHeader(int &x1, int &y1, int &x2, int &y2)
  {
   //--- Reject the segment entirely if both endpoints are inside the header
   if(y1 < HEADER_BAR_HEIGHT && y2 < HEADER_BAR_HEIGHT)
      return false;

   //--- Accept the segment entirely if both endpoints are below the header
   if(y1 >= HEADER_BAR_HEIGHT && y2 >= HEADER_BAR_HEIGHT)
      return true;

   //--- Clip the first endpoint when it falls inside the header
   if(y1 < HEADER_BAR_HEIGHT)
     {
      if(y2 != y1)
        {
         //--- Linearly interpolate X to find the intersection with the header boundary
         x1 = x1 + (x2 - x1) * (HEADER_BAR_HEIGHT - y1) / (y2 - y1);
         y1 = HEADER_BAR_HEIGHT;
        }
     }
   //--- Clip the second endpoint when it falls inside the header
   else if(y2 < HEADER_BAR_HEIGHT)
     {
      if(y2 != y1)
        {
         //--- Linearly interpolate X to find the intersection with the header boundary
         x2 = x1 + (x2 - x1) * (HEADER_BAR_HEIGHT - y1) / (y2 - y1);
         y2 = HEADER_BAR_HEIGHT;
        }
     }

   return true;
  }
ここでは、理論的な確率質量関数を3Dシーン上に2Dラインとして重ねて描画するdraw3DTheoreticalCurve関数を定義します。これにより、完全な3D曲線モデルを作成することなく、透視投影に従って正しく表示できます。完全な3D曲線として実装することも可能ですが、今回は3Dバーに焦点を当てるため採用しません。まず、データが読み込まれていない場合は早期に処理を終了します。次に、安全対策を含めてX範囲とY範囲を計算します。ヒストグラムとの位置合わせを維持するため、全体幅を設定し、中央配置用のオフセットを計算します。
3D座標を2Dスクリーン座標へ投影するために、行列を宣言します。ViewMatrixGetとProjectionMatrixGetを使用してビュー行列と射影行列を取得し、DXMatrixMultiplyによってそれらを乗算してワールド座標からスクリーン座標への変換行列を作成します。その後、ColorToARGBを使用して曲線色を準備します。理論曲線の連続する各ポイントをループ処理し、X座標とY座標を3D空間に収まるようにスケーリングします。次に、z=0の位置にDXVector4ポイントを作成します。作成したポイントをDXVec4Transformで変換し、w値が正であることを確認して表示可能かを判定します。その後、DXVec4Scaleで座標をw値によって正規化します。次に、Canvasサイズを基準にしてスクリーン座標へ変換し、整数座標へ変換します。さらに、clipLineToHeaderを使用してヘッダー領域にラインが描画されないようにクリッピングします。最後に、curveLineWidthで指定された太さに合わせて幅方向のループ処理を行い、 LineAAを使用してアンチエイリアス付きラインを描画します。
この投影手法は、3Dレンダリングと2Dオーバーレイを橋渡しする重要な技術です。ワールド座標を複合行列によって変換することで、Canvas上では平面的なラインとして描画しながら、奥行きを持った表示をシミュレートできます。その結果、曲線は3D空間内でバーの位置関係に合わせて浮かんでいるように見えます。これにより、複雑な3Dスプライン補間を実装することなく、ヒストグラムバーとの視覚的な関連性を高めることができます。ヘッダー上への描画を防ぐため、ヘッダー境界に対する単純なラインクリッピング処理としてclipLineToHeader関数を実装します。まず、2つのY座標が両方ともHEADER_BAR_HEIGHTより上にある場合は描画対象外として拒否します。逆に、両方とも下側にある場合はそのまま許可します。それ以外の場合は、境界となるY座標でX座標を補間して、ヘッダー領域にはみ出しているポイントをクリップします。その後、参照渡しされた座標を更新し、3Dビュー内で2D要素が正しく統合されるようにします。ここまでで3Dの初期化処理へ進む準備が整いました。次に、3D可視化を作成するためのロジックを定義します。
3Dコンテキストの作成と初期化
ここまでで個別の描画関数やカメラ制御関数がすべて定義できました。次は、それらを結び付ける全体的な処理を実装する必要があります。具体的には、Canvasの作成、DirectXコンテキストの設定、3Dオブジェクトの構築、分布データの読み込み、そして最初のレンダリング処理の実行を行います。これらの関数は、ツールの起動シーケンスを支える中心的な役割を持ちます。それぞれの処理には明確な責任があります。Canvas作成では、描画対象となる領域を準備します。コンテキスト初期化では、ライティングや射影設定を構成します。オブジェクト作成では、3Dシーン内に必要な要素を配置します。データ読み込みでは、シミュレーションされた二項分布サンプルを使用してヒストグラムを生成します。この統合処理が存在しなければ、これまで定義してきた個々の関数は正しい順序で実行されず、ビジュアライザー全体が動作することはありません。
//+------------------------------------------------------------------+
//| Dispatch rendering to the active 2D or 3D pipeline               |
//+------------------------------------------------------------------+
void renderVisualization()
  {
   //--- Render using the 2D canvas pipeline
   if(m_currentViewMode == VIEW_2D_MODE)
      render2DVisualization();
   else
      //--- Render using the 3D DirectX pipeline
      render3DVisualization();
  }
//+------------------------------------------------------------------+
//| Render the 3D scene and overlay 2D UI elements on top            |
//+------------------------------------------------------------------+
void render3DVisualization()
  {
   //--- Abort if data has not been loaded
   if(!m_isDataLoaded) return;

   //--- Recompute the view and light transforms for this frame
   updateCameraPosition();
   //--- Reposition all 3D histogram bars to match current data
   update3DHistogramBars();

   //--- Use the configured background colour for the clear pass
   color bgColor     = backgroundTopColor;
   uint  bgColorArgb = ColorToARGB(bgColor, 255);
   //--- Clear colour and depth buffers, then render the 3D scene
   m_mainCanvas.Render(DX_CLEAR_COLOR | DX_CLEAR_DEPTH, bgColorArgb);

   //--- Overlay the 2D border frame on top of the 3D render
   if(showBorderFrame)
      draw3DBorder();

   //--- Overlay the header bar on the rendered 3D image
   drawHeaderBarOn3D();
   //--- Overlay the stats panel and legend if enabled
   if(showStatistics)
     {
      drawStatisticsPanelOn3D();
      drawLegendOn3D();
     }
   //--- Project and draw the theoretical PMF curve into screen space
   draw3DTheoreticalCurve();

   //--- Draw the resize grip indicator when hovering
   if(m_isHoveringResizeZone && enableResizing)
      drawResizeIndicatorOn3D();

   //--- Flush the pixel buffer to the chart object
   m_mainCanvas.Update();
  }
//+------------------------------------------------------------------+
//| Create bitmap label, initialise 3D context and scene objects     |
//+------------------------------------------------------------------+
bool createCanvasAndObjects()
  {
   //--- Create the canvas bitmap label on the chart
   if(!m_mainCanvas.CreateBitmapLabel(m_canvasObjectName, 0, 0, m_currentWidth, m_currentHeight,
                                      COLOR_FORMAT_ARGB_NORMALIZE))
     {
      Print("ERROR: Failed to create canvas");
      return false;
     }

   //--- Position the canvas horizontally
   ObjectSetInteger(0, m_canvasObjectName, OBJPROP_XDISTANCE, m_currentPositionX);
   //--- Position the canvas vertically
   ObjectSetInteger(0, m_canvasObjectName, OBJPROP_YDISTANCE, m_currentPositionY);

   //--- Initialise the DirectX 3D rendering context
   if(!initialize3DContext())
     {
      Print("ERROR: Failed to initialize 3D context");
      return false;
     }

   //--- Build all 3D scene objects (bars, ground, axes)
   if(!create3DObjects())
     {
      Print("ERROR: Failed to create 3D objects");
      return false;
     }

   return true;
  }

//+------------------------------------------------------------------+
//| Set up projection, lighting and initial camera for 3D rendering  |
//+------------------------------------------------------------------+
bool initialize3DContext()
  {
   //--- Set perspective projection matrix with 30-degree FOV
   m_mainCanvas.ProjectionMatrixSet((float)(DX_PI / 6.0),
                                    (float)m_currentWidth / (float)m_currentHeight,
                                    0.1f, 1000.0f);

   //--- Point the camera at the scene origin
   m_mainCanvas.ViewTargetSet(DXVector3(0.0f, 0.0f, 0.0f));
   //--- Define world up direction as positive Y
   m_mainCanvas.ViewUpDirectionSet(DXVector3(0.0f, 1.0f, 0.0f));

   //--- Set directional light colour to near-white
   m_mainCanvas.LightColorSet(DXColor(1.0f, 1.0f, 1.0f, 0.9f));
   //--- Set ambient light colour for soft fill
   m_mainCanvas.AmbientColorSet(DXColor(0.6f, 0.6f, 0.6f, 0.5f));

   //--- Auto-fit camera if enabled and data is ready
   if(autoFitCamera && m_isDataLoaded)
      autoFitCameraPosition();

   //--- Recompute and apply the camera transform
   updateCameraPosition();

   Print("SUCCESS: 3D context initialized");
   return true;
  }
//+------------------------------------------------------------------+
//| Build all 3D scene objects: bars, ground plane, and axes         |
//+------------------------------------------------------------------+
bool create3DObjects()
  {
   //--- Create the histogram bar boxes
   if(!create3DHistogramBars())
     {
      Print("ERROR: Failed to create 3D histogram bars");
      return false;
     }

   //--- Create the flat ground reference plane
   if(!createGroundPlane())
     {
      Print("ERROR: Failed to create ground plane");
      return false;
     }

   //--- Create coordinate axes only when the option is enabled
   if(show3DAxes && !create3DAxes())
     {
      Print("ERROR: Failed to create 3D axes");
      return false;
     }

   //--- Flag that all 3D objects are ready
   m_are3DObjectsCreated = true;
   Print("SUCCESS: 3D objects created");
   return true;
  }

//+------------------------------------------------------------------+
//| Prepare the scene for 3D rendering after a mode switch           |
//+------------------------------------------------------------------+
bool setup3DMode()
  {
   //--- If objects already exist, simply refresh the camera
   if(m_are3DObjectsCreated)
     {
      //--- Auto-fit camera when enabled and data is available
      if(autoFitCamera && m_isDataLoaded)
         autoFitCameraPosition();

      //--- Apply updated camera transform
      updateCameraPosition();
      return true;
     }

   //--- Warn if this path is reached unexpectedly
   Print("WARNING: 3D objects not created - this shouldn't happen!");
   //--- Attempt to create objects as a fallback
   return create3DObjects();
  }

//+------------------------------------------------------------------+
//| Generate binomial sample, compute histogram and statistics       |
//+------------------------------------------------------------------+
bool loadDistributionData()
  {
   //--- Seed the random number generator with current tick count
   MathSrand(GetTickCount());

   //--- Allocate the sample data buffer
   ArrayResize(m_sampleData, sampleSize);
   //--- Fill the buffer with random binomial variates
   MathRandomBinomial(numTrials, successProbability, sampleSize, m_sampleData);

   //--- Compute the frequency histogram from the sample
   if(!computeHistogram(m_sampleData, m_histogramIntervals, m_histogramFrequencies,
                        m_maxDataValue, m_minDataValue, histogramCells))
     {
      Print("ERROR: Failed to calculate histogram");
      return false;
     }

   //--- Allocate arrays for the theoretical PMF curve
   ArrayResize(m_theoreticalXValues, numTrials + 1);
   ArrayResize(m_theoreticalYValues, numTrials + 1);
   //--- Fill X values as integer sequence 0 .. numTrials
   MathSequence(0, numTrials, 1, m_theoreticalXValues);
   //--- Compute binomial PMF for each X value
   MathProbabilityDensityBinomial(m_theoreticalXValues, numTrials, successProbability,
                                  false, m_theoreticalYValues);

   //--- Find the tallest histogram bin
   m_maxFrequency = m_histogramFrequencies[ArrayMaximum(m_histogramFrequencies)];
   //--- Find the peak theoretical PMF value
   m_maxTheoreticalValue = m_theoreticalYValues[ArrayMaximum(m_theoreticalYValues)];

   //--- Compute scaling factor to align histogram with PMF curve
   double scaleFactor = m_maxFrequency / m_maxTheoreticalValue;
   //--- Scale every bin frequency so it matches PMF units
   for(int i = 0; i < histogramCells; i++)
      m_histogramFrequencies[i] /= scaleFactor;

   //--- Compute all descriptive statistics
   computeAdvancedStatistics();

   //--- Mark data as successfully loaded
   m_isDataLoaded = true;

   //--- Update 3D bar heights if the scene is already built
   if(m_currentViewMode == VIEW_3D_MODE && m_are3DObjectsCreated)
     {
      //--- Refit camera to new data extents
      if(autoFitCamera)
         autoFitCameraPosition();
      //--- Reposition every bar in 3D space
      update3DHistogramBars();
     }

   Print("SUCCESS: Loaded distribution data");
   return true;
  }
まず、現在の表示モードに応じて描画処理を制御するrenderVisualization関数を定義します。この関数では、m_currentViewModeを確認し、VIEW_2D_MODEの場合はrender2DVisualizationを呼び出し、それ以外の場合はrender3DVisualizationを呼び出します。これにより、2D表示と3D表示の両方に対する描画処理を一元管理できます。2D表示については、以前のバージョンで実装したロジックと同じであるため、今回は大きな変更は行いません。3D表示については、render3DVisualization関数を実装します。まず、データが存在しない場合は早期に処理を終了します。次に、カメラ位置とヒストグラムバーの状態を更新します。その後、backgroundTopColorからARGB形式へ変換した背景色を設定します。Renderを使用してシーンをクリアします。この際、DX_CLEAR_COLOR | DX_CLEAR_DEPTHフラグを指定し、カラー情報と深度バッファの両方を初期化します。showBorderFrameが有効な場合はdraw3DBorderを呼び出して枠線を描画します。続いてdrawHeaderBarOn3Dを使用してヘッダーを追加します。最後にUpdateを呼び出して、完成した3Dコンテンツを画面へ表示します。Canvasを準備するためcreateCanvasAndObject関数を作成します。この関数では、まずm_mainCanvaに対して正規化されたARGBフォーマットでCreateBitmapLabelを呼び出します。続いて、 ObjectSetIntegerを使用してOBJPROP_XDISTANCEおよびOBJPROP_YDISTANCEを設定し、オブジェクトの表示位置を指定します。その後、initialize3DContextとcreate3DObjectsを順番に呼び出します。いずれかの処理が失敗した場合は、エラーメッセージを出力してfalseを返します。
次に、3D環境を構成するinitialize3DContext関数を定義します。まず、ProjectionMatrixSetを使用して射影行列を設定します。この際、視野角は30度に設定し、アスペクト比にはCanvasサイズから計算した値を使用します。また、近距離クリッピング面と遠距離クリッピング面も指定します。次に、ViewTargetSetとViewUpDirectionSetを使用して、ビューのターゲット位置と上方向ベクトルを設定します。どちらも原点を基準として構成します。その後、LightColorSetとAmbientColorSetを使用してライトカラーと環境光カラーを適用します。自動カメラ調整が有効で、かつデータがロード済みの場合は、autoFitCameraPositionを呼び出してカメラ位置を自動調整します。続いてupdateCameraPositionを実行して現在のカメラ位置を反映し、最後に初期化成功メッセージを出力します。
次に、create3DObjectsは、create3DHistogramBars、createGroundPlaneを順番に呼び出し、さらにshow3DAxesがtrueの場合は条件付きでcreate3DAxesを呼び出すことで、3D要素の生成全体を統括します。すべての処理が成功すると、m_are3DObjectsCreated をtrueに設定し、成功メッセージを出力してtrueを返します。一方、途中でいずれかの処理が失敗した場合は、その時点でfalseを返します。モード切り替え時の処理として、setup3DMode関数を実装します。まず、3Dオブジェクトがすでに作成済みか確認します。作成済みの場合はautoFitCameraPositionを呼び出してカメラを自動調整し、updateCameraPositionで位置を更新します。まだ作成されていない場合は警告を出力し、create3DObjectsを呼び出してオブジェクト生成を試みます。最後に、分布データを準備するloadDistributionData関数を定義します。まず、GetTickCountを使用してMathSrandで乱数シードを設定します。次に、m_sampleData配列のサイズを変更し、MathRandomBinomialを使用して二項分布サンプルを生成します。その後、computeHistogramを使用してヒストグラムを計算します。さらに、MathSequenceを使用して理論値用の配列を設定し、MathProbabilityDensityBinomialによって二項分布の確率質量関数(PMF)を計算します。ArrayMaximumを使用して最大値を取得し、理論値の最大値に合わせて頻度値をスケーリングします。続いて統計情報を計算し、m_isDataLoadedをtrueに設定します。もし現在の表示モードがVIEW_3D_MODEであり、かつ3Dオブジェクトが作成済みの場合は、autoFitCameraPositionを呼び出してカメラを再調整し、update3DHistogramBarsによってバー位置を更新します。最後に、データ読み込み成功メッセージを出力します。この初期化処理を実行するため、初期化イベントハンドラ内で以下のように関数を呼び出します。
初期化イベントハンドラの接続
すべてのクラスロジックが定義できたため、次はプログラムのエントリーポイントへ接続する必要があります。OnInitイベントハンドラでは、ビジュアライザーのインスタンスを作成し、Canvasと3Dオブジェクトを初期化し、分布データを読み込み、最初の描画処理を実行します。この段階でいずれかの処理が失敗した場合は、インスタンスを安全に削除し、初期化失敗コードを返します。これにより、不完全な状態のままプログラムが実行されることを防ぎ、安定した起動処理を実現します。
//+------------------------------------------------------------------+
//| Global Variables                                                 |
//+------------------------------------------------------------------+
DistributionVisualizer *distributionVisualizer = NULL; // Pointer to the active visualizer instance

//+------------------------------------------------------------------+
//| Initialise the EA, create the canvas and load distribution data  |
//+------------------------------------------------------------------+
int OnInit()
  {
   //--- Enable mouse movement events on the chart
   ChartSetInteger(0, CHART_EVENT_MOUSE_MOVE,  true);
   //--- Enable mouse wheel events on the chart
   ChartSetInteger(0, CHART_EVENT_MOUSE_WHEEL, true);

   //--- Allocate and construct the visualizer object
   distributionVisualizer = new DistributionVisualizer();
   if(distributionVisualizer == NULL)
     {
      Print("ERROR: Failed to create window object");
      return INIT_FAILED;
     }

   //--- Create the canvas bitmap label and initialise the 3D scene
   if(!distributionVisualizer.createCanvasAndObjects())
     {
      Print("ERROR: Failed to create canvas");
      delete distributionVisualizer;
      distributionVisualizer = NULL;
      return INIT_FAILED;
     }

   //--- Generate the binomial sample and compute all statistics
   if(!distributionVisualizer.loadDistributionData())
     {
      Print("ERROR: Failed to load distribution data");
      delete distributionVisualizer;
      distributionVisualizer = NULL;
      return INIT_FAILED;
     }

   //--- Render the initial frame
   distributionVisualizer.renderVisualization();
   ChartRedraw();

   Print("SUCCESS: Distribution window initialized");
   return INIT_SUCCEEDED;
  }
まず、プログラム全体でツールのインスタンスを管理するために、DistributionVisualizerクラスへのグローバルポインタdistributionVisualizerを宣言します。初期値はNULLに設定します。OnInitイベントハンドラでは、操作対応のためにマウスイベントを有効化します。ChartSetIntegerを使用してCHART_EVENT_MOUSE_MOVEとCHART_EVENT_MOUSE_WHEELをtrueに設定します。次に、newを使用してビジュアライザーのインスタンスを生成します。生成結果がNULLか確認し、失敗した場合はエラーを出力してINIT_FAILEDを返します。続いて、createCanvasAndObjectsを呼び出してCanvasと3D要素を準備します。この処理が失敗した場合は、作成済みのインスタンスを削除し、初期化失敗として終了します。その後、loadDistributionDataを使用してデータを読み込みます。ここでもエラーが発生した場合は、同様にクリーンアップ処理を行って失敗を返します。最後に、renderVisualizationを呼び出してビジュアルを描画し、ChartRedrawでチャートを再描画します。成功メッセージを出力した後、INIT_SUCCEEDEDを返して初期化が正常に完了したことを示します。コンパイルすると、次の結果が得られます。

次に、統計情報と凡例パネルを追加する必要があります。そのためのロジックを以下に実装します。
3Dモードでの統計パネル、凡例、サイズ変更インジケータの描画
統計パネルと凡例は、すでに2Dバージョンで実装されています。これらは分析面で重要な役割を持ち、平均値、標準偏差、信頼区間などの主要な統計指標や、ヒストグラムと理論曲線を読み取るための凡例をユーザーへ提供します。3Dモードでは、これらの要素を維持する必要があります。そのため、各レンダリング処理の後に、3Dシーン上へ重ねて描画する2Dオーバーレイとして実装します。同様に、サイズ変更インジケータも現在の表示モードに関係なく、ユーザーがサイズ変更領域上にカーソルを移動した際には表示される必要があります。この処理ブロックでは、これらのオーバーレイ要素を3Dレンダリングパイプラインへ統合します。
//+------------------------------------------------------------------+
//| Draw the statistics panel overlay on the 3D render               |
//+------------------------------------------------------------------+
void drawStatisticsPanelOn3D()
  {
   //--- Reuse the same 2D statistics panel for the 3D overlay
   drawStatisticsPanel();
  }
//+------------------------------------------------------------------+
//| Draw the legend panel overlay on the 3D render                   |
//+------------------------------------------------------------------+
void drawLegendOn3D()
  {
   //--- Compute legend panel absolute position (same layout as 2D)
   int legendX          = statsPanelX;
   int legendY          = HEADER_BAR_HEIGHT + statsPanelY + statsPanelHeight;
   int legendWidth      = statsPanelWidth;
   int legendHeightThis = legendHeight;

   //--- Compute legend background colour as a very light theme tint
   color legendBgColor = LightenColor(themeColor, 0.9);
   uchar bgAlpha       = 153;
   uint  argbLegendBg  = ColorToARGB(legendBgColor, bgAlpha);
   uint  argbBorder    = ColorToARGB(themeColor, 255);
   uint  argbText      = ColorToARGB(clrBlack, 255);

   //--- Flood-fill the legend background with alpha blending
   for(int y = legendY; y <= legendY + legendHeightThis; y++)
      for(int x = legendX; x <= legendX + legendWidth; x++)
         blendPixelSet(m_mainCanvas, x, y, argbLegendBg);

   //--- Draw all four border lines of the legend panel
   for(int x = legendX; x <= legendX + legendWidth; x++)
      blendPixelSet(m_mainCanvas, x, legendY, argbBorder); // Top border
   for(int y = legendY; y <= legendY + legendHeightThis; y++)
      blendPixelSet(m_mainCanvas, legendX + legendWidth, y, argbBorder); // Right border
   for(int x = legendX; x <= legendX + legendWidth; x++)
      blendPixelSet(m_mainCanvas, x, legendY + legendHeightThis, argbBorder); // Bottom border
   for(int y = legendY; y <= legendY + legendHeightThis; y++)
      blendPixelSet(m_mainCanvas, legendX, y, argbBorder); // Left border

   //--- Set the legend text font
   m_mainCanvas.FontSet("Arial", panelFontSize);

   //--- Initialise vertical text cursor inside the legend
   int itemY      = legendY + 10;
   int lineSpacing = panelFontSize;

   //--- Draw 3D histogram colour swatch and its label
   uint argbHist = ColorToARGB(histogramColor, 255);
   m_mainCanvas.FillRectangle(legendX + 7, itemY - 4, legendX + 22, itemY + 4, argbHist);
   m_mainCanvas.TextOut(legendX + 27, itemY - 4, "3D Histogram", argbText, TA_LEFT);
   itemY += lineSpacing;

   //--- Draw a short horizontal line as the curve colour swatch
   uint argbCurve = ColorToARGB(theoreticalCurveColor, 255);
   for(int i = 0; i < 15; i++)
     {
      blendPixelSet(m_mainCanvas, legendX + 7 + i, itemY,     argbCurve); // Upper swatch pixel row
      blendPixelSet(m_mainCanvas, legendX + 7 + i, itemY + 1, argbCurve); // Lower swatch pixel row
     }
   //--- Draw the PMF curve label beside the swatch
   m_mainCanvas.TextOut(legendX + 27, itemY - 4, "Theoretical PMF", argbText, TA_LEFT);
  }
//+------------------------------------------------------------------+
//| Draw resize grip indicators overlaid on the 3D render            |
//+------------------------------------------------------------------+
void drawResizeIndicatorOn3D()
  {
   //--- Reuse the same 2D resize indicator for the 3D overlay
   drawResizeIndicator();
  }

//--- Call these in the 3D visual function

if(showStatistics)
  {
   drawStatisticsPanelOn3D();
   drawLegendOn3D();
  }
//--- Project and draw the theoretical PMF curve into screen space
draw3DTheoreticalCurve();

//--- Draw the resize grip indicator when hovering
if(m_isHoveringResizeZone && enableResizing)
   drawResizeIndicatorOn3D();
ここでは、3Dモードで統計情報を描画するdrawStatisticsPanelOn3D関数を定義します。この関数では、単純にdrawStatisticsPanelを呼び出し、2D用のロジックを再利用することで、オーバーレイ表示の一貫性を維持します。3D用の凡例については、2D版と同様のdrawLegendOn3D関数を実装しますが、「3D Histogram」というラベルを使用します。入力値から位置を設定し、LightenColorを使用してthemeColorを明るくした背景色を作成します。次に、ColorToARGBを使用してアルファ値を含むARGBカラーを準備します。fillと枠線のためにblendPixelSetを使用してピクセルのブレンド処理をループで実行します。その後、FontSetでフォントを設定し、FillRectangleを使用してヒストグラムのサンプル矩形を描画し、TextOutでラベルを描画します。続いて、曲線サンプルラインをブレンドしてそのラベルを追加し、3D表示に適応した視覚的な凡例を提供します。3D表示でサイズ変更領域を示すために、drawResizeIndicatorOn3Dを作成します。この関数ではdrawResizeIndicatorを呼び出し、2D表示と同じフィードバックを維持します。
3Dレンダリングフローでは、showStatisticsがtrueの場合、drawStatisticsPanelOn3DとdrawLegendOn3Dを呼び出して情報パネルをオーバーレイ表示します。確率的なオーバーレイとしてdraw3DTheoreticalCurveで曲線を描画します。また、サイズ変更が有効で、かつサイズ変更領域上にホバーしている場合は、drawResizeIndicatorOn3Dを追加します。これにより、3Dレンダリング後に2D要素を統合したハイブリッド表示を実現します。コンパイルすると、次のようになります。

パネルが完成したので、次にチャート操作を処理する必要があります。
マウス操作と表示モード切り替えの処理
3D可視化は、インタラクティブ性があって初めて有用になります。ユーザーは、異なる角度からバーを確認するためにシーンを回転できる必要があります。また、分布の特定の領域に注目するためにズームイン・ズームアウトできる必要があります。さらに、Canvasをドラッグしてチャート上で位置を変更したり、表示領域を調整するためにサイズ変更したり、1回のクリックで2Dモードと3Dモードを切り替えたりできる必要があります。これらすべての操作はマウスイベントを通じて実行されます。そして、それぞれの操作は競合を避けるために慎重に処理する必要があります。例えば、3Dシーンを回転するためのドラッグ操作は、同時にチャートのスクロールを発生させてはいけません。また、切り替えアイコンのクリックは、同時にドラッグ操作を開始してはいけません。このブロックでは、ツールを完全に応答性のあるものにするために必要なすべてのインタラクションロジックを定義します。
//+------------------------------------------------------------------+
//| Process mouse move and button events for interaction             |
//+------------------------------------------------------------------+
void handleMouseEvent(int mouseX, int mouseY, int mouseState)
  {
   //--- Snapshot previous hover states to detect changes
   bool previousHoverState       = m_isHoveringCanvas;
   bool previousHeaderHoverState = m_isHoveringHeader;
   bool previousResizeHoverState = m_isHoveringResizeZone;
   bool previousSwitchHoverState = m_isHoveringSwitchIcon;

   //--- Update canvas hover flag based on cursor position
   m_isHoveringCanvas = (mouseX >= m_currentPositionX &&
                         mouseX <= m_currentPositionX + m_currentWidth &&
                         mouseY >= m_currentPositionY &&
                         mouseY <= m_currentPositionY + m_currentHeight);

   //--- Update individual zone hover flags
   m_isHoveringHeader      = isMouseOverHeaderBar(mouseX, mouseY);
   m_isHoveringSwitchIcon  = isMouseOverSwitchIcon(mouseX, mouseY);
   m_isHoveringResizeZone  = isMouseInResizeZone(mouseX, mouseY, m_hoverResizeMode);

   //--- Determine if a redraw is needed due to hover state changes
   bool needRedraw = (previousHoverState       != m_isHoveringCanvas  ||
                      previousHeaderHoverState != m_isHoveringHeader  ||
                      previousResizeHoverState != m_isHoveringResizeZone ||
                      previousSwitchHoverState != m_isHoveringSwitchIcon);

   //--- Handle 3D orbit drag when in 3D mode and not over the header
   if(m_currentViewMode == VIEW_3D_MODE && m_isHoveringCanvas && !m_isHoveringHeader)
     {
      //--- Begin rotation on fresh left-button press
      if(mouseState == 1 && m_previousMouseButtonState == 0)
        {
         m_isRotating3D  = true;
         m_mouse3DStartX = mouseX;
         m_mouse3DStartY = mouseY;
         //--- Prevent chart from consuming mouse scroll during rotation
         ChartSetInteger(0, CHART_MOUSE_SCROLL, false);
        }
      //--- Continue rotation while button is held and dragging
      else if(mouseState == 1 && m_previousMouseButtonState == 1 && m_isRotating3D)
        {
         //--- Update azimuth angle proportional to horizontal mouse delta
         m_cameraAngleY += (mouseX - m_mouse3DStartX) / 300.0;
         //--- Update elevation angle proportional to vertical mouse delta
         m_cameraAngleX += (mouseY - m_mouse3DStartY) / 300.0;

         //--- Clamp elevation to avoid gimbal lock at poles
         if(m_cameraAngleX < -DX_PI * 0.49) m_cameraAngleX = -DX_PI * 0.49;
         if(m_cameraAngleX >  DX_PI * 0.49) m_cameraAngleX =  DX_PI * 0.49;

         //--- Update rotation anchor for the next delta computation
         m_mouse3DStartX = mouseX;
         m_mouse3DStartY = mouseY;
         needRedraw = true;
        }
      //--- End rotation on button release
      else if(mouseState == 0 && m_previousMouseButtonState == 1)
        {
         m_isRotating3D = false;
         //--- Restore chart scroll on release
         ChartSetInteger(0, CHART_MOUSE_SCROLL, true);
        }
     }

   //--- Handle button-press interactions
   if(mouseState == 1 && m_previousMouseButtonState == 0)
     {
      //--- Switch view mode when the icon is clicked
      if(m_isHoveringSwitchIcon)
        {
         switchViewMode();
         m_previousMouseButtonState = mouseState;
         return;
        }
      //--- Begin canvas drag when clicking the header (not a resize zone)
      else if(enableDragging && m_isHoveringHeader && !m_isHoveringResizeZone)
        {
         m_isDragging   = true;
         m_dragStartX   = mouseX;
         m_dragStartY   = mouseY;
         m_canvasStartX = m_currentPositionX;
         m_canvasStartY = m_currentPositionY;
         ChartSetInteger(0, CHART_MOUSE_SCROLL, false);
         needRedraw = true;
        }
      //--- Begin canvas resize when clicking a resize grip zone
      else if(m_isHoveringResizeZone)
        {
         m_isResizing          = true;
         m_activeResizeMode    = m_hoverResizeMode;
         m_resizeStartX        = mouseX;
         m_resizeStartY        = mouseY;
         m_resizeInitialWidth  = m_currentWidth;
         m_resizeInitialHeight = m_currentHeight;
         ChartSetInteger(0, CHART_MOUSE_SCROLL, false);
         needRedraw = true;
        }
     }
   //--- Continue drag or resize while button stays pressed
   else if(mouseState == 1 && m_previousMouseButtonState == 1)
     {
      if(m_isDragging)
         handleCanvasDrag(mouseX, mouseY);
      else if(m_isResizing)
         handleCanvasResize(mouseX, mouseY);
     }
   //--- End drag or resize on button release
   else if(mouseState == 0 && m_previousMouseButtonState == 1)
     {
      if(m_isDragging || m_isResizing)
        {
         m_isDragging       = false;
         m_isResizing       = false;
         m_activeResizeMode = NO_RESIZE;
         ChartSetInteger(0, CHART_MOUSE_SCROLL, true);
         needRedraw = true;
        }
     }

   //--- Redraw the visualization if any state changed
   if(needRedraw)
     {
      renderVisualization();
      ChartRedraw();
     }

   //--- Record current mouse position for next event
   m_lastMouseX = mouseX;
   m_lastMouseY = mouseY;
   //--- Record current button state for next event
   m_previousMouseButtonState = mouseState;
  }

//+------------------------------------------------------------------+
//| Handle mouse wheel zoom for the 3D scene                         |
//+------------------------------------------------------------------+
void handleMouseWheel(int mouseX, int mouseY, double delta)
  {
   //--- Determine if the wheel event occurred over the 3D canvas body
   bool isOverCanvas = (mouseX >= m_currentPositionX &&
                        mouseX <= m_currentPositionX + m_currentWidth &&
                        mouseY >= m_currentPositionY + HEADER_BAR_HEIGHT &&
                        mouseY <= m_currentPositionY + m_currentHeight);

   //--- Apply zoom only in 3D mode and when cursor is over the canvas
   if(m_currentViewMode == VIEW_3D_MODE && isOverCanvas)
     {
      //--- Suppress chart scroll so wheel is captured by the visualizer
      ChartSetInteger(0, CHART_MOUSE_SCROLL, false);

      //--- Adjust camera distance by a small fraction of the wheel delta
      m_cameraDistance *= 1.0 - delta * 0.001;

      //--- Clamp distance to prevent clipping through the scene
      if(m_cameraDistance <  20.0) m_cameraDistance =  20.0;
      if(m_cameraDistance > 200.0) m_cameraDistance = 200.0;

      //--- Re-render with updated camera distance
      renderVisualization();
      ChartRedraw();
     }
   else
     {
      //--- Restore chart scroll when wheel is outside the canvas
      ChartSetInteger(0, CHART_MOUSE_SCROLL, true);
     }
  }

//+------------------------------------------------------------------+
//| Return true when the cursor is over the mode switch icon         |
//+------------------------------------------------------------------+
bool isMouseOverSwitchIcon(int mouseX, int mouseY)
  {
   //--- Compute the icon's left edge from the canvas right margin
   int iconX = m_currentPositionX + m_currentWidth - SWITCH_ICON_SIZE - SWITCH_ICON_MARGIN;
   //--- Vertically centre the icon within the header bar
   int iconY = m_currentPositionY + (HEADER_BAR_HEIGHT - SWITCH_ICON_SIZE) / 2;

   //--- Return true if the cursor falls within the icon bounding box
   return (mouseX >= iconX && mouseX <= iconX + SWITCH_ICON_SIZE &&
           mouseY >= iconY && mouseY <= iconY + SWITCH_ICON_SIZE);
  }

//+------------------------------------------------------------------+
//| Toggle between 2D and 3D view modes                              |
//+------------------------------------------------------------------+
void switchViewMode()
  {
   //--- Switch from 2D to 3D
   if(m_currentViewMode == VIEW_2D_MODE)
     {
      m_currentViewMode = VIEW_3D_MODE;
      Print("Switched to 3D mode");

      //--- Set up the 3D scene; revert to 2D on failure
      if(!setup3DMode())
        {
         Print("ERROR: Failed to setup 3D mode, reverting to 2D");
         m_currentViewMode = VIEW_2D_MODE;
        }
      else
        {
         //--- Auto-fit camera to the scene on mode entry
         if(autoFitCamera)
            autoFitCameraPosition();
        }
     }
   else
     {
      //--- Switch from 3D back to 2D
      m_currentViewMode = VIEW_2D_MODE;
      Print("Switched to 2D mode");
     }

   //--- Render the scene in the new mode immediately
   renderVisualization();
   ChartRedraw();
  }
handleMouseEvent関数を定義し、ビジュアライザー内のすべてのマウス操作を管理します。まず、以前のホバー状態を保存します。マウス位置をCanvasの範囲と比較してm_isHoveringCanvasを更新し、isMouseOverHeaderBarを使用してm_isHoveringHeaderを設定します。isMouseOverSwitchIconによってm_isHoveringSwitchIconを設定し、isMouseInResizeZoneを使用してm_isHoveringResizeZoneを設定します。
いずれかのホバー状態が変更された場合、再描画フラグを設定します。VIEW_3D_MODEで、Canvas上かつヘッダー上ではない場合、回転処理を行います。ボタン押下時には、m_isRotating3Dをtrueに設定し、開始位置を記録します。また、ChartSetIntegerを使用してCHART_MOUSE_SCROLLを無効化し、スクロールを停止します。ドラッグ中は、移動量を300.0でスケーリングし、その差分に基づいてm_cameraAngleYとm_cameraAngleXを調整します。反転を防ぐため、X角度を-0.49PIから0.49PIの範囲に制限します。その後、開始位置を更新し、再描画フラグを設定します。ボタンを離した場合は、回転状態をリセットし、スクロールを有効化します。次に、押下状態を確認します。スイッチアイコン上にある場合はswitchViewModeを呼び出し、状態を更新した後に処理を終了します。ヘッダー上でドラッグ可能かつサイズ変更ではない場合は、ドラッグ状態を有効化し、開始位置を記録してスクロールを無効化します。サイズ変更領域上にある場合は、サイズ変更を有効化し、モードを設定し、初期値を取得してスクロールを無効化します。その後、再描画フラグを設定します。ボタンが押された状態では、handleCanvasDragまたはhandleCanvasResizeを呼び出します。ボタンを離した場合は、フラグとモードをリセットし、スクロールを有効化して再描画フラグを設定します必要に応じてrenderVisualizationとChartRedrawを呼び出します。その後、最後のマウス位置と状態を更新します。
次に、3Dズーム処理を行うhandleMouseWheel関数を実装します。VIEW_3D_MODEで、マウスがヘッダーより下のプロット領域上にあるか確認します。条件を満たす場合はスクロールを無効化します。スムーズな調整を行うため、1.0からスケーリングしたデルタ値を引いた値を使用してm_cameraDistanceを乗算します。その後、値を20.0から200.0の範囲に制限し、再描画付きで再レンダリングします。条件を満たさない場合は、チャート操作を可能にするためスクロールを有効化します。
トグルボタン上のホバー状態を検出するため、isMouseOverSwitchIcon関数を作成します。現在のサイズと定数からアイコン座標を計算し、マウス位置が正方形の範囲内にある場合はtrueを返します。最後に、表示モードを切り替えるswitchViewMode関数を定義します。現在が2Dの場合は、VIEW_3D_MODEに設定します。切り替えメッセージを出力し、setup3DModeを実行します。失敗した場合は、元のモードへ戻し、エラーを出力します。成功した場合、必要に応じてカメラを自動調整します。現在が3Dの場合は、2Dへ切り替え、切り替えメッセージを出力します。その後、新しいモードをrenderVisualizationで描画し、ChartRedrawを呼び出して即座に更新します。これで、チャートイベントハンドラ内でこれらの関数を呼び出すことができます。
//+------------------------------------------------------------------+
//| Route chart mouse and wheel events to the visualizer             |
//+------------------------------------------------------------------+
void OnChartEvent(const int id, const long &lparam, const double &dparam, const string &sparam)
  {
   //--- Abort if the visualizer has not been initialised
   if(distributionVisualizer == NULL) return;

   //--- Handle mouse move and button events
   if(id == CHARTEVENT_MOUSE_MOVE)
     {
      int mouseX     = (int)lparam;                        // Horizontal cursor position in pixels
      int mouseY     = (int)dparam;                        // Vertical cursor position in pixels
      int mouseState = (int)StringToInteger(sparam);       // Bitmask of pressed mouse buttons

      distributionVisualizer.handleMouseEvent(mouseX, mouseY, mouseState);
     }

   //--- Handle mouse wheel scroll events
   if(id == CHARTEVENT_MOUSE_WHEEL)
     {
      //--- Unpack the cursor X from the low 16 bits of lparam
      int mouseX = (int)(short) lparam;
      //--- Unpack the cursor Y from the high 16 bits of lparam
      int mouseY = (int)(short)(lparam >> 16);

      distributionVisualizer.handleMouseWheel(mouseX, mouseY, dparam);
     }
  }
OnChartEventイベントハンドラでは、チャート操作を全体的に処理します。エラーを防ぐため、distributionVisualizerがNULLの場合は早期に処理を終了します。IDがCHARTEVENT_MOUSE_MOVEの場合、パラメータをキャストしてマウス座標と状態を取得し、その後、ビジュアライザーのインスタンス上でhandleMouseEventへ処理を委譲します。CHARTEVENT_MOUSE_WHEELの場合は、lparamのビットから調整されたマウス位置を取得し、deltaとともにhandleMouseWheelを呼び出します。これにより、3D表示でホイールによるズーム操作が可能になります。次に、以下と同じ形式を使用して、変更内容を反映させるために初期化解除イベントハンドラとティックイベントハンドラを更新します。
//+------------------------------------------------------------------+
//| Release all resources when the EA is removed                     |
//+------------------------------------------------------------------+
void OnDeinit(const int reason)
  {
   //--- Destroy the visualizer object if it still exists
   if(distributionVisualizer != NULL)
     {
      delete distributionVisualizer;
      distributionVisualizer = NULL;
     }

   //--- Redraw the chart to remove the canvas bitmap object
   ChartRedraw();
   Print("Distribution window deinitialized");
  }

//+------------------------------------------------------------------+
//| Reload distribution data on each new bar                         |
//+------------------------------------------------------------------+
void OnTick()
  {
   //--- Track the last processed bar open time across calls
   static datetime lastBarTimestamp = 0;
   //--- Read the current bar open time on the configured timeframe
   datetime currentBarTimestamp = iTime(_Symbol, chartTimeframe, 0);

   //--- Reload and redraw only when a new bar has formed
   if(currentBarTimestamp > lastBarTimestamp)
     {
      if(distributionVisualizer != NULL)
        {
         //--- Regenerate the binomial sample and statistics
         if(distributionVisualizer.loadDistributionData())
           {
            //--- Redraw the updated visualization
            distributionVisualizer.renderVisualization();
            ChartRedraw();
           }
        }
      //--- Update the bar timestamp to prevent repeated processing
      lastBarTimestamp = currentBarTimestamp;
     }
  }
OnDeinitイベントハンドラでは、distributionVisualizerがNULLではないか確認します。NULLではない場合、インスタンスを削除してリソースを解放し、ポインタをNULLに設定します。その後、ChartRedrawでチャートを再描画し、初期化解除メッセージを出力します。次に、OnTickイベントハンドラでは、static変数lastBarTimestampを使用して前回のバーの開始時刻を追跡します。また、iTimeを使用してsymbol、chartTimeframe、shift 0から現在のバーの開始時刻を取得します。新しいバーが検出された場合、ビジュアライザーが存在することを確認し、loadDistributionDataでデータを再読み込みします。成功した場合はrenderVisualizationによって再描画を行い、ChartRedrawでチャートを更新します。その後、タイムスタンプを更新します。完全なログサイクルは以下のようになります。

これで、3D可視化の実装は完了です。残る作業はシステムの動作検証であり、これは次のセクションで扱います。
バックテスト
テストを実施しました。以下はビジュアルを単一のGraphics Interchange Format (GIF)画像としてまとめたものです。
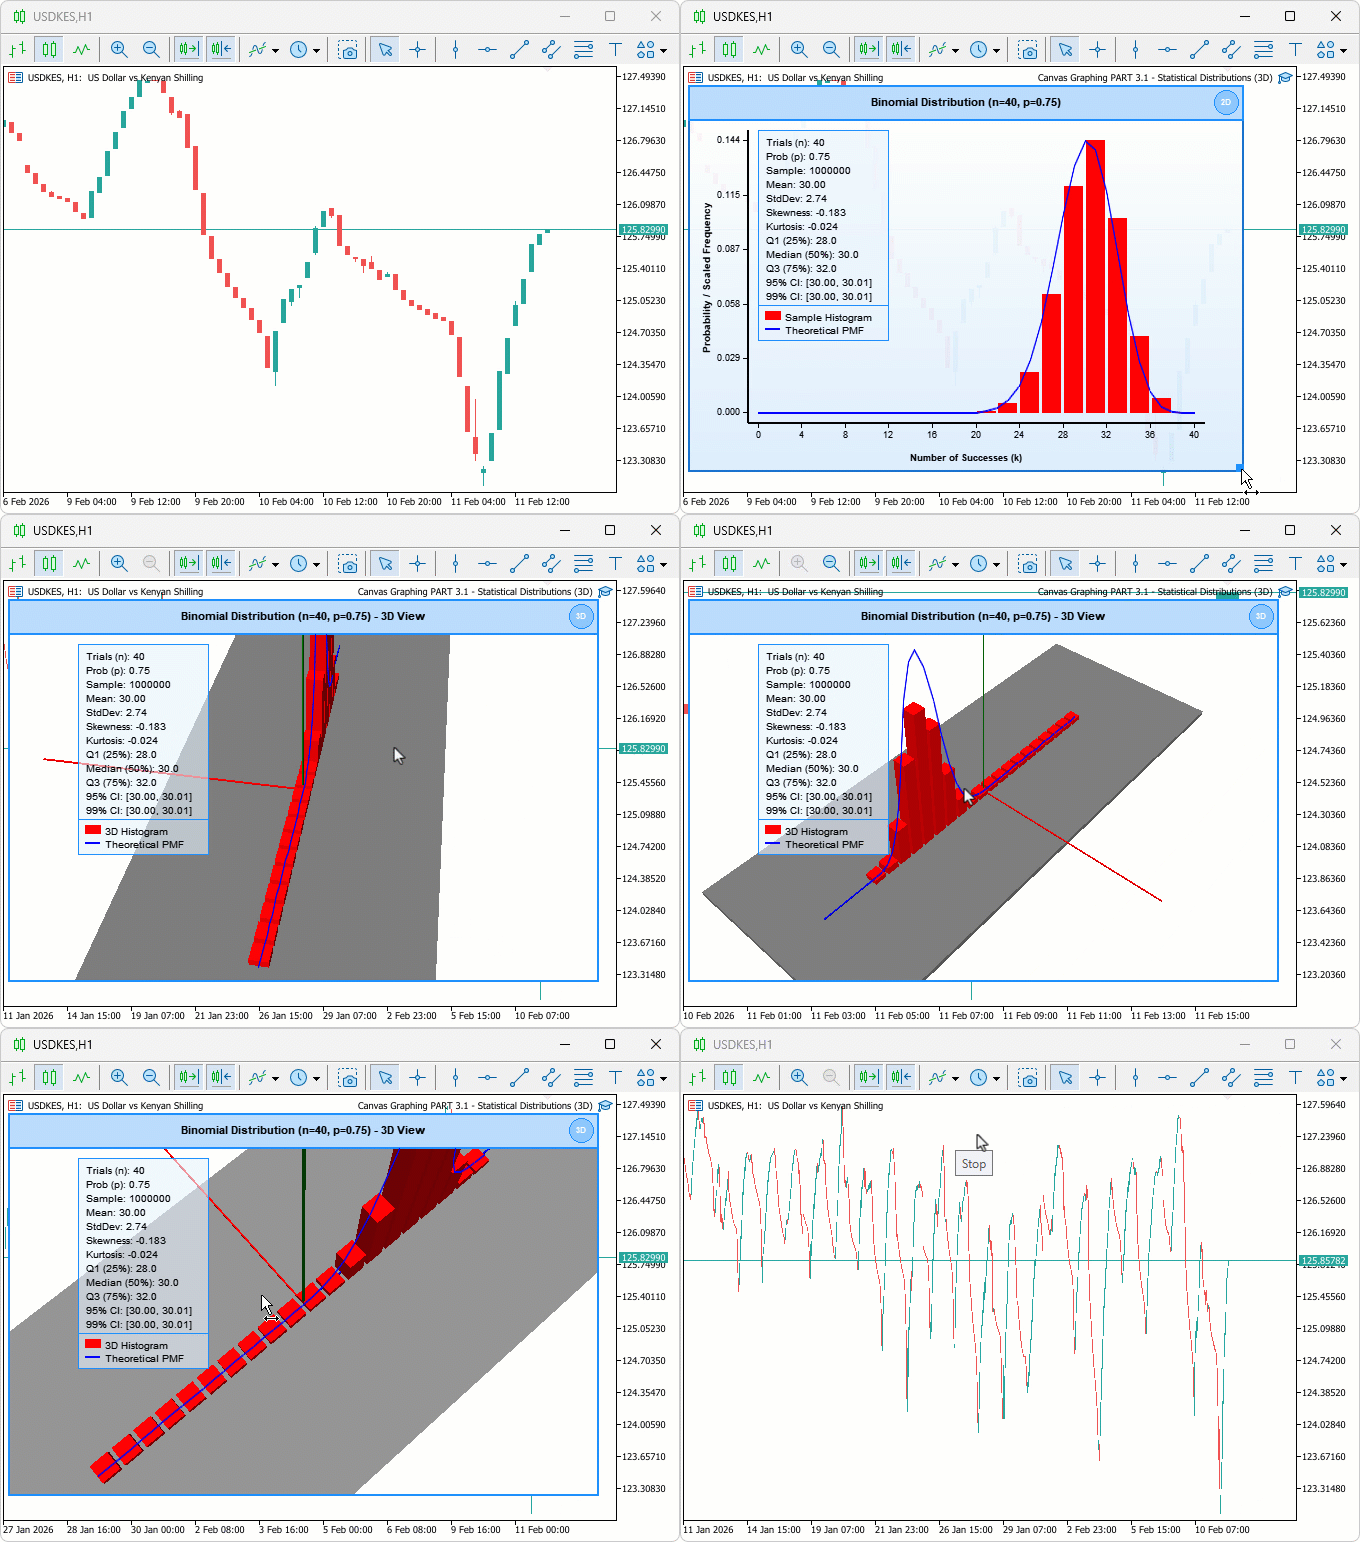
テスト中、ヒストグラムは試行回数の変動に関わらず3D空間内で適切にスケーリングされ、カメラの自動調整機能により読み込み時に常に棒グラフ全体が表示される位置に調整され、2Dと3Dの描画モードの切り替えもデータ損失やレイアウトの乱れなく行われました。
結論
本記事では、MQL5の二項分布ビューアにDirectX 3Dを統合し、2D表示と3D表示を切り替えられる機能に加え、回転・ズーム・自動フィットに対応したカメラ操作を実装しました。また、グラウンドプレーンと色分けされた座標軸を備えた3Dヒストグラムバーを描画し、理論PMF曲線を透視空間へ投影するとともに、統計情報パネル、凡例、カスタマイズ可能なテーマなどの2D要素も維持しました。さらに、クラスベースのアーキテクチャ、マウス操作、新規バー発生時のリアルタイム更新、および試行回数・成功確率・サンプルサイズ・表示設定などを変更できる入力パラメータについて、実装の詳細を解説しました。この記事を読み終えると、次のことができるようになります。
- チャートを再起動することなく、二項分布の2D表示と3D表示を切り替えられる
- 3Dヒストグラムを回転・ズームし、さまざまな角度から確率質量関数の形状や度数の違いを詳しく確認する
- 理論曲線を重ね合わせた3D可視化を利用して、シミュレーションによる標本分布と理論上の二項分布の確率をリアルタイムで比較する
次回以降の記事では、3Dビューをドラッグして移動できるパン操作の追加、2Dバー描画に対応する統計分布関数の拡張、さらに2D表示と3D表示をよりシームレスに切り替えられる仕組みについて解説していきます。次回の記事もぜひご期待ください。
MetaQuotes Ltdにより英語から翻訳されました。
元の記事: https://www.mql5.com/en/articles/21318
警告: これらの資料についてのすべての権利はMetaQuotes Ltd.が保有しています。これらの資料の全部または一部の複製や再プリントは禁じられています。
この記事はサイトのユーザーによって執筆されたものであり、著者の個人的な見解を反映しています。MetaQuotes Ltdは、提示された情報の正確性や、記載されているソリューション、戦略、または推奨事項の使用によって生じたいかなる結果についても責任を負いません。


 ラリー・ウィリアムズの『市場の秘密』(第14回):カスタムインジケータで隠れスマッシュデー反転を検出する
 エラー 146 (「トレードコンテキスト ビジー」) と、その対処方法
 PDアレイを使いこなす:PDアレイ内のインバランスを活用したトレードの最適化

- 無料取引アプリ
- 8千を超えるシグナルをコピー
- 金融ニュースで金融マーケットを探索