

MQL5取引ツール(第21回):回帰グラフにサイバーパンクテーマを追加する
 115
115
 0
0

はじめに
ペア分析のために標準的な回帰グラフを使用していると、長時間の分析では画面が単調に感じられ、相関関係やトレンドへの集中力を維持しにくくなることがあります。特に暗い環境では、画面の見づらさも相まって重要な変化を見逃してしまう可能性があります。また、一般的なグラフ表示には重要なデータポイントを強調したり、分析への集中を維持したりするための動的な演出がほとんどありません。そのため、ボラティリティの高い相場では、有益な情報を見落としてしまうことがあります。本記事は、グラフ描画ツールに没入感のあるテーマを追加し、より優れた可視化を実現したいMetaQuotes Language 5 (MQL5)開発者やアルゴリズムトレーダーを対象としています。
前回の記事(第20回)では、2つの銘柄間における統計的相関および線形回帰分析をおこなうための、MQL5によるCanvasベースのグラフ描画ツールを作成しました。本ツールには、ドラッグ操作やリサイズ機能を実装しています。第21回となる本記事では、このツールをさらに発展させ、ネオングロー、アニメーション、ホログラフィックな枠線などを備えたサイバーパンクテーマを追加します。テーマはボタン操作によって標準テーマとサイバーパンクテーマを切り替えられるデュアルテーマ構成となっており、星が瞬く動的な背景やネオン調の描画によって、より没入感のあるペア分析環境を実現します。本記事では以下のトピックを扱います。
記事を読み終える頃には、標準テーマとサイバーパンクテーマを自由に切り替えられる回帰グラフツールを作成できるようになっているでしょう。それでは始めましょう。
回帰グラフを強化するサイバーパンクテーマ
サイバーパンクテーマでは、ネオングロー、脈動するアニメーション、ホログラフィックな枠線、動的なグリッドなどを組み合わせることで、通常の回帰グラフを未来的で没入感のある表示へと変化させます。視覚的な演出を強化しながらも分析精度は維持されるため、デザイン性と実用性を両立したグラフ表示を実現できます。このテーマでは、色のブレンド、アルファ合成、タイマーによるアニメーションを利用して、発光する回帰線やデータポイント、星が瞬く背景、ガラス調(Glassmorphism)のパネルなどの演出を実装します。そのため、ナイトモードでのトレードや、より印象的な表示を好むユーザーに適したテーマとなっています。
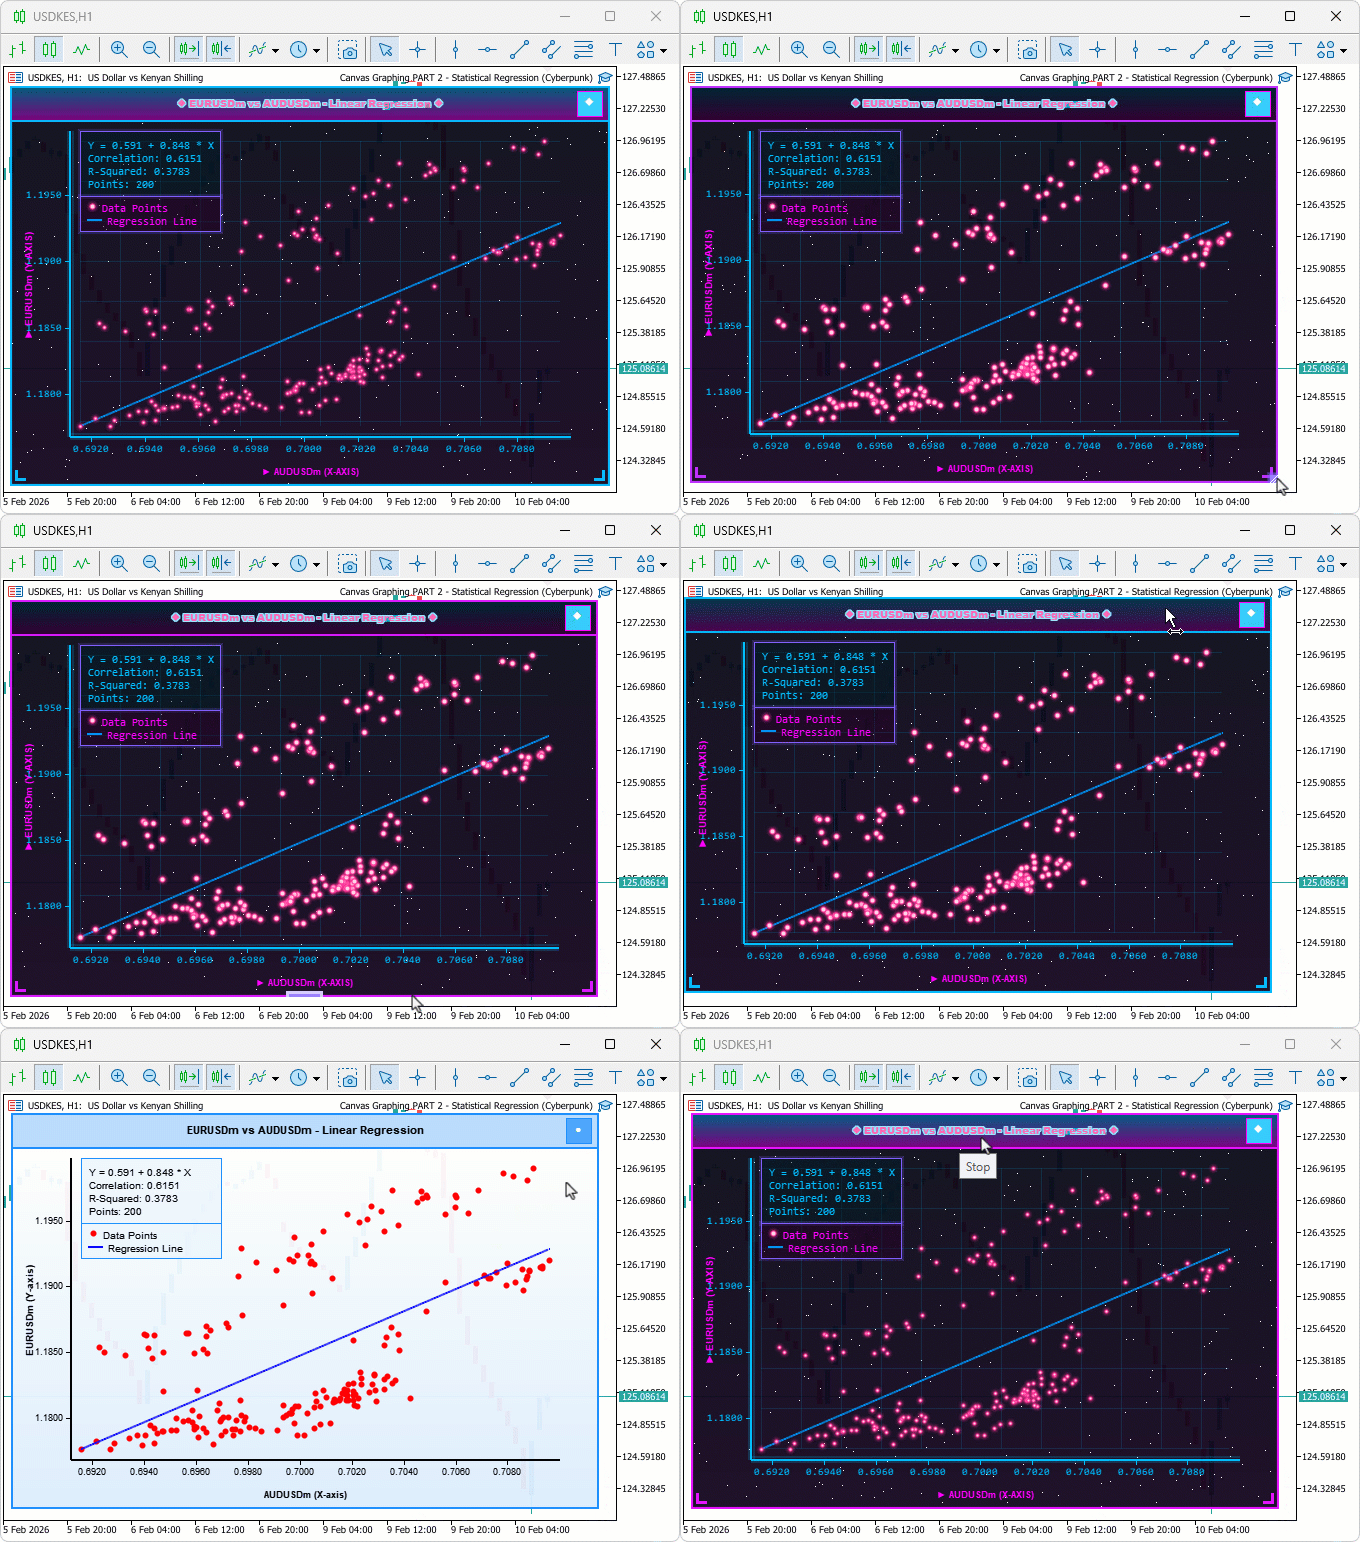
テーマはボタン操作で標準テーマとサイバーパンクテーマを切り替えられるため、用途に応じて使い分けることができます。実装では、タイマー駆動のアニメーションとテーマ切り替え機能を追加し、ブレンド処理によってネオンカラーのポイントや発光する枠線などのサイバーパンク要素を描画します。また、既存の描画関数も両テーマに対応できるよう拡張します。以下に、目標を視覚的に示した図を掲載します。
MQL5での実装
MQL5プログラムを拡張するために、まず今回追加する新しいテーマや各種演出へ対応できるよう、新しい入力パラメータとグローバル変数を追加します。
テーマ管理のための入力とグローバル変数の拡張
サイバーパンクテーマを実装するために、グローエフェクトを制御する入力パラメータに加え、テーマカラー、状態フラグ、およびアニメーションの管理に使用するグローバル変数を新たに導入します。
//+------------------------------------------------------------------+
//|  Canvas Graphing PART 2 - Statistical Regression (Cyberpunk).mq5 |
//|                           Copyright 2026, Allan Munene Mutiiria. |
//|                                   https://t.me/Forex_Algo_Trader |
//+------------------------------------------------------------------+
#property copyright "Copyright 2026, Allan Munene Mutiiria."
#property link "https://t.me/Forex_Algo_Trader"
#property version "1.00"
#property strict
#property description "Dual Theme Regression: Standard & Cyberpunk Modes"

//+------------------------------------------------------------------+
//| Inputs                                                           |
//+------------------------------------------------------------------+
input group "=== CYBERPUNK MODE SETTINGS ==="
input double             glowIntensity = 0.8;           // Glow Intensity (0-1)

//+------------------------------------------------------------------+
//| Global Variables                                                 |
//+------------------------------------------------------------------+
bool isCyberpunkThemeEnabled = false;                   // Initialize cyberpunk theme flag
int themeToggleButtonX = 0;                             // Initialize theme button X
int themeToggleButtonY = 0;                             // Initialize theme button Y
const int THEME_TOGGLE_BUTTON_SIZE = 25;                // Set theme toggle button size

const color CYBER_PRIMARY_COLOR = C'0,191,255';         // Set cyber primary color
const color CYBER_SECONDARY_COLOR = C'255,0,255';       // Set cyber secondary color
const color CYBER_DATA_POINTS_COLOR = C'255,50,150';    // Set cyber data points color
const color CYBER_REGRESSION_COLOR = C'0,150,255';      // Set cyber regression color

int currentAnimationFrame = 0;                          // Initialize animation frame
まず、「"=== CYBERPUNK MODE SETTINGS ===」という新しい入力グループを追加します。このグループには、サイバーパンクテーマにおける発光エフェクトの強さを制御するglowIntensityというdouble型のパラメータを追加します。値の範囲は0~1で、初期値は0.8に設定します。この値によって、ネオングローエフェクトの強度を調整できます。次に、テーマ管理のためのグローバル変数を宣言します。isCyberpunkThemeEnabledはサイバーパンクテーマの有効・無効を切り替えるフラグです。初期値はfalseに設定し、標準テーマをデフォルト状態とします。themeToggleButtonXとthemeToggleButtonYテーマ切り替えボタンの配置位置を管理する変数です。初期値はともに0に設定します。THEME_TOGGLE_BUTTON_SIZEはテーマ切り替えボタンのサイズを定義する定数で、25ピクセルに設定します。続いて、サイバーパンク専用のカラーをC'...'表記で定義します。明るいシアン色のCYBER_PRIMARY_COLORをC'0,191,255'、マゼンタ色のCYBER_SECONDARY_COLORをC'255,0,255'、ピンク色のCYBER_DATA_POINTS_COLORをC'255,50,150'、ブルー色のCYBER_REGRESSION_COLORをC'0,150,255'として設定し、鮮やかでテーマ性のあるカラーパレットを提供します。
好みに合う別の色構成を選択することもできます。ここで使用しているものは、デモンストレーション用に任意の選択肢として採用したものです。最後に、動的エフェクトにおけるアニメーションの進行状況を追跡するため、currentAnimationFrameを0で初期化します。次に行うことは、サイバーパンクモードで単調な色表示にならないよう、色を滑らかにブレンドするためのヘルパー関数を作成することです。
カラーブレンド用ユーティリティの実装
グローエフェクトやグラデーションなどの動的エフェクトを有効にするために、2つのカラー間を補間する関数を定義します。
//+------------------------------------------------------------------+
//| Blend colors                                                     |
//+------------------------------------------------------------------+
color BlendColors(color color1, color color2, double ratio)
  {
   //--- Extract color1 red
   uchar r1 = (uchar)((color1 >> 16) & 0xFF);
   //--- Extract color1 green
   uchar g1 = (uchar)((color1 >> 8) & 0xFF);
   //--- Extract color1 blue
   uchar b1 = (uchar)(color1 & 0xFF);

   //--- Extract color2 red
   uchar r2 = (uchar)((color2 >> 16) & 0xFF);
   //--- Extract color2 green
   uchar g2 = (uchar)((color2 >> 8) & 0xFF);
   //--- Extract color2 blue
   uchar b2 = (uchar)(color2 & 0xFF);

   //--- Blend red
   uchar r = (uchar)(r1 * (1.0 - ratio) + r2 * ratio);
   //--- Blend green
   uchar g = (uchar)(g1 * (1.0 - ratio) + g2 * ratio);
   //--- Blend blue
   uchar b = (uchar)(b1 * (1.0 - ratio) + b2 * ratio);

   //--- Return blended color
   return (r << 16) | (g << 8) | b;
  }
ここでは、サイバーパンクエフェクト用の滑らかな色の遷移を作成するために、BlendColors関数を実装します。この関数では、2つの入力カラーからビットシフトを使用してRGB各成分を抽出し、各チャンネルを(1-ratio)とratioの重みでブレンドします。その後、各チャンネルを再結合して新しいカラー値を生成し、動的なグラデーションやアニメーションに利用できるようにします。これは、色を混ぜ合わせる魔法のミキサーのようなものです。2つの色を渡して「この割合で混ぜる」と指定すると(例えばratio=0.5の場合は50%ずつ)、新しい色を生成します。サイバーモードでは、この機能を使用して、青とピンクをブレンドして紫色の光を作るような、滑らかで発光感のあるビジュアルエフェクトを実現します。この機能がない場合、色の表現は単調になりますが、この処理を追加することで、より滑らかで洗練された見た目を実現できます。次のステップでは、ヘッダーにテーマ切り替えボタンを追加し、テーマを簡単に切り替えられるようにします。
テーマ切り替えボタンの追加
モード切り替えを可能にするため、ヘッダー内にボタンを配置します。また、バランスを取るために回帰直線を中央に配置します。
//--- Adjust line drawing for centering in drawRegressionPlot
//--- Draw line
mainCanvas.LineAA(lineStartScreenX, lineStartScreenY + w - regressionLineWidth/2,
  lineEndScreenX, lineEndScreenY + w - regressionLineWidth/2, argbLine);

//+------------------------------------------------------------------+
//| Draw theme toggle button                                         |
//+------------------------------------------------------------------+
void drawThemeToggleButton()
  {
   //--- Compute button X
   themeToggleButtonX = currentWidthPixels - THEME_TOGGLE_BUTTON_SIZE - 8;
   //--- Compute button Y
   themeToggleButtonY = (HEADER_BAR_HEIGHT - THEME_TOGGLE_BUTTON_SIZE) / 2;

   //--- Declare button color
   color buttonColor;
   //--- Check cyber mode
   if (isCyberpunkThemeEnabled)
     {
      //--- Set cyber color
      buttonColor = isHoveringThemeButton ? LightenColor(CYBER_PRIMARY_COLOR, 0.3) : CYBER_PRIMARY_COLOR;
     }
   else
     {
      //--- Set standard color
      buttonColor = isHoveringThemeButton ? LightenColor(themeColor, 0.3) : themeColor;
     }

   //--- Get button ARGB
   uint argbButton = ColorToARGB(buttonColor, 200);
   //--- Get border ARGB
   uint argbBorder = ColorToARGB(isCyberpunkThemeEnabled ? CYBER_SECONDARY_COLOR : themeColor, 255);

   //--- Fill button
   mainCanvas.FillRectangle(themeToggleButtonX, themeToggleButtonY,
     themeToggleButtonX + THEME_TOGGLE_BUTTON_SIZE,
     themeToggleButtonY + THEME_TOGGLE_BUTTON_SIZE, argbButton);

   //--- Draw border
   mainCanvas.Rectangle(themeToggleButtonX, themeToggleButtonY,
     themeToggleButtonX + THEME_TOGGLE_BUTTON_SIZE,
     themeToggleButtonY + THEME_TOGGLE_BUTTON_SIZE, argbBorder);

   //--- Set icon font
   mainCanvas.FontSet("Arial Black", 16);
   //--- Get text ARGB
   uint argbText = ColorToARGB(clrWhite, 255);
   //--- Set icon text
   string iconText = isCyberpunkThemeEnabled ? "◆" : "●";
   //--- Draw icon
   mainCanvas.TextOut(themeToggleButtonX + THEME_TOGGLE_BUTTON_SIZE/2, themeToggleButtonY + 3,
     iconText, argbText, TA_CENTER);
  }
まず、drawRegressionPlot関数を修正し、回帰直線が垂直方向に中央揃えになるようにします。これは、幅方向のループ内でY座標の位置を調整することで実現します。開始画面Y座標と終了画面Y座標の両方から、線幅の半分であるregressionLineWidth/2を減算します。これにより、LineAAで描画する際に、計算されたパスを中心として線の太さが均等に配置されます。以前は、太い線が中心からずれて見え、片側に寄った道路のような不自然な見た目になる場合がありました。線幅の半分を差し引くことで、線を正確に中央へ配置できます。小さな修正ですが、壁に掛けた絵をまっすぐに整えるのと同じように、見た目がより整い、自然になります。
次に、drawThemeToggleButton関数を実装します。この関数は、モード切り替え用のトグルボタンをヘッダー部分に描画します。ボタン位置はヘッダー右端寄りに、マージンを考慮して計算し、テーマ状態とホバー状態に応じて色を選択します。動的な表現を加えるために、LightenColorを使用します。この関数では、半透明ARGBカラーで矩形を塗りつぶし、テーマ固有の色で枠線を描画し、太字のArial Blackフォントを設定します。その後、TextOutメソッドを使用して、中央にサイバーパンクテーマの場合は菱形アイコン、標準テーマの場合は円形アイコンを白色のARGBカラーで描画します。 以前のようにWingdings文字を使用したアイコンを利用することもできますが、今回はシンプルでテクニカルな印象を与えるため、この方式を採用します。次に、サイバーパンクのビジュアルを描画します。まずはメインCanvasのオーバーレイから開始します。
サイバーパンク風の背景と枠線の描画
テーマの基盤を構築するため、星空のようなグラデーションと、アニメーションするホログラフィックフレームを作成します。
//+------------------------------------------------------------------+
//| Draw cyberpunk background                                        |
//+------------------------------------------------------------------+
void drawCyberpunkBackground()
  {
   //--- Set top color
   color topColor = C'10,10,25';
   //--- Set bottom color
   color bottomColor = C'20,5,30';

   //--- Compute alpha
   uchar alphaChannel = (uchar)(255 * backgroundOpacityLevel);

   //--- Loop over rows
   for (int y = HEADER_BAR_HEIGHT; y < currentHeightPixels; y++)
     {
      //--- Compute factor
      double factor = (double)(y - HEADER_BAR_HEIGHT) / (currentHeightPixels - HEADER_BAR_HEIGHT);
      //--- Blend row color
      color rowColor = BlendColors(topColor, bottomColor, factor);
      //--- Get ARGB
      uint argbColor = ColorToARGB(rowColor, alphaChannel);

      //--- Loop over columns
      for (int x = 0; x < currentWidthPixels; x++)
        {
         //--- Check for star
         if (MathRand() % 800 == 0)
           {
            //--- Compute brightness
            uchar brightness = (uchar)(100 + MathRand() % 155);
            //--- Get star color
            uint starColor = ColorToARGB(C'255,255,255', brightness);
            //--- Blend star
            blendPixelSet(mainCanvas, x, y, starColor);
           }
         else
           {
            //--- Blend normal
            blendPixelSet(mainCanvas, x, y, argbColor);
           }
        }
     }
  }

//+------------------------------------------------------------------+
//| Draw holographic border                                          |
//+------------------------------------------------------------------+
void drawHolographicBorder()
  {
   //--- Compute phase
   double phase = (currentAnimationFrame % 360) * M_PI / 180.0;
   //--- Compute glow factor
   double glowFactor = (MathSin(phase) + 1.0) * 0.5;

   //--- Blend border color
   color borderColor = BlendColors(CYBER_PRIMARY_COLOR, CYBER_SECONDARY_COLOR, glowFactor);

   //--- Loop for glow layers
   for (int i = 0; i < 3; i++)
     {
      //--- Compute alpha
      uchar alpha = (uchar)(80 * glowIntensity * (3 - i) / 3.0);
      //--- Get glow color
      uint glowColor = ColorToARGB(borderColor, alpha);

      //--- Draw top glow
      for (int x = i; x < currentWidthPixels - i; x++)
        {
         //--- Blend pixel
         blendPixelSet(mainCanvas, x, i, glowColor);
        }
      //--- Draw bottom glow
      for (int x = i; x < currentWidthPixels - i; x++)
        {
         //--- Blend pixel
         blendPixelSet(mainCanvas, x, currentHeightPixels - 1 - i, glowColor);
        }
      //--- Draw left glow
      for (int y = i; y < currentHeightPixels - i; y++)
        {
         //--- Blend pixel
         blendPixelSet(mainCanvas, i, y, glowColor);
        }
      //--- Draw right glow
      for (int y = i; y < currentHeightPixels - i; y++)
        {
         //--- Blend pixel
         blendPixelSet(mainCanvas, currentWidthPixels - 1 - i, y, glowColor);
        }
     }

   //--- Get border ARGB
   uint argbBorder = ColorToARGB(borderColor, 255);
   //--- Draw outer border
   mainCanvas.Rectangle(0, 0, currentWidthPixels - 1, currentHeightPixels - 1, argbBorder);
   //--- Draw inner border
   mainCanvas.Rectangle(1, 1, currentWidthPixels - 2, currentHeightPixels - 2, argbBorder);

   //--- Draw corner accents
   drawCornerAccents(borderColor);
  }

//+------------------------------------------------------------------+
//| Draw corner accents                                              |
//+------------------------------------------------------------------+
void drawCornerAccents(color accentColor)
  {
   //--- Get accent ARGB
   uint argbAccent = ColorToARGB(accentColor, 255);
   //--- Set accent size
   int accentSize = 15;

   //--- Loop for top-left
   for (int i = 0; i < 3; i++)
     {
      //--- Draw horizontal
      mainCanvas.Line(5, 5 + i, accentSize, 5 + i, argbAccent);
      //--- Draw vertical
      mainCanvas.Line(5 + i, 5, 5 + i, accentSize, argbAccent);
     }

   //--- Loop for top-right
   for (int i = 0; i < 3; i++)
     {
      //--- Draw horizontal
      mainCanvas.Line(currentWidthPixels - accentSize - 1, 5 + i, currentWidthPixels - 6, 5 + i, argbAccent);
      //--- Draw vertical
      mainCanvas.Line(currentWidthPixels - 6 - i, 5, currentWidthPixels - 6 - i, accentSize, argbAccent);
     }

   //--- Loop for bottom-left
   for (int i = 0; i < 3; i++)
     {
      //--- Draw horizontal
      mainCanvas.Line(5, currentHeightPixels - 6 - i, accentSize, currentHeightPixels - 6 - i, argbAccent);
      //--- Draw vertical
      mainCanvas.Line(5 + i, currentHeightPixels - accentSize - 1, 5 + i, currentHeightPixels - 6, argbAccent);
     }

   //--- Loop for bottom-right
   for (int i = 0; i < 3; i++)
     {
      //--- Draw horizontal
      mainCanvas.Line(currentWidthPixels - accentSize - 1, currentHeightPixels - 6 - i, currentWidthPixels - 6, currentHeightPixels - 6 - i, argbAccent);
      //--- Draw vertical
      mainCanvas.Line(currentWidthPixels - 6 - i, currentHeightPixels - accentSize - 1, currentWidthPixels - 6 - i, currentHeightPixels - 6, argbAccent);
     }
  }
サイバーパンクフレームを実装するために、drawCyberpunkBackground関数を作成し、サイバーパンクテーマ用の暗く星空のようなグラデーション背景を生成します。上部の色には深い青黒色C'10,10,25'を設定し、下部には紫黒色C'20,5,30'を設定します。さらに、不透明度からアルファ値を計算し、行ごとのループ処理でBlendColorsを使用して色をブレンドします。その後、MathRand%800==0の条件を使用してランダムに白い星を追加し、それぞれ異なる明るさを設定します。最後に、すべての要素をblendPixelSetで合成し、宇宙空間のようなビジュアルエフェクトを生成します。
次に、アニメーションする発光エッジを作成するために、drawHolographicBorder関数を実装します。この関数では、currentAnimationFrameを基に正弦波で変化する位相を計算し、発光の脈動効果を表現します。また、プライマリとセカンダリのサイバーカラーをブレンドして動的な枠線カラーを生成します。その後、上辺・下辺・左辺・右辺に対して、アルファ値を徐々に減少させながら複数のグロー層をループ処理で描画します。メインの枠線はRectangleで描画し、さらにdrawCornerAccentsを呼び出して装飾を追加します。drawCornerAccentsでは、アクセントカラーをARGB形式へ変換し、サイズを15に設定します。そして3回のループ処理を使用して、各コーナー(左上、右上、左下、右下)に短い水平線と垂直線をLineで描画します。これにより、テクノロジー感のあるフレームを構成するブラケット状のアクセントを形成します。次に、未来的なヘッダーの描画が必要になります。
未来的なヘッダーの描画
上部エリアを仕上げるために、発光するテキストとアニメーション効果を備えたグラデーションヘッダーを描画します。
//+------------------------------------------------------------------+
//| Draw futuristic header                                           |
//+------------------------------------------------------------------+
void drawFuturisticHeader()
  {
   //--- Compute phase
   double phase = (currentAnimationFrame % 360) * M_PI / 180.0;
   //--- Compute anim factor
   double animFactor = (MathSin(phase) + 1.0) * 0.5;

   //--- Loop over header rows
   for (int y = 0; y < HEADER_BAR_HEIGHT; y++)
     {
      //--- Compute grad factor
      double gradFactor = (double)y / HEADER_BAR_HEIGHT;

      //--- Declare header color
      color headerColor;
      //--- Check dragging
      if (isDraggingCanvas)
        {
         //--- Blend dragged
         headerColor = BlendColors(DarkenColor(CYBER_PRIMARY_COLOR, 0.7), DarkenColor(CYBER_SECONDARY_COLOR, 0.7), gradFactor);
        }
      //--- Check hovering
      else if (isHoveringHeader)
        {
         //--- Blend hovered
         headerColor = BlendColors(DarkenColor(CYBER_PRIMARY_COLOR, 0.5), DarkenColor(CYBER_SECONDARY_COLOR, 0.5), gradFactor);
        }
      else
        {
         //--- Blend normal
         headerColor = BlendColors(DarkenColor(CYBER_PRIMARY_COLOR, 0.8), DarkenColor(CYBER_SECONDARY_COLOR, 0.8), gradFactor);
        }

      //--- Get header ARGB
      uint argbHeader = ColorToARGB(headerColor, 255);

      //--- Loop over columns
      for (int x = 0; x < currentWidthPixels; x++)
        {
         //--- Set pixel
         mainCanvas.PixelSet(x, y, argbHeader);
        }
     }

   //--- Blend border
   color borderColor = BlendColors(CYBER_PRIMARY_COLOR, CYBER_SECONDARY_COLOR, animFactor);
   //--- Get border ARGB
   uint argbBorder = ColorToARGB(borderColor, 255);
   //--- Draw outer
   mainCanvas.Rectangle(0, 0, currentWidthPixels - 1, HEADER_BAR_HEIGHT, argbBorder);
   //--- Draw inner
   mainCanvas.Rectangle(1, 1, currentWidthPixels - 2, HEADER_BAR_HEIGHT - 1, argbBorder);

   //--- Set title font
   mainCanvas.FontSet("Arial Black", titleFontSize);

   //--- Format title
   string titleText = StringFormat("◆ %s vs %s - Linear Regression ◆", secondarySymbol, primarySymbol);

   //--- Get glow ARGB
   uint glowColor = ColorToARGB(CYBER_PRIMARY_COLOR, (uchar)(120 * glowIntensity));
   //--- Loop for glow Y
   for (int offsetY = -1; offsetY <= 1; offsetY++)
     {
      //--- Loop for glow X
      for (int offsetX = -1; offsetX <= 1; offsetX++)
        {
         //--- Skip center
         if (offsetX == 0 && offsetY == 0) continue;
         //--- Draw glow text
         mainCanvas.TextOut(currentWidthPixels / 2 + offsetX, (HEADER_BAR_HEIGHT - titleFontSize) / 2 + offsetY,
           titleText, glowColor, TA_CENTER);
        }
     }

   //--- Set text color
   uint textColor = ColorToARGB(C'255,105,180', 255);
   //--- Draw title
   mainCanvas.TextOut(currentWidthPixels / 2, (HEADER_BAR_HEIGHT - titleFontSize) / 2,
     titleText, textColor, TA_CENTER);
  }
ここでは、サイバーパンクテーマ用のアニメーション付きグラデーションヘッダーを描画するdrawFuturisticHeader関数を実装します。まず、currentAnimationFrameを基に正弦波を使用して位相を計算し、脈動エフェクト用のアニメーション係数を0から1の範囲に正規化します。次に、ヘッダーの各行をループ処理し、垂直方向のグラデーション係数を計算します。そして、状態(ドラッグ中、ホバー中、通常状態)に応じて、サイバープライマリカラーとセカンダリカラーを暗く調整した色をBlendColorsとDarkenColorでブレンドします。その後、ARGB形式へ変換し、PixelSetを使用して各ピクセル行を設定することで、動的な陰影表現を実現します。
枠線を追加するために、アニメーション係数を使用してプライマリカラーとセカンダリカラーをブレンドし、そのARGBカラーを使用してRectangleで外側と内側の矩形を描画します。次に、FontSetで太字のArial Blackフォントを設定し、StringFormatを使用して記号とペア名を含むタイトル文字列を整形します。その後、3×3グリッド状にテキスト位置をずらして描画し(中央位置は除外)、低アルファのサイバープライマリARGBカラーを使用してグローエフェクトを生成します。最後に、TextOutメソッドで中央配置したメインタイトルをホットピンクのARGBカラーで重ね描画します。次に、サイバーパンク回帰プロットを描画する必要があります。ただし、その前にグリッドとデータポイントを描画するためのヘルパー関数を用意します。
サイバーパンクグリッドとネオンポイントの描画
プロットを構成するために、アニメーション付きグリッドと発光するデータマーカーを追加します。
//+------------------------------------------------------------------+
//| Draw cyberpunk grid                                              |
//+------------------------------------------------------------------+
void drawCyberpunkGrid(int startX, int startY, int width, int height)
  {
   //--- Set grid spacing
   int gridSpacing = 40;
   //--- Compute phase
   double phase = (currentAnimationFrame % 120) * M_PI / 60.0;
   //--- Compute alpha
   uchar gridAlpha = (uchar)(30 + 15 * MathSin(phase));

   //--- Set grid color
   color gridColor = CYBER_PRIMARY_COLOR;
   //--- Get grid ARGB
   uint argbGrid = ColorToARGB(gridColor, gridAlpha);

   //--- Loop vertical lines
   for (int x = startX; x < startX + width; x += gridSpacing)
     {
      //--- Loop over height
      for (int y = startY; y < startY + height; y++)
        {
         //--- Blend grid pixel
         blendPixelSet(mainCanvas, x, y, argbGrid);
        }
     }

   //--- Loop horizontal lines
   for (int y = startY; y < startY + height; y += gridSpacing)
     {
      //--- Loop over width
      for (int x = startX; x < startX + width; x++)
        {
         //--- Blend grid pixel
         blendPixelSet(mainCanvas, x, y, argbGrid);
        }
     }
  }

//+------------------------------------------------------------------+
//| Draw neon point                                                  |
//+------------------------------------------------------------------+
void drawNeonPoint(int centerX, int centerY, int radius, color pointColor)
  {
   //--- Loop for glow
   for (int glowRadius = radius + 4; glowRadius > radius; glowRadius--)
     {
      //--- Compute alpha
      uchar glowAlpha = (uchar)(80 * glowIntensity * (radius + 4 - glowRadius) / 4.0);
      //--- Get glow color
      uint glowColor = ColorToARGB(pointColor, glowAlpha);
      //--- Draw glow circle
      drawCirclePoint(centerX, centerY, glowRadius, glowColor);
     }

   //--- Get point ARGB
   uint argbPoint = ColorToARGB(pointColor, 255);
   //--- Draw point circle
   drawCirclePoint(centerX, centerY, radius, argbPoint);

   //--- Get center ARGB
   uint argbCenter = ColorToARGB(C'255,255,255', 200);
   //--- Draw center circle
   drawCirclePoint(centerX, centerY, radius - 1, argbCenter);
  }
drawCyberpunkGrid関数を実装し、サイバーパンクモード時のプロット領域にアニメーション付きグリッドオーバーレイを作成します。まず、グリッド間隔を40ピクセルに設定し、currentAnimationFrameから正弦波ベースの脈動用位相を計算します。さらに、微細なグローエフェクトを表現するために、アルファ値を30から45の範囲で変化させます。次に、サイバープライマリカラーを使用し、動的なアルファ値を含むARGB形式へ変換します。その後、blendPixelSetを使用して、縦方向のラインでは全高さのピクセルをブレンドしながら、一定間隔ごとに描画します。同様に横方向のラインも幅全体に描画します。これにより、データ表示を邪魔することなく、未来的なマトリックス風の背景を追加できます。このグリッドは低不透明度のブレンド処理によって他の要素と自然に統合され、テーマへの没入感を高めます。不要な場合は、このグリッド表示を無効にしても問題ありません。
ネオンエフェクトを追加するために、データポイント描画用のdrawNeonPoint関数を作成します。この関数では、radius+4からradius+1まで外側に向かってループし、glowIntensityに応じてアルファ値を減少させながら、同心円状のグローサークルを描画します。描画には、基本的な円描画関数であるdrawCirclePointを使用し、ポイントカラーのARGB値を適用します。その後、完全な半径と不透明度で中心となるポイントを描画し、さらに内側に半透明の白色C'255,255,255'をアルファ値200で使用した小さな円を重ねてハイライトを追加します。これにより、暗いテーマ上でも目立つ、脈動感のあるSF風のビジュアルを実現できます。なお、カラー設定は必要に応じて変更できます。ここではデモンストレーション用として任意の値を使用しています。これらのヘルパー関数を利用して、サイバーパンク形式のプロットを描画できるようになります。
サイバーパンク回帰プロットの描画
主要な分析結果を表示するために、プロットをグリッド、軸、目盛り、ライン、ポイントを含むサイバーパンクスタイルへ適応します。
//+------------------------------------------------------------------+
//| Draw regression plot cyberpunk                                   |
//+------------------------------------------------------------------+
void drawRegressionPlotCyberpunk()
  {
   //--- Return if no data
   if (!dataLoadedSuccessfully) return;

   //--- Set plot left
   int plotAreaLeft = 60;
   //--- Set plot right
   int plotAreaRight = currentWidthPixels - 40;
   //--- Set plot top
   int plotAreaTop = HEADER_BAR_HEIGHT + 10;
   //--- Set plot bottom
   int plotAreaBottom = currentHeightPixels - 50;

   //--- Set draw left
   int drawAreaLeft = plotAreaLeft + plotPadding;
   //--- Set draw right
   int drawAreaRight = plotAreaRight - plotPadding;
   //--- Set draw top
   int drawAreaTop = plotAreaTop + plotPadding;
   //--- Set draw bottom
   int drawAreaBottom = plotAreaBottom - plotPadding;

   //--- Compute plot width
   int plotWidth = drawAreaRight - drawAreaLeft;
   //--- Compute plot height
   int plotHeight = drawAreaBottom - drawAreaTop;

   //--- Return if invalid
   if (plotWidth <= 0 || plotHeight <= 0) return;

   //--- Init min X
   double minX = primaryClosePrices[0];
   //--- Init max X
   double maxX = primaryClosePrices[0];
   //--- Init min Y
   double minY = secondaryClosePrices[0];
   //--- Init max Y
   double maxY = secondaryClosePrices[0];

   //--- Get data points
   int dataPoints = ArraySize(primaryClosePrices);
   //--- Loop over points
   for (int i = 1; i < dataPoints; i++)
     {
      //--- Update min X
      if (primaryClosePrices[i] < minX) minX = primaryClosePrices[i];
      //--- Update max X
      if (primaryClosePrices[i] > maxX) maxX = primaryClosePrices[i];
      //--- Update min Y
      if (secondaryClosePrices[i] < minY) minY = secondaryClosePrices[i];
      //--- Update max Y
      if (secondaryClosePrices[i] > maxY) maxY = secondaryClosePrices[i];
     }

   //--- Compute range X
   double rangeX = maxX - minX;
   //--- Compute range Y
   double rangeY = maxY - minY;

   //--- Set min range X
   if (rangeX == 0) rangeX = 1;
   //--- Set min range Y
   if (rangeY == 0) rangeY = 1;

   //--- Draw grid
   drawCyberpunkGrid(drawAreaLeft, drawAreaTop, plotWidth, plotHeight);

   //--- Set axis color
   color axisColor = CYBER_PRIMARY_COLOR;
   //--- Get axis ARGB
   uint argbAxis = ColorToARGB(axisColor, 255);

   //--- Get glow ARGB
   uint glowColor = ColorToARGB(axisColor, (uchar)(60 * glowIntensity));
   //--- Loop for glow
   for (int g = 1; g <= 2; g++)
     {
      //--- Draw Y glow
      for (int y = plotAreaTop; y <= plotAreaBottom; y++)
        {
         //--- Blend left glow
         blendPixelSet(mainCanvas, plotAreaLeft - g - 1, y, glowColor);
         //--- Blend right glow
         blendPixelSet(mainCanvas, plotAreaLeft + g + 1, y, glowColor);
        }
      //--- Draw X glow
      for (int x = plotAreaLeft; x <= plotAreaRight; x++)
        {
         //--- Blend bottom glow
         blendPixelSet(mainCanvas, x, plotAreaBottom + g + 1, glowColor);
         //--- Blend top glow
         blendPixelSet(mainCanvas, x, plotAreaBottom - g - 1, glowColor);
        }
     }

   //--- Loop for thick Y-axis
   for (int thick = 0; thick < 2; thick++)
     {
      //--- Draw Y-axis line
      mainCanvas.Line(plotAreaLeft - thick, plotAreaTop, plotAreaLeft - thick, plotAreaBottom, argbAxis);
     }

   //--- Loop for thick X-axis
   for (int thick = 0; thick < 2; thick++)
     {
      //--- Draw X-axis line
      mainCanvas.Line(plotAreaLeft, plotAreaBottom + thick, plotAreaRight, plotAreaBottom + thick, argbAxis);
     }

   //--- Set tick font
   mainCanvas.FontSet("Consolas", axisLabelFontSize);
   //--- Get tick label ARGB
   uint argbTickLabel = ColorToARGB(CYBER_PRIMARY_COLOR, 255);

   //--- Declare Y ticks
   double yTickValues[];
   //--- Compute Y ticks
   int numYTicks = calculateOptimalTicks(minY, maxY, plotHeight, yTickValues);

   //--- Loop over Y ticks
   for (int i = 0; i < numYTicks; i++)
     {
      //--- Get Y value
      double yValue = yTickValues[i];
      //--- Skip out of range
      if (yValue < minY || yValue > maxY) continue;

      //--- Compute Y pos
      int yPos = drawAreaBottom - (int)((yValue - minY) / rangeY * plotHeight);

      //--- Draw tick
      mainCanvas.Line(plotAreaLeft - 5, yPos, plotAreaLeft, yPos, argbAxis);

      //--- Format label
      string yLabel = formatTickLabel(yValue, rangeY);
      //--- Draw label
      mainCanvas.TextOut(plotAreaLeft - 8, yPos - axisLabelFontSize/2, yLabel, argbTickLabel, TA_RIGHT);
     }

   //--- Declare X ticks
   double xTickValues[];
   //--- Compute X ticks
   int numXTicks = calculateOptimalTicks(minX, maxX, plotWidth, xTickValues);

   //--- Loop over X ticks
   for (int i = 0; i < numXTicks; i++)
     {
      //--- Get X value
      double xValue = xTickValues[i];
      //--- Skip out of range
      if (xValue < minX || xValue > maxX) continue;

      //--- Compute X pos
      int xPos = drawAreaLeft + (int)((xValue - minX) / rangeX * plotWidth);

      //--- Draw tick
      mainCanvas.Line(xPos, plotAreaBottom, xPos, plotAreaBottom + 5, argbAxis);

      //--- Format label
      string xLabel = formatTickLabel(xValue, rangeX);
      //--- Draw label
      mainCanvas.TextOut(xPos, plotAreaBottom + 7, xLabel, argbTickLabel, TA_CENTER);
     }

   //--- Compute start Y
   double lineStartY = regressionIntercept + regressionSlope * minX;
   //--- Compute end Y
   double lineEndY = regressionIntercept + regressionSlope * maxX;

   //--- Set start screen X
   int lineStartScreenX = drawAreaLeft;
   //--- Compute start screen Y
   int lineStartScreenY = drawAreaBottom - (int)((lineStartY - minY) / rangeY * plotHeight);
   //--- Set end screen X
   int lineEndScreenX = drawAreaRight;
   //--- Compute end screen Y
   int lineEndScreenY = drawAreaBottom - (int)((lineEndY - minY) / rangeY * plotHeight);

   //--- Get line ARGB
   uint argbLine = ColorToARGB(CYBER_REGRESSION_COLOR, 255);
   //--- Loop for width
   for (int w = 0; w < regressionLineWidth; w++)
     {
      //--- Draw line
      mainCanvas.LineAA(lineStartScreenX, lineStartScreenY + w - regressionLineWidth/2,
                                  lineEndScreenX, lineEndScreenY + w - regressionLineWidth/2, argbLine);
     }

   //--- Compute pulse phase
   double pulsePhase = (currentAnimationFrame % 60) * M_PI / 30.0;
   //--- Compute pulse factor
   double pulseFactor = (MathSin(pulsePhase) + 1.0) * 0.3 + 0.7;
   //--- Compute point size
   int effectivePointSize = (int)(dataPointSize * pulseFactor);

   //--- Loop over points
   for (int i = 0; i < dataPoints; i++)
     {
      //--- Compute screen X
      int screenX = drawAreaLeft + (int)((primaryClosePrices[i] - minX) / rangeX * plotWidth);
      //--- Compute screen Y
      int screenY = drawAreaBottom - (int)((secondaryClosePrices[i] - minY) / rangeY * plotHeight);

      //--- Draw neon point
      drawNeonPoint(screenX, screenY, effectivePointSize, CYBER_DATA_POINTS_COLOR);
     }

   //--- Set axis label font
   mainCanvas.FontSet("Arial Bold", labelFontSize);
   //--- Get axis label ARGB
   uint argbAxisLabel = ColorToARGB(CYBER_SECONDARY_COLOR, 255);

   //--- Set X label
   string xAxisLabel = "► " + primarySymbol + " (X-AXIS)";
   //--- Draw X label
   mainCanvas.TextOut(currentWidthPixels / 2, currentHeightPixels - 20, xAxisLabel, argbAxisLabel, TA_CENTER);

   //--- Set Y label
   string yAxisLabel = "► " + secondarySymbol + " (Y-AXIS)";
   //--- Set vertical angle
   mainCanvas.FontAngleSet(900);
   //--- Draw Y label
   mainCanvas.TextOut(12, currentHeightPixels / 2, yAxisLabel, argbAxisLabel, TA_CENTER);
   //--- Reset angle
   mainCanvas.FontAngleSet(0);
  }
ここでは、サイバーパンクモードで回帰結果を可視化するために、drawRegressionPlotCyberpunk関数を実装します。まず、データが存在しない場合は処理を終了します。その後、パディングを考慮してプロット領域と描画領域を設定し、幅と高さを計算します。無効なサイズの場合は処理を終了します。次に、価格データを反復処理してX軸(プライマリ値)とY軸(セカンダリ値)の最小値・最大値を取得します。範囲が0になる場合は1に調整します。その後、背景グリッド描画用にdrawCyberpunkGridを呼び出します。軸にはサイバープライマリARGBカラーを設定し、blendPixelSetを使用してY軸・X軸周辺にグロー層を追加することで、奥行きのある表現を加えます。また、Lineをループ処理で使用し、線を太く見せるための複数レイヤーのラインを描画します。ラベル描画では、サイバープライマリARGBカラーを使用してConsolasフォントを設定します。Y軸の目盛り値を計算し、ループ処理で短い目盛り線と、formatTickLabelで整形した右寄せラベルを描画します。同様に、X軸についても中央寄せの下部ラベルを描画します。
回帰直線については、回帰パラメータから開始点と終了点のY座標を計算し、画面座標へ変換します。その後、サイバー回帰ARGBカラーを使用し、線幅の半分を考慮した中央配置補正を行いながら、ループ内でLineAAによるアンチエイリアス付きセグメントを描画します。ポイント表示を強化するために、currentAnimationFrameから正弦波を使用して脈動位相を計算し、0.7〜1.0の範囲でスケール係数を調整します。その後、データポイントを画面座標へ変換し、サイバーポイントカラーを使用してdrawNeonPointでアニメーションする発光エフェクトを描画します。最後に、ラベル用としてサイバーセカンダリARGBカラーを設定した太字のArial Boldフォントを使用します。装飾効果としてハードコードした矢印プレフィックスを追加します。これは簡略化のために使用しているため、必要に応じて変更できます。X軸ラベルは下部中央に配置し、Y軸ラベルはFontAngleSetで900に回転させて縦向きに描画します。描画後に角度をリセットし、テーマに合わせたプロット表示を完成させます。コンパイルすると、次のような結果が得られます。

これで、サイバーパンクテーマ用のパネルと凡例を追加する準備が整いました。
//+------------------------------------------------------------------+
//| Draw glass morphism stats panel                                  |
//+------------------------------------------------------------------+
void drawGlassMorphismStatsPanel()
  {
   //--- Set panel X
   int panelX = statsPanelX;
   //--- Set panel Y
   int panelY = HEADER_BAR_HEIGHT + statsPanelY;
   //--- Set panel width
   int panelWidth = statsPanelWidth;
   //--- Set panel height
   int panelHeight = statsPanelHeight;

   //--- Compute bg color
   color panelBgColor = DarkenColor(CYBER_PRIMARY_COLOR, 0.85);
   //--- Set alpha
   uchar bgAlpha = 120;
   //--- Get panel bg ARGB
   uint argbPanelBg = ColorToARGB(panelBgColor, bgAlpha);

   //--- Loop over rows
   for (int y = panelY; y <= panelY + panelHeight; y++)
     {
      //--- Loop over columns
      for (int x = panelX; x <= panelX + panelWidth; x++)
        {
         //--- Blend bg pixel
         blendPixelSet(mainCanvas, x, y, argbPanelBg);
        }
     }

   //--- Blend border
   color borderColor = BlendColors(CYBER_PRIMARY_COLOR, CYBER_SECONDARY_COLOR, 0.5);
   //--- Get border ARGB
   uint argbBorder = ColorToARGB(borderColor, 255);

   //--- Get glow ARGB
   uint glowColor = ColorToARGB(borderColor, (uchar)(60 * glowIntensity));
   //--- Loop for glow
   for (int g = 1; g <= 2; g++)
     {
      //--- Draw top glow
      for (int x = panelX - g; x <= panelX + panelWidth + g; x++)
        {
         //--- Blend pixel
         blendPixelSet(mainCanvas, x, panelY - g, glowColor);
        }
      //--- Draw bottom glow
      for (int x = panelX - g; x <= panelX + panelWidth + g; x++)
        {
         //--- Blend pixel
         blendPixelSet(mainCanvas, x, panelY + panelHeight + g, glowColor);
        }
      //--- Draw left glow
      for (int y = panelY - g; y <= panelY + panelHeight + g; y++)
        {
         //--- Blend pixel
         blendPixelSet(mainCanvas, panelX - g, y, glowColor);
        }
      //--- Draw right glow
      for (int y = panelY - g; y <= panelY + panelHeight + g; y++)
        {
         //--- Blend pixel
         blendPixelSet(mainCanvas, panelX + panelWidth + g, y, glowColor);
        }
     }

   //--- Draw top border
   for (int x = panelX; x <= panelX + panelWidth; x++)
     {
      //--- Blend border pixel
      blendPixelSet(mainCanvas, x, panelY, argbBorder);
      //--- Blend bottom border
      blendPixelSet(mainCanvas, x, panelY + panelHeight, argbBorder);
     }
   //--- Draw left and right borders
   for (int y = panelY; y <= panelY + panelHeight; y++)
     {
      //--- Blend left
      blendPixelSet(mainCanvas, panelX, y, argbBorder);
      //--- Blend right
      blendPixelSet(mainCanvas, panelX + panelWidth, y, argbBorder);
     }

   //--- Set stats font
   mainCanvas.FontSet("Consolas", panelFontSize);
   //--- Get text ARGB
   uint argbText = ColorToARGB(CYBER_PRIMARY_COLOR, 255);

   //--- Set text Y
   int textY = panelY + 8;
   //--- Set line spacing
   int lineSpacing = panelFontSize;

   //--- Format equation
   string equationText = StringFormat("Y = %.3f + %.3f * X", regressionIntercept, regressionSlope);
   //--- Draw equation
   mainCanvas.TextOut(panelX + 8, textY, equationText, argbText, TA_LEFT);
   //--- Update Y
   textY += lineSpacing;

   //--- Format correlation
   string correlationText = StringFormat("Correlation: %.4f", correlationCoefficient);
   //--- Draw correlation
   mainCanvas.TextOut(panelX + 8, textY, correlationText, argbText, TA_LEFT);
   //--- Update Y
   textY += lineSpacing;

   //--- Format R-squared
   string rSquaredText = StringFormat("R-Squared: %.4f", rSquared);
   //--- Draw R-squared
   mainCanvas.TextOut(panelX + 8, textY, rSquaredText, argbText, TA_LEFT);
   //--- Update Y
   textY += lineSpacing;

   //--- Format points
   string dataPointsText = StringFormat("Points: %d", ArraySize(primaryClosePrices));
   //--- Draw points
   mainCanvas.TextOut(panelX + 8, textY, dataPointsText, argbText, TA_LEFT);
  }

//+------------------------------------------------------------------+
//| Draw glass morphism legend                                       |
//+------------------------------------------------------------------+
void drawGlassMorphismLegend()
  {
   //--- Set legend X
   int legendX = statsPanelX;
   //--- Set legend Y
   int legendY = HEADER_BAR_HEIGHT + statsPanelY + statsPanelHeight;
   //--- Set legend width
   int legendWidth = statsPanelWidth;
   //--- Set legend height
   int legendHeightThis = legendHeight;

   //--- Compute bg color
   color legendBgColor = DarkenColor(CYBER_SECONDARY_COLOR, 0.85);
   //--- Set alpha
   uchar bgAlpha = 120;
   //--- Get legend bg ARGB
   uint argbLegendBg = ColorToARGB(legendBgColor, bgAlpha);

   //--- Loop over rows
   for (int y = legendY; y <= legendY + legendHeightThis; y++)
     {
      //--- Loop over columns
      for (int x = legendX; x <= legendX + legendWidth; x++)
        {
         //--- Blend bg pixel
         blendPixelSet(mainCanvas, x, y, argbLegendBg);
        }
     }

   //--- Blend border
   color borderColor = BlendColors(CYBER_SECONDARY_COLOR, CYBER_PRIMARY_COLOR, 0.5);
   //--- Get border ARGB
   uint argbBorder = ColorToARGB(borderColor, 255);

   //--- Get glow ARGB
   uint glowColor = ColorToARGB(borderColor, (uchar)(60 * glowIntensity));
   //--- Loop for glow
   for (int g = 1; g <= 2; g++)
     {
      //--- Draw top and bottom glow
      for (int x = legendX - g; x <= legendX + legendWidth + g; x++)
        {
         //--- Blend top
         blendPixelSet(mainCanvas, x, legendY - g, glowColor);
         //--- Blend bottom
         blendPixelSet(mainCanvas, x, legendY + legendHeightThis + g, glowColor);
        }
      //--- Draw left and right glow
      for (int y = legendY - g; y <= legendY + legendHeightThis + g; y++)
        {
         //--- Blend left
         blendPixelSet(mainCanvas, legendX - g, y, glowColor);
         //--- Blend right
         blendPixelSet(mainCanvas, legendX + legendWidth + g, y, glowColor);
        }
     }

   //--- Draw top and bottom borders
   for (int x = legendX; x <= legendX + legendWidth; x++)
     {
      //--- Blend top
      blendPixelSet(mainCanvas, x, legendY, argbBorder);
      //--- Blend bottom
      blendPixelSet(mainCanvas, x, legendY + legendHeightThis, argbBorder);
     }
   //--- Draw left and right borders
   for (int y = legendY; y <= legendY + legendHeightThis; y++)
     {
      //--- Blend left
      blendPixelSet(mainCanvas, legendX, y, argbBorder);
      //--- Blend right
      blendPixelSet(mainCanvas, legendX + legendWidth, y, argbBorder);
     }

   //--- Set legend font
   mainCanvas.FontSet("Consolas", panelFontSize);
   //--- Get text ARGB
   uint argbText = ColorToARGB(CYBER_SECONDARY_COLOR, 255);

   //--- Set item Y
   int itemY = legendY + 10;
   //--- Set line spacing
   int lineSpacing = panelFontSize;

   //--- Draw neon point
   drawNeonPoint(legendX + 12, itemY, dataPointSize, CYBER_DATA_POINTS_COLOR);
   //--- Draw data label
   mainCanvas.TextOut(legendX + 22, itemY - 4, "Data Points", argbText, TA_LEFT);
   //--- Update Y
   itemY += lineSpacing;

   //--- Get line color
   uint argbLineColor = ColorToARGB(CYBER_REGRESSION_COLOR, 255);
   //--- Loop to draw line
   for (int i = 0; i < 15; i++)
     {
      //--- Blend line pixel
      blendPixelSet(mainCanvas, legendX + 7 + i, itemY, argbLineColor);
      //--- Blend below pixel
      blendPixelSet(mainCanvas, legendX + 7 + i, itemY + 1, argbLineColor);
     }
   //--- Draw line label
   mainCanvas.TextOut(legendX + 27, itemY - 4, "Regression Line", argbText, TA_LEFT);
  }
まず、サイバーパンクテーマ用の半透明で発光する統計情報オーバーレイを作成するために、drawGlassMorphismStatsPanel関数を実装します。この関数では、入力値を基にパネル位置を設定し、ヘッダーからのオフセットを考慮して配置します。背景にはDarkenColorを使用してサイバープライマリカラーを暗く調整した色を設定し、低いアルファ値120を適用します。その後、blendPixelSetを使用して領域をピクセル単位でブレンドし、すりガラスのようなグラスモーフィズム効果を生成します。次に、BlendColorsを使用してサイバープライマリカラーとセカンダリカラーから枠線カラーをブレンドし、ARGB形式へ変換します。さらに、パネルの外側へ広がるループ処理によって、強度を徐々に下げながら外側グロー層を追加します。その後、上辺・下辺・左辺・右辺の枠線をライン描画によってブレンドします。テキスト描画では、FontSetでConsolasフォントを設定し、文字色にはサイバープライマリARGBカラーを使用します。Y座標はパディングとフォントサイズに基づく間隔で初期化し、StringFormatとTextOutを使用して、方程式、相関係数、決定係数、データポイント数の情報を左寄せで描画します。各行の描画後にY座標を更新し、情報を縦方向に積み重ねて表示します。
同様に、drawGlassMorphismLegend関数では、統計パネルの下側に配置される凡例パネルを実装します。幅は統計パネルと揃え、背景にはサイバーセカンダリカラーを暗く調整した色を使用します。塗りつぶしのブレンド処理、枠線処理、グロー拡張処理は統計パネルと同じ方式で適用します。その後、上下左右の枠線を描画し、サイバーセカンダリARGBカラーを使用したConsolasフォントを設定します。凡例項目として、まずdrawNeonPointを使用してサイバーポイントカラーのネオンポイントアイコンを描画します。その横に「Data Points」ラベルを追加し、Y座標を更新します。続いて、サイバー回帰カラーを使用して、短い水平ラインセグメント(幅15ピクセル、高さ2ピクセル)をブレンド描画します。その横に「Regression Line」ラベルを表示し、視覚的な凡例キーとして機能させます。次に、ネオンサイズ変更インジケータを実装します。
ネオンサイズ変更インジケータの描画
サイズ変更の際のガイドとして、ハイライトされたグリップ部分にはグローを付与して表示します。
//+------------------------------------------------------------------+
//| Draw neon resize indicator                                       |
//+------------------------------------------------------------------+
void drawNeonResizeIndicator()
  {
   //--- Blend indicator color
   color indicatorColor = BlendColors(CYBER_PRIMARY_COLOR, CYBER_SECONDARY_COLOR, 0.5);
   //--- Get indicator ARGB
   uint argbIndicator = ColorToARGB(indicatorColor, 200);

   //--- Get glow ARGB
   uint glowColor = ColorToARGB(indicatorColor, (uchar)(100 * glowIntensity));

   //--- Check corner
   if (hoverResizeMode == RESIZE_CORNER || activeResizeMode == RESIZE_CORNER)
     {
      //--- Compute corner X
      int cornerX = currentWidthPixels - resizeGripSize;
      //--- Compute corner Y
      int cornerY = currentHeightPixels - resizeGripSize;

      //--- Loop for glow
      for (int g = 1; g <= 3; g++)
        {
         //--- Loop Y glow
         for (int y = cornerY - g; y < currentHeightPixels + g; y++)
           {
            //--- Loop X glow
            for (int x = cornerX - g; x < currentWidthPixels + g; x++)
              {
               //--- Blend glow
               blendPixelSet(mainCanvas, x, y, glowColor);
              }
           }
        }

      //--- Fill corner
      mainCanvas.FillRectangle(cornerX, cornerY, currentWidthPixels - 1, currentHeightPixels - 1, argbIndicator);

      //--- Set line color
      uint lineColor = ColorToARGB(C'255,255,255', 255);
      //--- Loop for lines
      for (int i = 0; i < 4; i++)
        {
         //--- Compute offset
         int offset = i * 3;
         //--- Draw diagonal
         mainCanvas.Line(cornerX + offset, currentHeightPixels - 1,
                                  currentWidthPixels - 1, cornerY + offset, lineColor);
        }
     }

   //--- Check right
   if (hoverResizeMode == RESIZE_RIGHT_EDGE || activeResizeMode == RESIZE_RIGHT_EDGE)
     {
      //--- Compute indicator Y
      int indicatorY = currentHeightPixels / 2 - 15;
      //--- Loop for glow
      for (int g = 1; g <= 3; g++)
        {
         //--- Fill glow
         mainCanvas.FillRectangle(currentWidthPixels - 3 - g, indicatorY - g,
                                          currentWidthPixels - 1 + g, indicatorY + 30 + g, glowColor);
        }
      //--- Fill indicator
      mainCanvas.FillRectangle(currentWidthPixels - 3, indicatorY,
                                       currentWidthPixels - 1, indicatorY + 30, argbIndicator);
     }

   //--- Check bottom
   if (hoverResizeMode == RESIZE_BOTTOM_EDGE || activeResizeMode == RESIZE_BOTTOM_EDGE)
     {
      //--- Compute indicator X
      int indicatorX = currentWidthPixels / 2 - 15;
      //--- Loop for glow
      for (int g = 1; g <= 3; g++)
        {
         //--- Fill glow
         mainCanvas.FillRectangle(indicatorX - g, currentHeightPixels - 3 - g,
           indicatorX + 30 + g, currentHeightPixels - 1 + g, glowColor);
        }
      //--- Fill indicator
      mainCanvas.FillRectangle(indicatorX, currentHeightPixels - 3,
        indicatorX + 30, currentHeightPixels - 1, argbIndicator);
     }
  }
drawNeonResizeIndicator関数を実装し、サイバーパンクモードでリサイズ操作を示す視覚的なガイドを追加します。まず、BlendColorsを使用してサイバープライマリカラーとセカンダリカラーをブレンドし、インジケーター用のカラーを生成します。その後、アルファ値200のARGB形式へ変換し、さらにアルファ値をスケールして強度を100にしたグローバリアントを準備します。コーナーのサイズ変更(ホバー中またはアクティブ状態)の場合は、グリップサイズを基に右下位置を計算します。その後、blendPixelSetを使用してコーナー周辺の拡張領域を塗りつぶす処理をループし、複数レイヤーのグローエフェクトを追加します。続いて、FillRectangleでグリップ用の正方形を塗りつぶし、完全な白色ARGBカラーを使用した4本の斜めオフセットラインをLineで描画して、ストライプ状の視覚効果を作成します。
次に、右辺リサイズ用のインジケーターでは、縦方向の表示位置を中央に配置します。少し幅を広げたり位置をずらした矩形をループ処理で塗りつぶしてグローエフェクトを追加し、その後メインの矩形を描画します。同様に、下辺リサイズ用のインジケーターでは、水平方向の表示位置を中央に設定します。グロー用の矩形を重ねて描画した後、プライマリカラーのインジケーター矩形で仕上げます。このネオンスタイルのグロー表現により、複数レイヤーのブレンドによる奥行き感が加わり、暗いサイバーパンクテーマの中でもリサイズ可能な領域を目立たせることができます。これで、統一されたロジックを使用してプロットを呼び出し、描画できるようになります。
//+------------------------------------------------------------------+
//| Render visualization                                             |
//+------------------------------------------------------------------+
void renderVisualization()
  {
   //--- Check cyberpunk mode
   if (isCyberpunkThemeEnabled)
     {
      //--- Render cyberpunk
      renderCyberpunkTheme();
     }
   else
     {
      //--- Render standard
      renderStandardTheme();
     }
  }

//+------------------------------------------------------------------+
//| Render standard theme                                            |
//+------------------------------------------------------------------+
void renderStandardTheme()
  {
   //--- Erase canvas
   mainCanvas.Erase(0);

   //--- Check background fill
   if (enableBackgroundFill)
     {
      //--- Draw gradient
      drawGradientBackground();
     }

   //--- Draw border
   drawCanvasBorder();
   //--- Draw header
   drawHeaderBar();
   //--- Draw toggle button
   drawThemeToggleButton();
   //--- Draw plot
   drawRegressionPlot();

   //--- Check show stats
   if (showStatistics)
     {
      //--- Draw stats panel
      drawStatisticsPanel();
      //--- Draw legend
      drawLegend();
     }

   //--- Check resize hover
   if (isHoveringResizeZone && enableResizing)
     {
      //--- Draw indicator
      drawResizeIndicator();
     }

   //--- Update canvas
   mainCanvas.Update();
  }

//+------------------------------------------------------------------+
//| Render cyberpunk theme                                           |
//+------------------------------------------------------------------+
void renderCyberpunkTheme()
  {
   //--- Erase canvas
   mainCanvas.Erase(0);

   //--- Draw cyber background
   drawCyberpunkBackground();
   //--- Draw holographic border
   drawHolographicBorder();
   //--- Draw futuristic header
   drawFuturisticHeader();
   //--- Draw toggle button
   drawThemeToggleButton();
   //--- Draw cyber plot
   drawRegressionPlotCyberpunk();

   //--- Check show stats
   if (showStatistics)
     {
      //--- Draw glass stats
      drawGlassMorphismStatsPanel();
      //--- Draw glass legend
      drawGlassMorphismLegend();
     }

   //--- Check resize hover
   if (isHoveringResizeZone && enableResizing)
     {
      //--- Draw neon indicator
      drawNeonResizeIndicator();
     }

   //--- Update canvas
   mainCanvas.Update();
  }
ここでは、テーマモードに応じてグラフ描画を切り替えるために、renderVisualization関数を実装します。この関数では、isCyberpunkThemeEnabledを確認し、サイバーパンクテーマが有効な場合は未来的なエフェクトを適用するrenderCyberpunkThemeを呼び出し、無効な場合はクラシック表示用のrenderStandardThemeを呼び出します。これにより、重複したコードを増やすことなく、シームレスなテーマ切り替えを実現できます。renderStandardThemeでは、まずEraseでCanvasを消去します。次に、設定が有効な場合はグラデーション背景を描画し、枠線、ヘッダーバー、テーマ切り替えボタン、メインの回帰プロットを順番に描画します。さらに、showStatisticsが有効な場合は、統計情報パネルと凡例を追加します。ホバー状態でリサイズが有効になっている場合は、リサイズインジケーターを追加し、最後にUpdateメソッドで画面を更新します。
同様に、renderCyberpunkThemeでは、キャンバスを消去し、サイバーパンク背景、ホログラフィックな枠線、未来的なヘッダー、テーマ切り替えボタン、サイバーパンク回帰プロットを描画します。また、表示が有効な場合はグラスモーフィズムの統計パネルと凡例を描画し、必要に応じてネオンリサイズインジケータも追加します。最後にUpdateを呼び出し、各テーマ専用の描画関数によって、一貫したテーマ表現を実現します。これにより、選択されたテーマに応じてビジュアルを条件付きで描画できるようになります。ただし、アニメーション効果を実現するためにはタイマー設定が必要です。アニメーションは、一定間隔でフレームを更新するタイマーによって制御され、サイバーパンクモードのエフェクトを滑らかに維持します。
アニメーションタイマーの設定
//+------------------------------------------------------------------+
//| Initialize expert                                                |
//+------------------------------------------------------------------+
int OnInit()
  {
   //--- Render visualization
   renderVisualization();

   //--- Enable mouse events
   ChartSetInteger(0, CHART_EVENT_MOUSE_MOVE, true);
   //--- Redraw chart
   ChartRedraw();

   //--- Set timer for animations
   EventSetMillisecondTimer(50);

   //--- Return success
   return(INIT_SUCCEEDED);
  }

//+------------------------------------------------------------------+
//| Deinitialize expert                                              |
//+------------------------------------------------------------------+
void OnDeinit(const int reason)
  {
   //--- Kill timer
   EventKillTimer();
   //--- Destroy canvas
   mainCanvas.Destroy();
   //--- Redraw chart
   ChartRedraw();
  }

//+------------------------------------------------------------------+
//| Handle timer                                                     |
//+------------------------------------------------------------------+
void OnTimer()
  {
   //--- Check cyberpunk enabled
   if (isCyberpunkThemeEnabled)
     {
      //--- Increment frame
      currentAnimationFrame++;
      //--- Reset frame
      if (currentAnimationFrame > 360) currentAnimationFrame = 0;
      //--- Render
      renderVisualization();
      //--- Redraw chart
      ChartRedraw();
     }
  }
OnInitイベントハンドラでは、既存のロジックを拡張してアニメーション対応を追加します。初期表示用にrenderVisualizationを呼び出し、マウス移動イベントを有効化し、チャートを再描画します。その後、EventSetMillisecondTimerを使用して50ミリ秒間隔のタイマーを設定し、定期的な更新処理を実行します。最後にINIT_SUCCEEDEDを返します。次に、OnDeinitでは、EventKillTimerを使用してタイマーを停止し、アニメーション処理を終了します。その後、Canvasを破棄し、クリーンアップ処理としてチャートを再描画します。
アニメーション処理を行うために、OnTimerイベントを実装します。このイベントでは、サイバーパンクモードが有効かどうかを確認し、有効な場合はcurrentAnimationFrameをインクリメントします。フレーム値はループ処理のため360でリセットします。その後、renderVisualizationを再度呼び出し、チャートを再描画することで、パルスやグローなどのフレームベースの変化を反映します。処理はこれだけです。最後に、ヘッダー部分に追加したテーマ切り替えボタンについて、ホバー状態を検出する必要があります。そのため、チャートイベントハンドラのロジックを拡張し、このボタンを認識できるようにします。
テーマ切り替え処理のイベント対応
クリック操作に反応できるように、ボタン検出用のイベントハンドラを拡張します。
//+------------------------------------------------------------------+
//| Handle chart event                                               |
//+------------------------------------------------------------------+
void OnChartEvent(const int id, const long &lparam, const double &dparam, const string &sparam)
  {
   //--- Check mouse move
   if (id == CHARTEVENT_MOUSE_MOVE)
     {
      //--- Set mouse X
      int mouseX = (int)lparam;
      //--- Set mouse Y
      int mouseY = (int)dparam;
      //--- Set mouse state
      int mouseState = (int)sparam;

      //--- Store prev canvas hover
      bool previousHoverState = isHoveringCanvas;
      //--- Store prev header hover
      bool previousHeaderHoverState = isHoveringHeader;
      //--- Store prev resize hover
      bool previousResizeHoverState = isHoveringResizeZone;
      //--- Store prev theme hover
      bool previousThemeButtonHover = isHoveringThemeButton;

      //--- Update canvas hover
      isHoveringCanvas = (mouseX >= currentPositionX && mouseX <= currentPositionX + currentWidthPixels &&
        mouseY >= currentPositionY && mouseY <= currentPositionY + currentHeightPixels);

      //--- Update header hover
      isHoveringHeader = isMouseOverHeaderBar(mouseX, mouseY);
      //--- Update theme hover
      isHoveringThemeButton = isMouseOverThemeButton(mouseX, mouseY);
      //--- Update resize hover
      isHoveringResizeZone = isMouseInResizeZone(mouseX, mouseY, hoverResizeMode);

      //--- Check if redraw needed
      bool needRedraw = (previousHoverState != isHoveringCanvas ||
        previousHeaderHoverState != isHoveringHeader ||
        previousResizeHoverState != isHoveringResizeZone ||
        previousThemeButtonHover != isHoveringThemeButton);

      //--- Check button press
      if (mouseState == 1 && previousMouseButtonState == 0)
        {
         //--- Check theme button
         if (isHoveringThemeButton)
           {
            //--- Toggle theme
            isCyberpunkThemeEnabled = !isCyberpunkThemeEnabled;
            //--- Render
            renderVisualization();
            //--- Redraw chart
            ChartRedraw();
           }
         //--- Check drag start
         else if (enableDragging && isHoveringHeader && !isHoveringResizeZone)
           {
            //--- Set dragging
            isDraggingCanvas = true;
            //--- Set start X
            dragStartX = mouseX;
            //--- Set start Y
            dragStartY = mouseY;
            //--- Set canvas X
            canvasStartX = currentPositionX;
            //--- Set canvas Y
            canvasStartY = currentPositionY;
            //--- Disable scroll
            ChartSetInteger(0, CHART_MOUSE_SCROLL, false);
            //--- Set redraw
            needRedraw = true;
           }
         //--- Check resize start
         else if (isHoveringResizeZone)
           {
            //--- Set resizing
            isResizingCanvas = true;
            //--- Set active mode
            activeResizeMode = hoverResizeMode;
            //--- Set start X
            resizeStartX = mouseX;
            //--- Set start Y
            resizeStartY = mouseY;
            //--- Set initial width
            resizeInitialWidth = currentWidthPixels;
            //--- Set initial height
            resizeInitialHeight = currentHeightPixels;
            //--- Disable scroll
            ChartSetInteger(0, CHART_MOUSE_SCROLL, false);
            //--- Set redraw
            needRedraw = true;
           }
        }
      //--- Check drag
      else if (mouseState == 1 && previousMouseButtonState == 1)
        {
         //--- Handle drag
         if (isDraggingCanvas)
           {
            //--- Handle drag
            handleCanvasDrag(mouseX, mouseY);
           }
         //--- Handle resize
         else if (isResizingCanvas)
           {
            //--- Handle resize
            handleCanvasResize(mouseX, mouseY);
           }
        }
      //--- Check button release
      else if (mouseState == 0 && previousMouseButtonState == 1)
        {
         //--- Check active
         if (isDraggingCanvas || isResizingCanvas)
           {
            //--- Reset dragging
            isDraggingCanvas = false;
            //--- Reset resizing
            isResizingCanvas = false;
            //--- Reset mode
            activeResizeMode = NO_RESIZE;
            //--- Enable scroll
            ChartSetInteger(0, CHART_MOUSE_SCROLL, true);
            //--- Set redraw
            needRedraw = true;
           }
        }

      //--- Check redraw
      if (needRedraw)
        {
         //--- Render
         renderVisualization();
         //--- Redraw chart
         ChartRedraw();
        }

      //--- Update last X
      lastMouseX = mouseX;
      //--- Update last Y
      lastMouseY = mouseY;
      //--- Update prev state
      previousMouseButtonState = mouseState;
     }
  }
テーマボタンの切り替え処理を実装するために、既存のインタラクション処理と統合する形でOnChartEventハンドラを拡張します。まず、CHARTEVENT_MOUSE_MOVEを確認し、マウス座標と状態を取得します。その後、新しく追加したテーマボタンを含む以前のホバー状態を保存し、Canvas上のホバー状態、isMouseOverHeaderBarによるヘッダーバー上のホバー状態、isMouseOverThemeButtonによるテーマボタン上のホバー状態、isMouseInResizeZoneによるリサイズ領域内の状態状態フラグを更新します。その後、いずれかのホバー状態に変化があるかを確認し、再描画が必要かどうかを判定します。
マウス押下時(状態が1、前回状態が0)の場合、まずテーマボタン上にホバーしているかを確認します。テーマボタン上であれば、isCyberpunkThemeEnabledを切り替え、renderVisualizationで再描画処理を実行し、チャートを更新します。テーマボタン上ではない場合は、既存のドラッグ処理を確認します。ドラッグが有効で、ヘッダー上にホバーしており、かつリサイズ状態ではない場合は、ドラッグ用フラグを設定し、開始位置を保存してスクロールを無効化します。また、再描画が必要であることを示すフラグを設定します。一方、リサイズ領域内でクリックされた場合は、リサイズモードを開始し、初期値を保存してスクロールを無効化します。マウス押下状態が継続している場合(状態が1、前回状態も1)は、現在の操作状態に応じて処理を分岐します。具体的には、ドラッグ中の場合はhandleCanvasDragを呼び出し、サイズ変更中の場合はhandleCanvasResizeを呼び出します。マウスボタンを離した場合(状態が0、以前の状態が1の場合)は、各フラグをリセットし、リサイズモードを初期状態に戻します。その後、ChartSetIntegerでチャートスクロールを再度有効化し、再描画フラグを設定します。再描画が必要な場合は、「renderVisualization」関数と「ChartRedraw」関数を呼び出します。最後に、次回の処理に備えて、現在のマウス位置と以前のマウス状態を更新します。変更箇所を明確にするため、該当部分をハイライトしています。コンパイルすると、次の結果が得られます。

可視化した結果を見ると、回帰プロットにサイバーパンクテーマを追加することで機能を強化し、目的を達成できていることが確認できます。残る作業はシステムの動作検証であり、これは次のセクションで扱います。
バックテスト
テストを実施しました。以下はビジュアルを単一のGraphics Interchange Format (GIF)画像としてまとめたものです。
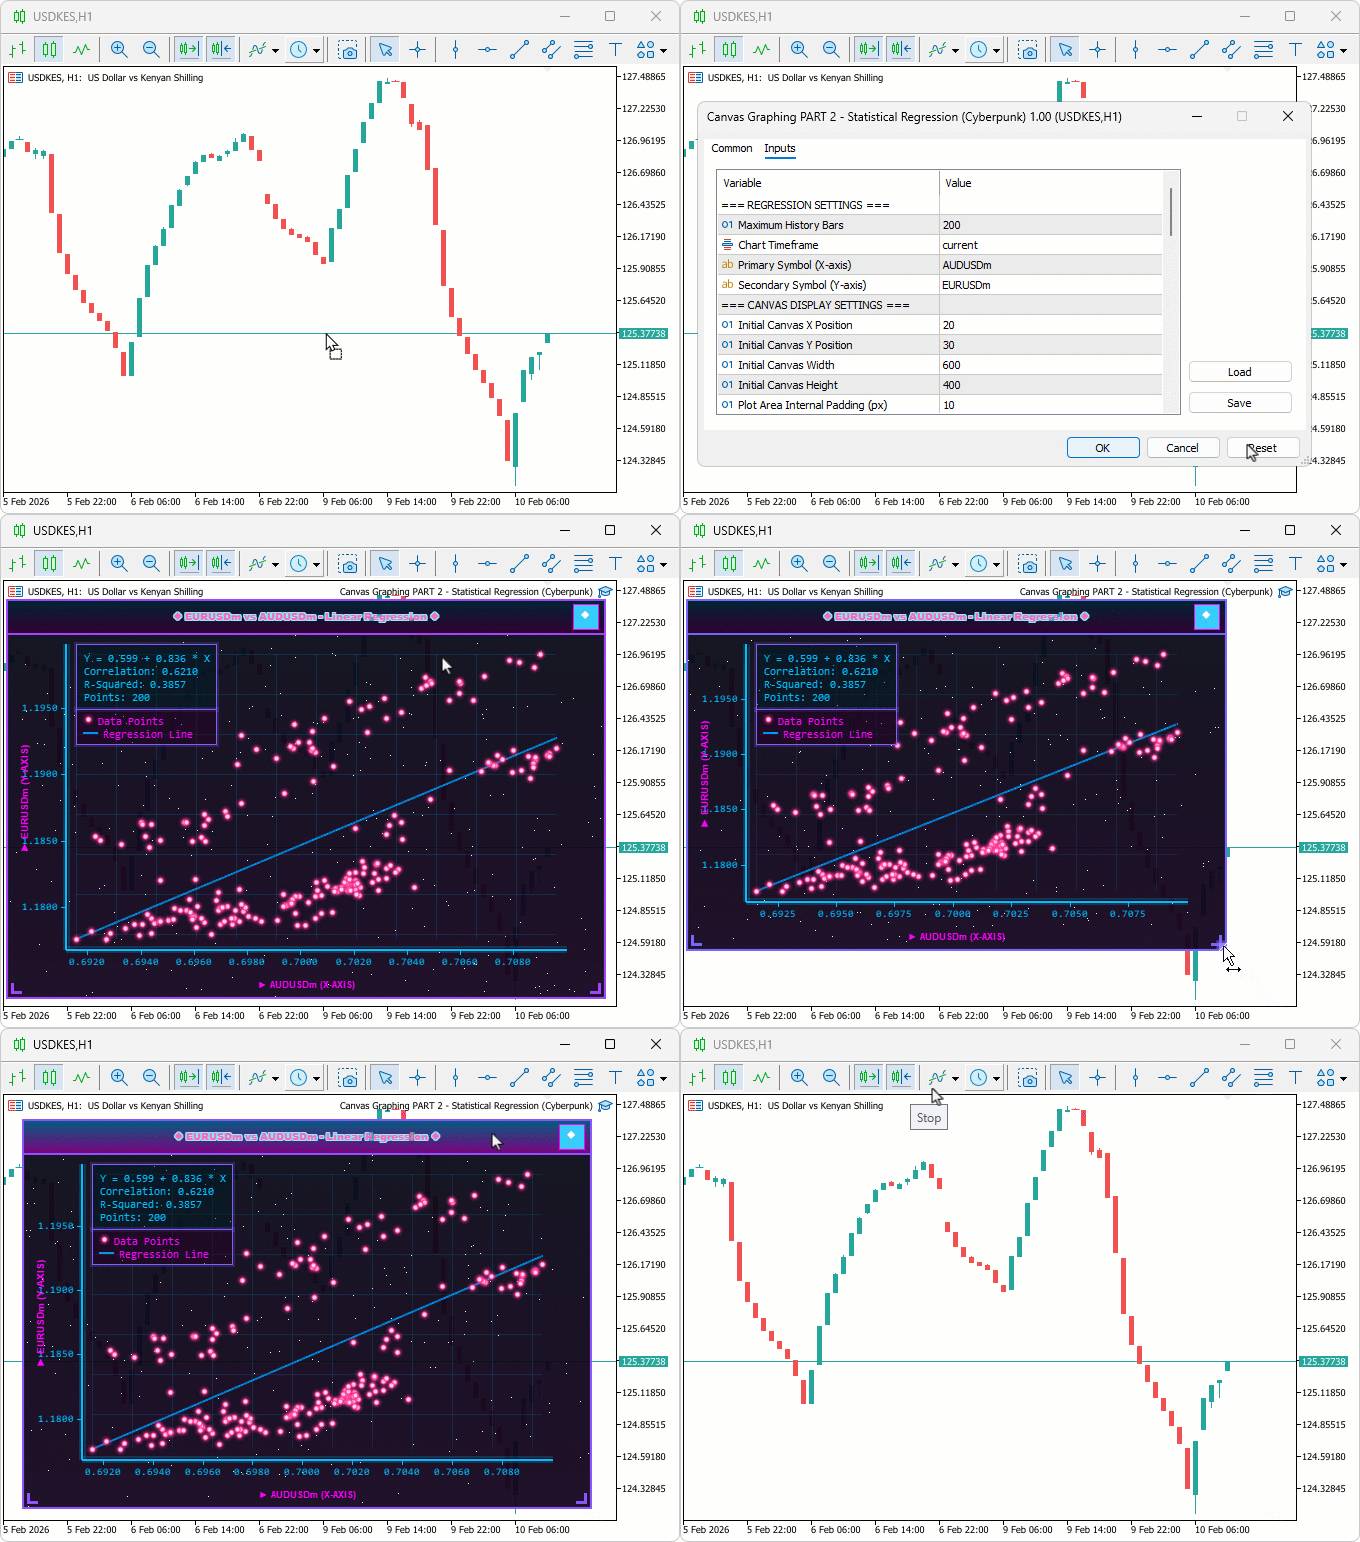
テストでは、テーマ切り替えが遅延なく即座に動作し、モード変更がスムーズに反映されることを確認しました。また、ネオングローによってデータポイントが強調表示され、外れ値をより明確に検出できるようになりました。さらに、アニメーションはフレーム更新と同期してパルス表示され、滑らかなパフォーマンスを維持しました。
結論
結論として、MQL5の回帰グラフ描画ツールにサイバーパンクテーマモードを追加し、ネオングロー、アニメーション、ホログラフィックエフェクトによる没入感のあるビジュアライゼーションを実現しました。テーマ切り替え機能、星を含む動的背景、発光する枠線、ネオンポイントやネオンラインを統合しながら、標準モードとの互換性も維持しています。このデュアルテーマシステムにより、リアルタイム更新やインタラクティブな操作に対応しながら、未来的なデザインでペア分析をより魅力的に行えるようになります。この記事を読み終えた後は、以下のことができるようになります。
- チャート上でテーマを切り替え、異なる照明環境に合わせた視認性を確保する
- ネオンポイントを利用して、相関関係の変化や偏差を素早く検出する
- パルスするライン表示を、ペアトレードにおける傾きの強さを示す視覚的な指標として活用する
前述の部分では、統計分布モデルのグラフ化と、棒グラフによるプロットについて検討します。どうぞお楽しみに。
MetaQuotes Ltdにより英語から翻訳されました。
元の記事: https://www.mql5.com/en/articles/21306
警告: これらの資料についてのすべての権利はMetaQuotes Ltd.が保有しています。これらの資料の全部または一部の複製や再プリントは禁じられています。
この記事はサイトのユーザーによって執筆されたものであり、著者の個人的な見解を反映しています。MetaQuotes Ltdは、提示された情報の正確性や、記載されているソリューション、戦略、または推奨事項の使用によって生じたいかなる結果についても責任を負いません。

 プライスアクション分析ツールキットの開発(第62回):MQL5による適応型平行チャネル検出とブレイクアウトシステムの構築
 初心者からエキスパートへ: トレンドフィルタによる流動性戦略の拡張
 共和分株式による統計的裁定取引(最終回):特化型データベースを用いたデータ分析
 MQL5でのスイング極値とプルバック(第2回):EAによる戦略の自動化

- 無料取引アプリ
- 8千を超えるシグナルをコピー
- 金融ニュースで金融マーケットを探索