Volume Equilibrium

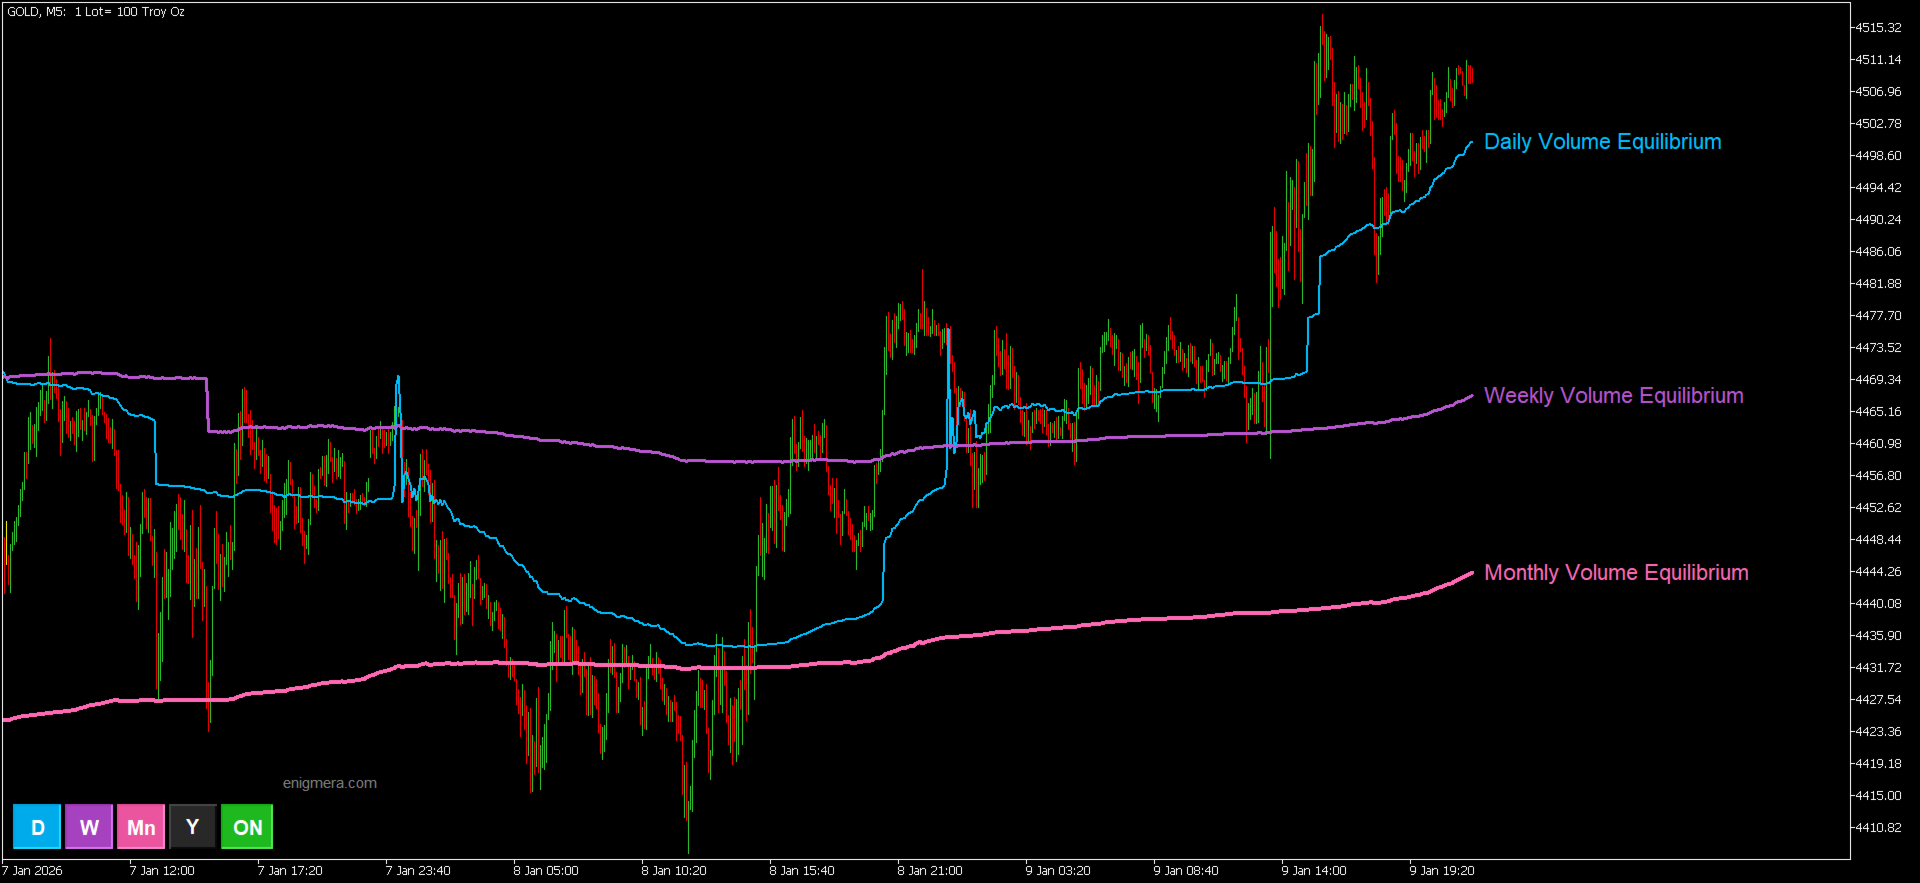
L’indicatore Volume Equilibrium mostra i livelli in cui il volume rialzista è uguale al volume ribassista. Può calcolare questi livelli per ogni giorno, settimana, mese e anno.

Quando il prezzo si trova sopra la linea, significa che il volume è dalla parte dei compratori e il mercato è rialzista. Quando il prezzo si trova sotto la linea, significa che il volume è dalla parte dei venditori e il mercato è ribassista.

L’indicatore utilizza l’algoritmo dell’indicatore “Meravith” per calcolare i livelli. I livelli di volume sono calcolati con grande precisione. L’indicatore funziona automaticamente e può essere utilizzato su qualsiasi timeframe.

Per ogni linea sono presenti dei pulsanti, così potete scegliere quali livelli di equilibrio del volume visualizzare. È inoltre presente un pulsante per mostrare o nascondere l’intero indicatore.

Per risultati più accurati, si consiglia di utilizzare un broker grande con molti clienti, perché i broker mostrano solo il volume dei propri clienti.


Prodotti consigliati
RAD CRITICAL LEVES RAD indicator tracks “Relevant Volume” in real time, identifying accumulation and distribution processes, projecting them in the chart as SUPPORT or RESISTANCE zones. Natural   support   and resistance levels are generated by Volume Accumulation and Distribution processes. As these processes evolve, levels at which the relevant volume in the market place is positioned, become difficult areas to cross upwards or downwards. By using this information, traders can identify very s
This product is designed for the MT5 platform and offers two key features: VWAP (Volume Weighted Average Price) calculation and Volume Profile analysis. Advantages: VWAP Calculation: The product calculates the VWAP, which is a popular indicator used by traders to determine the average price of a security based on its trading volume. It helps identify potential buying or selling opportunities by comparing the current price to the average price weighted by volume. Volume Profile Analysis: The prod
Questo indicatore si basa sulla trasformata discreta di Hartley. L'utilizzo di questa trasformazione consente di applicare approcci diversi durante l'elaborazione di serie temporali finanziarie. Una caratteristica distintiva di questo indicatore è che le sue letture si riferiscono non a un punto del grafico, ma a tutti i punti del periodo dell'indicatore. Durante l'elaborazione di una serie storica, l'indicatore consente di selezionare vari elementi della serie storica. La prima possibilità di
Manyal trading system, CovEchoTrend Robot, focuses on reliability and flexibility. By employing statistical analysis methods to study the relationships between the base indicator and market patterns, the system enables a deeper understanding of market processes. Intelligent pattern analysis: The application of statistical data processing helps identify key trend reversal points more accurately, signaling significant market shifts. Informed decision-making is based on the intersection of indicato
Breakout Boxes with Volume Pressure This indicator automates the identification of key consolidation zones (Supply and Demand) based on Market Pivots and Volatility (ATR). Unlike standard support/resistance tools, this indicator provides a unique   Volume Pressure Analysis   inside every box, giving you insight into the battle between Buyers and Sellers before a breakout occurs. Key Features Automated Supply & Demand Zones:   Automatically detects significant Pivot Highs and Lows to draw dyna
Limitless MT5
Dmitriy Kashevich
Limitless MT5 is a universal indicator suitable for every beginner and experienced trader. works on all currency pairs, cryptocurrencies, raw stocks Limitless MT5 - already configured and does not require additional configuration And now the main thing Why Limitless MT5? 1 complete lack of redrawing 2 two years of testing by the best specialists in trading 3 the accuracy of correct signals exceeds 80% 4 performed well in trading during news releases Trading rules 1 buy signal - the ap
Was: $249  Now: $99   Market Profile defines a number of day types that can help the trader to determine market behaviour. A key feature is the Value Area, representing the range of price action where 70% of trading took place. Understanding the Value Area can give traders valuable insight into market direction and establish the higher odds trade. It is an excellent addition to any system you may be using. Inspired by Jim Dalton’s book “Mind Over Markets”, this indicator is designed to suit the
Cycles Forecast
Pooriya Alirezaee
This indicator is based on a mathematical formula and an ANN combined, designed to make a model(using previous prices) of the most recent market condition (any chart*) in order to use the model as a forecasting tool. *This indicator can operate on any chart/timeframe, but it's suggested you use multiple timeframes for each trade because this method relies solely on the time factor, you can not use this indicator to predict price volatility, but if it's fit correctly it will show you when the nex
Volume Profile Trading System is NOT just another volume indicator. It's a   complete trading ecosystem   that combines professional volume profile visualization with an intelligent automated trading strategy.  While other indicators show you   WHERE   volume is concentrated, Volume Profile Trading System  shows you   WHERE ,   WHEN , and   HOW   to trade it! displaying real volume distribution by price instead of time. It helps traders identify fair value zones, institutional activity, and high
VolumeDeltaWaves
Stanislav Korotky
This indicator is an extended implementation of Weis waves. It builds Weis waves on absolute volumes (which is the classical approach) or delta of volumes (unique feature) using different methods of wave formation and visualization. It works with real volumes, if available, or with tick volumes otherwise, but also provides an option to use so called "true volume surrogates", as an artificial substitution for missing real volumes (for example, for Forex symbols), which was introduced in correspo
The Expert Advisor and the video are attached in the Discussion tab . The robot applies only one order and strictly follows the signals to evaluate the indicator efficiency. Pan PrizMA CD Phase is an option based on the Pan PrizMA indicator. Details (in Russian). Averaging by a quadric-quartic polynomial increases the smoothness of lines, adds momentum and rhythm. Extrapolation by the sinusoid function near a constant allows adjusting the delay or lead of signals. The value of the phase - wave s
Adjustable Consecutive Fractals  looks for 2 or more fractals in one direction and sends out a on screen alert, sound alert and push notification, for strong reversal points . Adjustable Consecutive Fractals, shows the fractals on chart along with a color changing text for buy and sell signals when one or more fractals appear on one side of price. Adjustable Consecutive Fractals is based Bill Williams Fractals . The standard Bill Williams fractals are set at a non adjustable 5 bars, BUT withe th
Ugenesys AI MT5
Odaine Ramon Mcmillan
uGenesys AI - 90% Accurate Daytrading Indicator Introducing the ultimate forex trading indicator system, uGenesys AI, powered by cutting-edge AI technology and advanced analytical techniques, including Time-Series Analysis and Genetic Algorithms. Our AI-powered trading system leverages the power of time-series analysis to identify trends and patterns in historical price data, allowing traders to make informed predictions about future market movements. By analyzing vast amounts of data, our syst
MarketMagnet
Kelly Adediran Raymond
Are you ready to take your trading journey to new heights? Look no further than MarketMagnet, this groundbreaking indicator designed to propel your trading success with excitement and accuracy. Powered by the convergence of Momentum and CCI (Commodity Channel Index), MarketMagnet equips traders with the ultimate tool to determine direction and entry prices for a wide range of recommended currency pairs and instruments. It is designed for traders seeking to scalp for a few pips on lower timeframe
Based on the trading model/strategy/system of gold double-position hedging and arbitrage launched by Goodtrade Brokers, problems encountered in daily operations: 1. Account B immediately places an order immediately following account A. 2: After account A places an order, account B will automatically copy the stop loss and take profit. 3: Account A closes the position of Account B and closes the position at the same time. 4: When account B closes the position, account A also closes the position.
Frontier Pivots
Nestor Jose Mendez Boza
FRONTIER PIVOTS - Geometric Levels Indicator This indicator plots support and resistance levels/ranges on the chart using mathematical calculations. It helps traders identify potential price reaction zones based on geometric patterns. Main Features: Automatically calculates and displays key price levels Plots both support and resistance lines Uses daily price data for level calculation Clean visual presentation with different colors for different level types No repainting - levels remain static
Epic Sails PRO is a clean, session-anchored VWAP indicator designed to provide a clear institutional price framework — not trade signals. It plots a stable VWAP with non-overlapping volatility bands and a real-time VWAP angle (in degrees) to help traders assess directional bias, slope strength, and market state. This tool is ideal for traders who prefer structure, context, and mechanical confirmation over subjective indicators. Key Features Session-anchored VWAP (resets at user-defined session s
Rocket Trend
Andriy Sydoruk
The Rocket Trend indicator is trending. The indicator draws two-color points connected by lines along the chart. This is a trend indicator, it is an algorithmic indicator. It is easy to work and understand when a blue circle appears, you need to buy, when a red one appears, sell. The indicator is used for scalping and pipsing, and has proven itself well. Rocket Trend is available for analyzing the direction of the trend for a specific period of time. Ideal for novice traders learning the laws o
M & W Pattern Pro is an advanced scanner for M and W patters , it uses extra filters to ensure scanned patterns are profitable. The indicator can be used with all symbols and time frames. The indicator is a non repaint indicator with accurate statistics calculations. To use , simply scan the most profitable pair using the statistics dashboard accuracy , then enter trades on signal arrow and exit at the TP and SL levels. STATISTICS : Accuracy 1 : This is the percentage of the times price hits TP
Do you use volume in your reading of the market? Certainly many traders use it, and do not imagine operating without it. The Color Histogram Volume Set indicator allows the user to choose the value that he considers interesting to monitor. When you pass this you will have visual confirmation and if you want you will also have the audible alert that is given by the indicator. Of course, there are other ways to try to find a high volume, such as assessing whether the volume is above av
place a vwap line starting from the line placed on the chart parameters: tick_mode: enable to use ticks instead of bars. this uses a lot more cpu processing power prefix: prefix to add for line created by indicator line_color: set the color of the line created line_style: set the line style of the line created applied_price: set the price of bar to use of the bar std_dev_ratio: set the multiplier for the std dev channel
Fixed Range Volume Profile MT5
Abdelkhabir Yassine Alaoui
Profilo del volume a intervallo fisso automatico con avvisi per MT5 Questo indicatore mostra dove il prezzo ha trascorso più tempo, evidenziando livelli importanti che possono essere utilizzati nel trading. e può mostrare la densità dei prezzi nel tempo, delineando i livelli di prezzo più importanti, l'area di valore e il valore di controllo di una determinata sessione di negoziazione. Questo indicatore può essere collegato a intervalli di tempo tra M1 e D1 e mostrerà il profilo di mercato pe
BoxProfile MT5
Evgeny Shevtsov
4.6 (10)
The indicator displays volume profiles based on the nesting principle. Profiles periods are pre-set so that each subsequent profile has a length twice as long as the length of the previous profile. In addition to profiles, the indicator displays volume clusters sorted by color, depending on the volume they contain. Indicator operation features The indicator works on typical timeframes from M5 to MN, but for calculations uses historical data from smaller timeframes: M1 - for timeframes from M5
FREE
L'indicateur SMC Venom Model BPR est un outil professionnel pour les traders travaillant dans le concept Smart Money (SMC). Il identifie automatiquement deux modèles clés sur le graphique des prix: FVG   (Fair Value Gap) est une combinaison de trois bougies, dans laquelle il y a un écart entre la première et la troisième bougie. Forme une zone entre les niveaux où il n'y a pas de support de volume, ce qui conduit souvent à une correction des prix. BPR   (Balanced Price Range) est une combinaiso
Manus Pro
Itumeleng Mohlouwa Kgotso Tladi
MANUS PRO EA The Trading Revolution You've Been Waiting For Are you TIRED of watching other traders make consistent profits while your account bleeds red?   The financial markets don't wait for anyone – and neither should you. MANUS PRO isn't just another Expert Advisor... it's your   TICKET TO FINANCIAL FREEDOM . Why MANUS PRO is Different (And Why Everyone's Talking About It) FOR BEGINNERS: Your Trading Mentor That Never Sleeps Zero Learning Curve   – Install, activate, and watch it wo
MTF VWAP Indicator - Quick Overview   This indicator shows you where institutional money is flowing across multiple timeframes using Volume Weighted Average Price (VWAP) to identify high-probability trading zones.     What It Actually Does:     1. Tracks Smart Money Levels: - Shows Daily, Weekly, and Monthly VWAP lines where big players (banks, funds) are trading - Tells you if price is above or below these key institutional levels - Shows distance from VWAP as a percentage (tells you how extend
First time on MetaTrader, introducing IQ Star Lines - an original Vedic Astrology based indicator. "Millionaires don't use astrology, billionaires do" . - J.P. Morgan, Legendary American financier and banker. IQ Star Lines, an unique astrological indicator purely based on   Vedic astrology   calculations, published for the   first time on Metatrader.  This unique tool plots dynamic planetary grid lines based on real-time stars, constellations, and celestial movements, which allows you to plot t
Trend and Signals MT5  indicator scans  30 trading Instruments (Forex, Metals and Indices).     It uses special algorithm on the  current market   based on   Pure Price Action   and display the overall trend and signal on the dashboard. When signals are produced the indicator sends alert and notification. Strategy for Signals This indicator uses the daily timeframe to determine the direction of the trend. The hourly timeframe is used to identify possible entries. Main trend and is determined by
Gioteen Volatility Index (GVI) - your ultimate solution to overcoming market unpredictability and maximizing trading opportunities. This revolutionary indicator helps you in lowering your losing trades due to choppy market movements. The GVI is designed to measure market volatility, providing you with valuable insights to identify the most favorable trading prospects. Its intuitive interface consists of a dynamic red line representing the volatility index, accompanied by blue line that indicate
Hurst buy and sell
Victor Alfonso Molina Botello
Hurst Buy and Sell This innovative indicator, inspired by xAI Grok intelligence, uses the Hurst exponent to identify the nature of the market and generate buy/sell signals. The EA for this indicator (Hurst Razer PRO EA MT5) is now available, you can see it by clicking here!  https://www.mql5.com/es/market/product/153441?source=Site+Profile+Seller  If you want more signals from the indicator, change the minimum number of bars between consecutive signals. The lower the value, the more signals it
Gli utenti di questo prodotto hanno anche acquistato
Azimuth Pro
Ottaviano De Cicco
5 (1)
LAUNCH PROMO Azimuth Pro price is initially set at 299$ for the first 100 buyers. Final price will be 499$ . THE DIFFERENCE BETWEEN RETAIL AND INSTITUTIONAL ENTRIES ISN'T THE INDICATOR — IT'S THE LOCATION. Most traders enter at arbitrary price levels, chasing momentum or reacting to lagging signals. Institutions wait for price to reach structured levels where supply and demand actually shift. Azimuth Pro maps these levels automatically: swing-anchored VWAP, multi-timeframe structure lines, an
Ottieni l’indicatore AUX GRATUITO e il supporto EA Download diretto — Clicca qui [ D.I.C.E ] The DICE Indicator  Divergence in Chaos Environment è uno strumento MT5 specializzato per trader che applicano la Teoria delle Onde di Elliott nel contesto delle tecniche di Trading Chaos. Identifica divergenze nascoste e regolari nell’azione dei prezzi, sincronizzate con l’ambiente di mercato caotico descritto da Bill Williams. Caratteristiche principali Divergenza allineata alle Onde di Elliott: rilev
Rtc ML Ai Predictor
Muhammad Faisal Sagala
Rtc ML Ai | Predictor CORE MACHINE LEARNING ENGINE Adaptive ML Market Predictor – Multi-Bar Trend & Candle Forecast What This Indicator Does This indicator is a  real-time market prediction engine  designed to analyze price behavior and estimate  future market tendencies . Unlike conventional indicators, this system  does not rely on static parameters or historical curve-fitting , but adapts its internal state dynamically during live market operation. Instead of using static rules, the indic
Innanzitutto, vale la pena sottolineare che questo Strumento di Trading è un Indicatore Non-Ridipingente, Non-Ridisegnante e Non-Laggante, il che lo rende ideale per il trading professionale. Corso online, manuale utente e demo. L'Indicatore Smart Price Action Concepts è uno strumento molto potente sia per i nuovi che per i trader esperti. Racchiude più di 20 utili indicatori in uno solo, combinando idee di trading avanzate come l'Analisi del Trader del Circolo Interno e le Strategie di Tradin
L'indicatore " Dynamic Scalper System MT5 " è progettato per il metodo di scalping, ovvero per il trading all'interno di onde di trend. Testato sulle principali coppie di valute e sull'oro, è compatibile con altri strumenti di trading. Fornisce segnali per l'apertura di posizioni a breve termine lungo il trend, con ulteriore supporto al movimento dei prezzi. Il principio dell'indicatore. Le frecce grandi determinano la direzione del trend. Un algoritmo per generare segnali per lo scalping sott
Berma Bands
Muhammad Elbermawi
5 (7)
L'indicatore Berma Bands (BBs) è uno strumento prezioso per i trader che cercano di identificare e capitalizzare i trend di mercato. Analizzando la relazione tra il prezzo e le BBs, i trader possono discernere se un mercato è in una fase di trend o di range. Visita il [ Berma Home Blog ] per saperne di più. Le Berma Bands sono composte da tre linee distinte: la Upper Berma Band, la Middle Berma Band e la Lower Berma Band. Queste linee sono tracciate attorno al prezzo, creando una rappresentazion
Weis Wave with Alert MT5
Trade The Volume Waves Single Member P.C.
4.94 (17)
Rental/Lifetime Package Options and Privileges  Rent Monthly Six Months   Yearly/Lifetime Weis Wave with Speed with Alert+Speed Index x x x Manual  x x x Quick Set up Video x x x Blog x x x Lifetime Updates x x x Setup and Training Material x x Discord Access Channel "The SI traders"          x Rectangle Break Alert Tool      x How to trade with it:    http://www.tradethevolumewaves.com   ** If you purchase please contact me to setup your  : Training Room and  complete manual access.  Wei
MetaForecast M5
Vahidreza Heidar Gholami
5 (3)
MetaForecast predice e visualizza il futuro di qualsiasi mercato basandosi sull'armonia dei dati dei prezzi. Sebbene il mercato non sia sempre prevedibile, se esiste un modello nei prezzi, MetaForecast può prevedere il futuro con la massima precisione possibile. Rispetto ad altri prodotti simili, MetaForecast può generare risultati più accurati analizzando le tendenze di mercato. Parametri di input Past size (Dimensione passata) Specifica il numero di barre che MetaForecast utilizza per creare
ARIPoint
Temirlan Kdyrkhan
1 (1)
ARIPoint is a powerful trading companion designed to generate high-probability entry signals with dynamic TP/SL/DP levels based on volatility. Built-in performance tracking shows win/loss stats, PP1/PP2 hits, and success rates all updated live. Key Features: Buy/Sell signals with adaptive volatility bands Real-time TP/SL/DP levels based on ATR Built-in MA Filter with optional ATR/StdDev volatility Performance stats panel (Success, Profit/Loss, PP1/PP2) Alerts via popup, sound, push, or email Cu
Elliott Wave Trend was designed for the scientific wave counting. This tool focuses to get rid of the vagueness of the classic Elliott Wave Counting using the guideline from the template and pattern approach. In doing so, firstly Elliott Wave Trend offers the template for your wave counting. Secondly, it offers Wave Structural Score to assist to identify accurate wave formation. It offers both impulse wave Structural Score and corrective wave Structure Score. Structural Score is the rating to sh
How many times have you bought a trading indicator with great back-tests, live account performance proof with fantastic numbers and stats all over the place but after using it, you end up blowing your account? You shouldn't trust a signal by itself, you need to know why it appeared in the first place, and that's what RelicusRoad Pro does best! User Manual + Strategies + Training Videos + Private Group with VIP Access + Mobile Version Available A New Way To Look At The Market RelicusRoad is the
SynaptixQuant Dominance Matrix
Devie Arevalo Montemayor
5 (1)
SynaptixQuant Dominance Matrix: Institutional-Grade Market State Extraction Engineered for traders who require a data-driven view of market behaviour beyond surface-level indicators. The Synaptix Quant (SQ) Dominance Matrix is not a conventional currency strength display. Behind its intentionally streamlined interface runs a sophisticated analytical architecture designed to quantify market conditions with precision. Every output is generated through layered signal processing built to identify d
FootprintOrderflow
Jingfeng Luo
5 (3)
FOOTPRINTORDERFLOW: The Authoritative Guide ( This indicator is also compatible with economic providers that do not offer DOM data and BID/ASK data, It also supports various foreign exchange transactions, DEMO version,modleling must choose " Every tick based on real ticks"  ) 1. Overview FOOTPRINTORDERFLOW  is an advanced Order Flow analysis tool designed for MetaTrader 5 (MT5). Unlike traditional candlestick charts that only show OHLC (Open, High, Low, Close), this indicator parses real-time Ti
Prices move for many reasons and these can vary from one operator to another: software, private and institutional traders simultaneously contribute to the formation of the price, making predictive art very difficult. However, there are measurable factors that bind the price to an underlying trend in line with the physical reality that the financial asset represents: these are the macroeconomic indicators. Large investors use this information wisely to set their strategies. Understanding these m
Max Ribbon Mt5
Stefano Frisetti
ATTENZIONE: Questo indicatore è distribuito ESCLUSIVAMENTE su MQL5.com Versione MT4:   https://www.mql5.com/it/market/product/160363 Versione MT5:   https://www.mql5.com/it/market/product/160410 ================================================================================ MAX RIBBON ver 1.00 L'indicatore che ti mostra il TREND in modo chiaro e inequivocabile! ================================================================================ DESCRIZIONE MAX RIBBON è un indicatore di trend
Matreshka
Dimitr Trifonov
5 (2)
Matreshka self-testing and self-optimizing indicator: 1. Is an interpretation of the Elliott Wave Analysis Theory. 2. Based on the principle of the indicator type ZigZag, and the waves are based on the principle of interpretation of the theory of DeMark. 3. Filters waves in length and height. 4. Draws up to six levels of ZigZag at the same time, tracking waves of different orders. 5. Marks Pulsed and Recoil Waves. 6. Draws arrows to open positions 7. Draws three channels. 8. Notes support and re
CGE Trading Suite
Carl Gustav Johan Ekstrom
5 (1)
CGE Trading Suite is a market analysis system designed to eliminate guesswork from trading. It continuously adapts to real-time price behavior, helping traders stay aligned with key market levels and evolving market conditions. This comprehensive system integrates multiple analytical tools into a single workflow, including dynamic grid mapping, liquidity behavior analysis, ECM, trend lines, supply and demand zones, MIDAS, trade cycles, and directional channel projections. Together, these tools p
Bill Williams Advanced
Siarhei Vashchylka
5 (10)
Bill Williams Advanced is designed for automatic chart analysis using Bill Williams' "Profitunity" system. The indicator analyzes four timeframes at once. Manual (Be sure to read before purchasing) Advantages 1. Analyzes the chart using Bill Williams' "Profitunity" system. Signals are displayed in a table in the corner of the screen and on the price chart. 2. Finds all known AO and AC signals, as well as zone signals. Equipped with a trend filter based on the Alligator. 3. Finds "Divergence Bar
TrendMaestro5
Stefano Frisetti
Attenzione alle truffe, questo indicatore e' distribuito esclusivamente su MQL5.com nota: questo indicatore e' per METATRADER5, se vuoi la versione per  METATRADER4 questo e' il link:   https://www.mql5.com/it/market/product/108106 TRENDMAESTRO ver 2.5 TRENDMAESTRO   riconosce un nuovo TREND sul nascere, non sbaglia mai. La sicurezza di identificare un nuovo TREND non ha prezzo. DESCRIZIONE TRENDMAESTRO identifica un nuovo TREND sul nascere, questo indicatore prende in esame la volatilita' i
VTrende Pro
Andrii Diachenko
5 (1)
VTrende Pro - MTF indicator for trend trading with a display panel for MT5 *** Videos can be translated into any language using subtitles (video language - Russian) Although the signals of the VTrende Pro indicator can be used as signals of a full-fledged trading system, it is recommended to use them in conjunction with the Bill Williams TS. VTrende Pro is an extended version of the VTrende indicator. Difference between Pro version and VTrende: - Time zones - Signal V - signal 1-2 waves -    S
Step into the world of Forex trading with confidence, clarity, and precision using Gold Indicator a next-generation tool engineered to take your trading performance to the next level. Whether you’re a seasoned professional or just beginning your journey in the currency markets, Gold Indicator equips you with powerful insights and help you trade smarter, not harder. Built on the proven synergy of three advanced indicators, Gold Indicator focuses exclusively on medium and long-term trends elimina
+++++++++++++++++++++++++++++++++++++++++++++++++++++++++++++++++++++++++++++++++++++++++++++++++ +++ Link to EURUSD Only Free Version -->  https://www.mql5.com/en/market/product/156904?source=Unknown +++++++++++++++++++++++++++++++++++++++++++++++++++++++++++++++++++++++++++++++++++++++++++++++++ Hallo Trader, This is a traditional GANN & FIBONACCI strategy based on detection of an impulsive move in the opposite direction. This is called a Breakout. At the moment of Breakout, the indicator draw
WanaScalper
Isaac Wanasolo
1 (1)
A scalping indicator based on mathematical patterns, which on average gives signals with relatively small SL, and also occasionally helps to catch big moves in the markets (more information in the video) This indicator has three main types of notifications: The first type warns of a possible/upcoming signal on the next bar The second type indicates the presence of a ready signal to enter the market/open a position The third type is for SL and TP levels - you will be notified every time price re
Stop calculating lot sizes manually. Stop guessing your Risk/Reward ratio. The Risk Reward Tool brings the intuitive, visual trading style of TradingView directly to your MetaTrader 5 charts. It is designed for traders who value speed, precision, and visual clarity. Whether you trade Forex, Indices (DAX, US30), or Commodities (Gold, Oil), this tool handles the math for you. Simply click "Long" or "Short," drag the lines to your levels, and the tool instantly tells you exactly how many lots to t
Orderflow Scalp Pro v2.4   delivers institutional-grade trading intelligence through advanced volume analysis, dynamic VWAP calculations, real-time aggressive score monitoring, and precision arrow signals. This complete trading system transforms complex market data into clear, actionable signals for consistent profitability on 3-4 minute timeframes. Full Documentation: [Download PDF] Four Powerful Components in One System Volume Profile HeatMap with POC/VAH/VAL Transform your charts into inst
MR Reversal Patterns 5
Sergey Khramchenkov
5 (2)
In the "Masters of Risk" trading system, one of the main concepts is related to places where markets change direction. In fact, this is a change in priority and a violation of the trend structure at the extremes of the market, where supposedly there are or would be stop-losses of "smart" participants who are outside the boundaries of the accumulation of volume. For this reason, we call them "Reversal Patterns" - places with a lot of weight for the start of a new and strong trend. Some of the imp
MonsterDash Harmonics Indicator is a harmonic pattern dashboard. It recognizes all major patterns. MonsterDash is a dashboard that displays all detected patterns for all symbols and (almost) all timeframes in sortable and scrollable format. Users can add their own user defined patterns . MonsterDash can open and update charts with the pattern found. Settings MonsterDash's default settings are good enough most of the time. Feel free to fine tune them to your needs. The color settings are for tho
Hyperbolic
Konstantin Gruzdev
The indicator is stable on noise fluctuations in price and quickly reacts to the trend. It is based on an algorithm from a system of hyperbolic functions that allows you to aggressively smooth the flat with minimal lag on the trend. It can be applied directly to the price chart, to itself, or to other indicators in order to eliminate false signals. The main purpose of the indicator is to smooth out small sawtooth price movements as much as possible. The higher the Hyperbolic parameter, the stron
This indicator belongs to the family of channel indicators. These channel indicator was created based on the principle that the market will always trade in a swinging like pattern. The swinging like pattern is caused by the existence of both the bulls and bears in a market. This causes a market to trade in a dynamic channel. it is designed to help the buyer to identify the levels at which the bulls are buying and the bear are selling. The bulls are buying when the Market is cheap and the bears a
Ottieni l’indicatore AUX GRATUITO, il supporto EA e la guida completa, visita per favore – https://www.mql5.com/en/blogs/post/763955 Individua la tendenza. Leggi il pattern. Cronometra l'ingresso. 3 passaggi in meno di 30 secondi! Opera senza sforzo — nessuna analisi richiesta, il tuo assistente intelligente è pronto a semplificare il tuo flusso di lavoro Basta sovraccarico di grafici. Opera con fiducia utilizzando il rilevamento intelligente del bias. Compatibile con tutte le valute, criptova
Altri dall’autore
Meravith AUTO
Ivan Stefanov
5 (1)
Meravith Auto è una versione automatizzata del sistema di trading Meravith. L'indicatore è composto da una linea di tendenza che cambia colore. Quando è rialzista è verde, quando è ribassista è rossa. Questa è la linea di supporto del trend. Una linea di liquidità, dove il volume rialzista è uguale al volume ribassista. Una linea di deviazione rialzista tripla. Una linea di deviazione ribassista tripla. Punti viola e blu che indicano un volume elevato. Il punto viola indica un volume maggiore di
Meravith
Ivan Stefanov
5 (1)
L'indicatore analizza il volume da ogni punto e calcola i livelli di esaurimento del mercato per quel volume. È composto da tre linee: Linea di esaurimento del volume rialzista Linea di esaurimento del volume ribassista Una linea che indica la tendenza del mercato. Questa linea cambia colore per riflettere se il mercato è rialzista o ribassista. Puoi analizzare il mercato da qualsiasi punto di partenza tu scelga. Una volta che una linea di esaurimento del volume è raggiunta, identifica un nuovo
Meravith Auto è una versione automatizzata del sistema di trading Meravith. L'indicatore è composto da una linea di tendenza che cambia colore. Quando è rialzista è verde, quando è ribassista è rossa. Questa è la linea di supporto del trend. Una linea di liquidità, dove il volume rialzista è uguale al volume ribassista. Una linea di deviazione rialzista tripla. Una linea di deviazione ribassista tripla. Punti viola e blu che indicano un volume elevato. Il punto viola indica un volume maggiore di
MACD divergency
Ivan Stefanov
5 (4)
Questo indicatore identifica con precisione le divergenze rialziste e ribassiste tra i movimenti di prezzo e l’istogramma MACD, utilizzando medie mobili esponenziali (EMA) con periodi di 5 (veloce) e 34 (lenta) e una linea di segnale con periodo 5. L’indicatore mette in evidenza i punti in cui il momentum si indebolisce, segnalando possibili inversioni di trend. Regole per la corretta identificazione delle divergenze La divergenza rialzista è valida quando il prezzo forma massimi crescenti e l’i
FREE
Questo indicatore è uno strumento interattivo di etichettatura delle Onde di Elliott per MetaTrader 4 e 5. Consente all’utente di posizionare manualmente le etichette delle onde direttamente sul grafico, selezionando la dimensione dell’etichetta, il colore e il tipo di onda (correzioni ABC, impulsi a 5 onde o strutture WXY) da un menu sul grafico. Con un solo clic sul grafico, l’indicatore posiziona in modo sequenziale le etichette delle onde appropriate nel prezzo e nel tempo scelti, aiutando i
FREE
Two Snakes
Ivan Stefanov
5 (1)
2 SNAKES è un sistema di scalping di prima classe. Poiché gli inserimenti sono piuttosto precisi, è probabile che diventiate dipendenti da questo sistema molto rapidamente.  Avete 2 serpenti. Quando vedete una candela al di sopra o al di sotto di esse che non le tocca, questo è il vostro segnale di scalping. Se si utilizza un time frame più ampio, lo scalping può diventare trend following. Le serpentine sono calcolate con precisione in relazione allo stato attuale del mercato. NON SONO me
Questo indicatore è uno strumento interattivo di etichettatura delle Onde di Elliott per MetaTrader 4 e 5. Consente all’utente di posizionare manualmente le etichette delle onde direttamente sul grafico, selezionando la dimensione dell’etichetta, il colore e il tipo di onda (correzioni ABC, impulsi a 5 onde o strutture WXY) da un menu sul grafico. Con un solo clic sul grafico, l’indicatore posiziona in modo sequenziale le etichette delle onde appropriate nel prezzo e nel tempo scelti, aiutando i
FREE
L’indicatore analizza il volume da qualsiasi punto e calcola i livelli di esaurimento del mercato per quel volume. Linee principali di Meravith: Linea di esaurimento del volume rialzista – funge da obiettivo. Linea di esaurimento del volume ribassista – funge da obiettivo. Linea di tendenza – indica la tendenza del mercato. Cambia colore a seconda che il mercato sia rialzista o ribassista e funge da supporto di tendenza. Come utilizzarlo: fai doppio clic sulla linea verticale viola e spostala ne
Livelli leggendari di William Gann in un indicatore MT5 completamente automatizzato. GANN Master individua le zone chiave in cui il prezzo è più probabile che si inverta o continui il trend, basandosi sui dati Daily, Weekly e Monthly. Funzionalità principali Pulsanti a clic singolo per il periodo: clicca Daily, Weekly o Monthly per tracciare istantaneamente le zone relative al giorno, alla settimana o al mese correnti Modalità Automatica e Manuale • Automatica: GANN Master calcola tutti i livell
Naturu
Ivan Stefanov
5 (1)
“Naturu” è un indicatore manuale che utilizza la simmetria della natura come algoritmo. Conquista il mercato con una strategia semplice e saggezza nascosta! Quando carichi l’indicatore, vedrai due linee: Top e Bottom. Clicca una volta su una linea per attivarla. Per spostarla, basta cliccare sulla candela dove vuoi posizionarla. Definisci un punto alto e un punto basso, e l’indicatore calcola automaticamente: Una zona magenta che mostra dove gli interessi di tori e orsi sono più vicini, ossia l
Sense
Ivan Stefanov
5 (2)
SENSE è un sistema automatizzato che combina metodi GANN selezionati con calcoli frattali. Il sistema ci dice dove aprire e chiudere le operazioni. Non è più necessario perdere tempo in calcoli complessi: SENSE fa tutto per voi. Basta installare l'indicatore. Principi di base: Il mercato è rialzista quando il prezzo è al di sopra delle linee bianche. Comprate sopra le linee bianche, fermatevi sotto Le linee verdi sono obiettivi al rialzo Il mercato è ribassista quando il prezzo è al di sott
Imbalance Pro
Ivan Stefanov
5 (4)
L'indicatore misura lo squilibrio tra tori e orsi in un periodo scelto e mostra una linea retta tra i due punti. Se i tori hanno più volume degli orsi, la linea diventa verde.  Se gli orsi hanno più volume, la linea diventa rossa. La linea mostra anche la differenza percentuale di volume. L'indicatore mostra gli stessi dati in una finestra separata. È possibile vedere anche il volume diviso. L'indicatore ha due modalità. A tale scopo, in alto a sinistra è presente un pulsante che,  - se n
Balance Levels is an easy-to-use trading indicator that provides clear buy and sell signals along with dynamic price levels, helping traders plan their entries and exits with more confidence. The tool is highly flexible – it can be used as a standalone strategy or integrated into any existing trading system. It works on all timeframes and across all markets: Forex, Gold, Indices, Crypto, or Stocks. Balance Levels suits every trading style – from scalping and intraday, to swing trading and even l
Balance Levels è un indicatore di trading facile da usare che fornisce chiari segnali di acquisto e vendita insieme a livelli di prezzo dinamici, aiutando i trader a pianificare ingressi e uscite con maggiore sicurezza. Lo strumento è molto flessibile – può essere utilizzato come strategia autonoma oppure integrato in qualsiasi sistema di trading esistente. Funziona su tutti i timeframe e su tutti i mercati : Forex, Oro, Indici, Criptovalute o Azioni. Balance Levels si adatta a ogni stile di tra
Separated Volume
Ivan Stefanov
5 (1)
Questo indicatore separa efficacemente il volume dei tick nel mercato forex in categorie rialziste e ribassiste. Inoltre, fornisce la funzionalità di calcolare e visualizzare la somma dei volumi dei tick rialzisti e ribassisti per qualsiasi periodo selezionato a scelta. È possibile regolare facilmente il periodo spostando le due linee blu sul grafico, consentendo un'analisi dei volumi personalizzabile e precisa, adatta alle proprie esigenze di trading. Se lo trovate utile, le vostre recensio
FREE
Questo indicatore si basa sull'esperienza pratica.  Inserite la data/ora del vostro top/bottom. Calcola il livello più visitato dal top/bottom fino al momento attuale. Si aggiorna automaticamente a ogni nuova candela. È possibile utilizzare contemporaneamente più indicatori per diversi trend e timeframe. La lunghezza è sempre tracciata dall'inizio del periodo fino al presente. Utile strumento PRO.
FREE
Enigmera
Ivan Stefanov
5 (8)
ENIGMERA: Il cuore del mercato Importante: La demo di MQL5.com funziona nel Strategy Tester e potrebbe non riflettere completamente le funzionalità di Enigmera. Consulta la descrizione, gli screenshot e il video per maggiori dettagli. Non esitare a inviarmi un messaggio se hai domande! Il codice dell'indicatore è stato completamente riscritto. La versione 3.0 aggiunge nuove funzionalità e corregge i bug accumulati dall'inizio dell'indicatore. Introduzione Questo indicatore e sistema di trading
Levelss
Ivan Stefanov
5 (1)
L'indicatore LEVELSS mostra: - Zona rialzista e ribassista giornaliera. È visibile tutti i giorni dalle 00:00 alle 23:59.  - La zona rialzista e ribassista settimanale. È visibile da lunedì 0:00 a venerdì 23:59 ogni settimana. - Canale appositamente calcolato da un timeframe specifico che viene visualizzato su tutti gli altri timeframe. Per impostazione predefinita, si tratta del timeframe a 4 ore, che può essere modificato in qualsiasi altro timeframe si desideri operare. Viene calcolato senz
GANN Master
Ivan Stefanov
5 (1)
Gli obiettivi precisi di GANN sono calcolati secondo i suoi metodi collaudati e presentati chiaramente davanti a te. Questo strumento è progettato per rendere il trading più fluido e intuitivo. Spostando la linea bianca verso l'alto o quella verde verso il basso, capirai subito perché le tecniche di GANN rimangono influenti nel mondo del trading. Le strategie di GANN si concentrano sulla previsione dei movimenti di mercato con grande precisione, e questo strumento porta quel potere a portata di
Stefanov
Ivan Stefanov
The indicator displays support and resistance zones defined logically using the MACD. The entire concept is explained in the video, with specific examples shown. The indicator works on any instruments and timeframes. It does not repaint. After placing it on the chart, please go through all the timeframes sequentially, from monthly to 1-minute, so that all lines load correctly. After that, you can start using it. The concept is unique and has not been seen in other systems or indicators.
Fifty Pro
Ivan Stefanov
5 (1)
L'indicatore FIFTY è ora disponibile in una versione automatizzata, eliminando la necessità di tracciare manualmente i livelli. Questa versione disegna automaticamente i livelli giornalieri, settimanali, mensili e annuali sul grafico, garantendo precisione e risparmiando tempo. Inoltre, sono presenti pulsanti per attivare o disattivare la visibilità di questi livelli, offrendo una personalizzazione completa. Per chi lo preferisce, la versione gratuita dell'indicatore rimane disponibile e complet
Naturu MT4
Ivan Stefanov
“Naturu” è un indicatore manuale che utilizza la simmetria della natura come algoritmo. Conquista il mercato con una strategia semplice e saggezza nascosta! Quando carichi l’indicatore, vedrai due linee: Top e Bottom. Clicca una volta su una linea per attivarla. Per spostarla, basta cliccare sulla candela dove vuoi posizionarla. Definisci un punto alto e un punto basso, e l’indicatore calcola automaticamente: Una zona magenta che mostra dove gli interessi di tori e orsi sono più vicini, ossia l’
Horizont
Ivan Stefanov
Horizont è un sistema di trading che fornisce una configurazione completa di operazione: punto di ingresso, target 1, target 2 e stop loss, tutti calcolati automaticamente. Il sistema identifica automaticamente i massimi e i minimi del mercato e li collega per definire il trend attuale. Lei seleziona quale trend tradare e Horizont genera i relativi livelli di ingresso, target e stop. Il sistema include una gestione automatica del rischio. Controlla il saldo del conto, calcola il rischio e sugge
Enigmera MT5
Ivan Stefanov
3.67 (3)
ENIGMERA: Il nucleo del mercato (Questo è un indicatore manuale e contiene funzioni che potrebbero non essere supportate dall’attuale ambiente di test di MetaTrader) Introduzione Questo indicatore e sistema di trading rappresentano un approccio unico ai mercati finanziari. ENIGMERA utilizza cicli frattali per calcolare con precisione i livelli di supporto e resistenza. Mostra la fase autentica di accumulazione e fornisce direzione e obiettivi. È un sistema che funziona sia in tendenza che in fas
L’indicatore evidenzia le zone in cui viene dichiarato interesse sul mercato , per poi mostrare la zona di accumulo degli ordini . Funziona come un book degli ordini su larga scala . Questo è l’indicatore per i grandi capitali . Le sue prestazioni sono eccezionali. Qualsiasi interesse ci sia nel mercato, lo vedrai chiaramente . (Questa è una versione completamente riscritta e automatizzata – non è più necessaria un’analisi manuale.) La velocità di transazione è un indicatore concettualmente nuo
Uno dei pochi indicatori che calcola i livelli esclusivamente in base al prezzo. L’indicatore non è influenzato dai timeframe, dai trend o dai cicli di mercato. Uno degli indicatori più logici mai creati. L’indicatore FIFTY è ora disponibile in una versione automatica, che elimina la necessità di tracciare manualmente i livelli. Questa versione disegna automaticamente sul grafico i livelli giornalieri, settimanali, mensili e annuali, garantendo precisione e risparmio di tempo. Inoltre, sono pres
SPEKULATOR è un sistema di trading manuale e un indicatore che ti aiuta a identificare le zone di supporto chiave e la direzione del mercato. Padroneggia il mercato con una strategia semplice e una saggezza nascosta. Selezioni un qualsiasi TOP e BOTTOM nel grafico, e l'indicatore disegna: Una zona di supporto per il tuo trend. Per una tendenza rialzista, appare una zona verde; per una tendenza ribassista, una zona rossa. La sensibilità della zona di supporto può essere regolata nelle impostazion
Time Zones Fifty L’indicatore risolve un problema fondamentale: Come dobbiamo contare il tempo? Quali zone usare, come e perché? È basato interamente sulla logica. Applicazione delle zone temporali Per applicare le zone temporali serve un punto di partenza. Questo punto deve essere definito logicamente, non scelto a caso. Alcuni scelgono di iniziare da: il primo giorno dell’anno, il primo giorno del mese, l’inizio di un trimestre o di una settimana. Ma ciò presuppone che l’attività del mercato s
Filtro:
Nessuna recensione
Rispondi alla recensione