Volume Profile Density v2

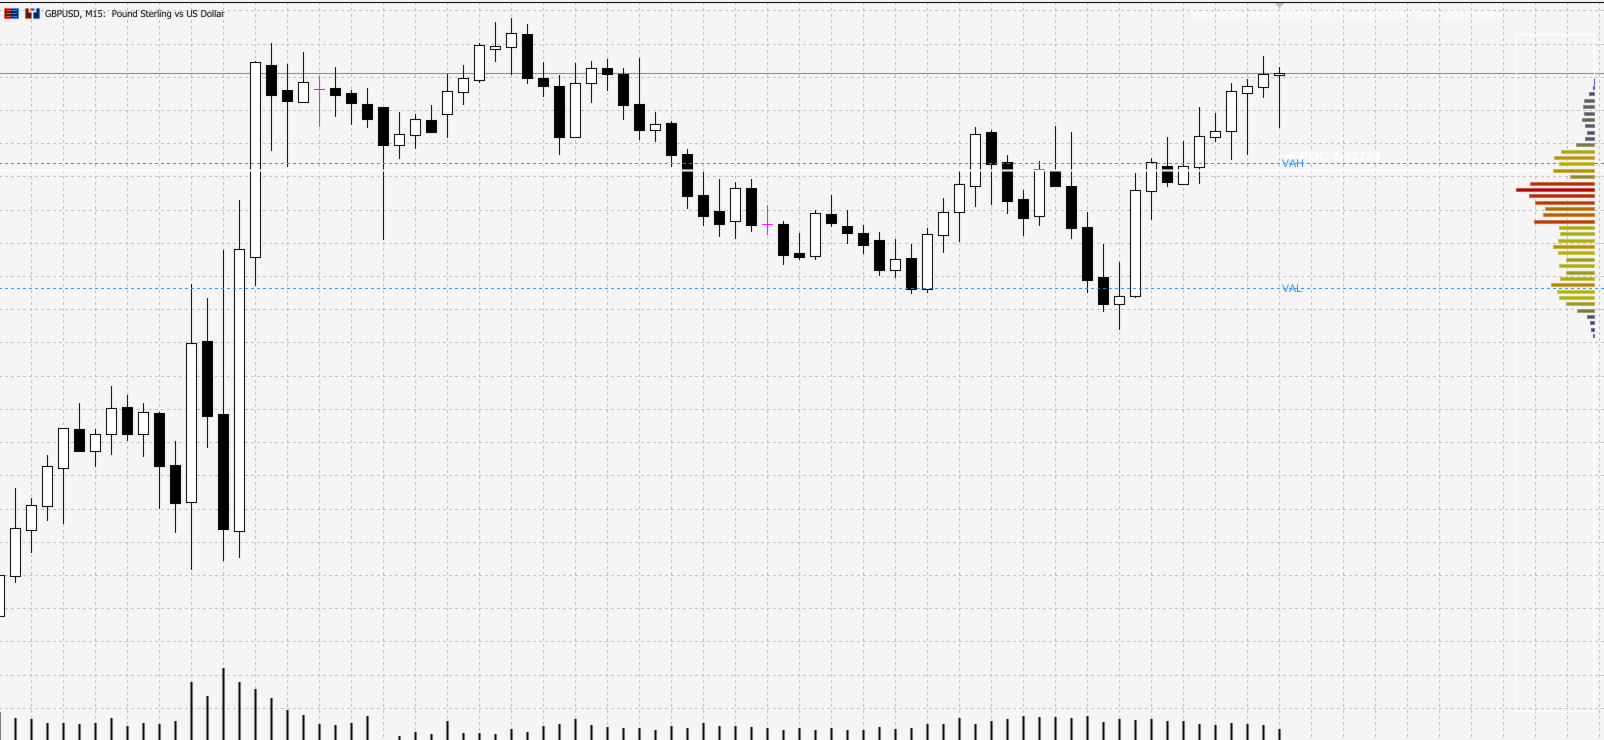
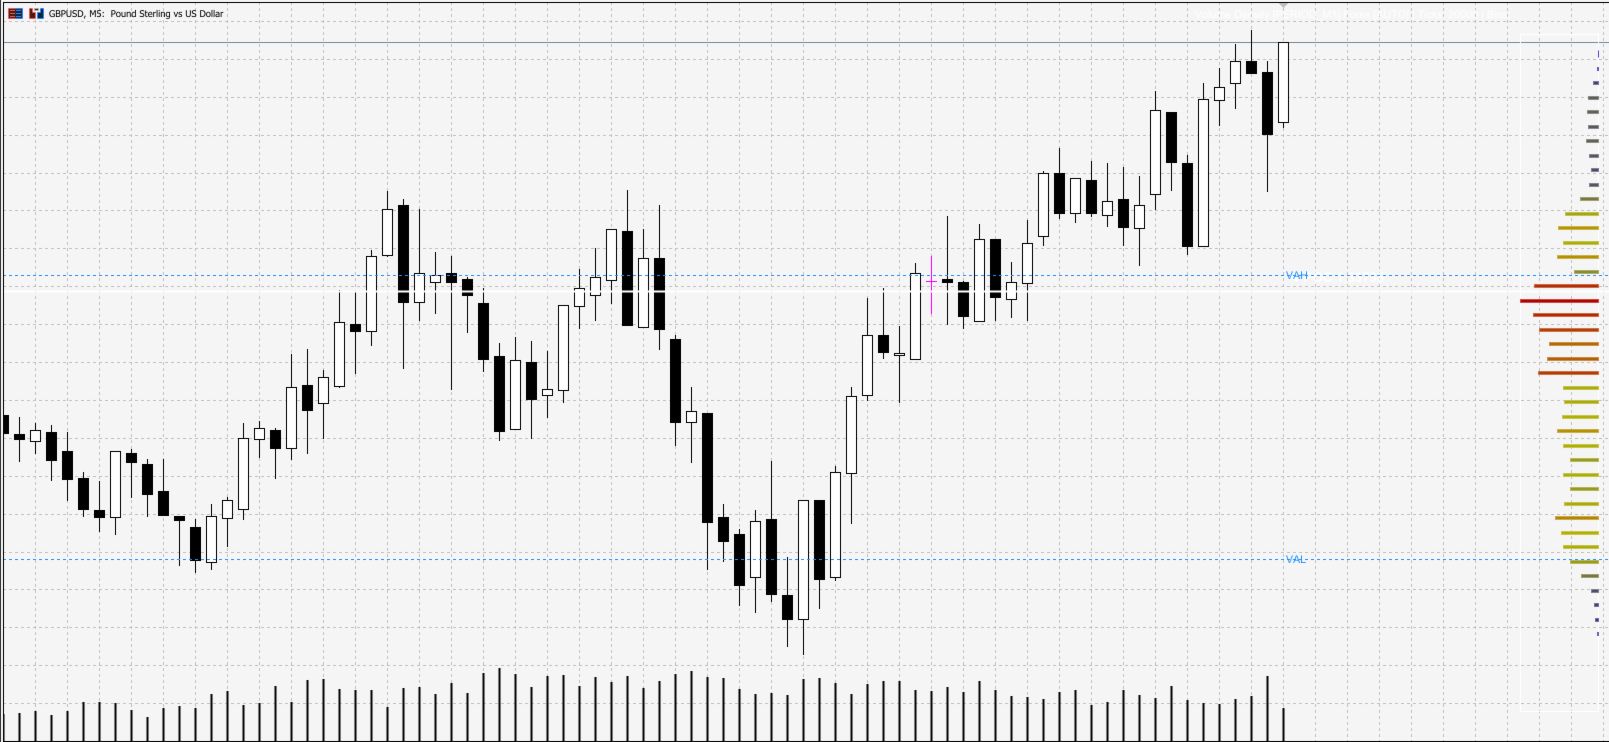
Volume Profile Density V2.40

Mostra la distribuzione del volume per livello di prezzo, evidenziando le zone di interesse istituzionale.
A differenza del volume tradizionale (nel tempo), indica dove il volume si è realmente concentrato.

Principi base:

  • Barre orizzontali = volume scambiato a ciascun prezzo

  • Barra più lunga → volume maggiore

  • Zone rosse = principali supporti/resistenze

Utilizzi principali:

  • Identificare supporti e resistenze reali

  • Determinare il POC (Point of Control)

  • Definire la Value Area (70% del volume totale)

  • Usare le zone a basso volume per stop e target

Codice colore:

  • Blu = basso volume (zona attraversata rapidamente)

  • Giallo = volume medio (zona di equilibrio)

  • Rosso = alto volume (zona istituzionale)

Strategie operative:

  • Acquisto su rimbalzo in zona rossa

  • Vendita su rifiuto a VAH o zona rossa

  • Entrata su rottura del POC con volume

  • Entrata sul ritorno al POC

  • Obiettivo sulle zone blu

Impostazioni rapide:

  • Principiante: 1.0 / 100% / 1.0

  • Scalping: 0.5 / 200% / 0.5

  • Swing: 2.0 / 50% / 1.5

Dati tecnici:

  • Versione: 2.40

  • Piattaforma: MT5

  • Asset: Forex, CFD, Metalli, Crypto

  • Timeframe: M1–M15

  • Tipo: Indicatore in tempo reale con adattamento automatico

Sintesi:
Il volume non mente mai — opera con le zone di volume, non contro di esse.

Prodotti consigliati
(Special New Year promotion - free price!) The indicator displays the actual 'Scale in points per bar' (identical to the manual setting in the Terminal, see screenshot) in the upper right corner of the chart. The displayed value changes INSTANTLY whenever the chart scale is changed! (This is very convenient when planning screenshots). In Settings: Change language (Russian/English), font size of the displayed text, text label offset coefficient from the graph corner, equally in X and Y directi
FREE
The indicator highlights the points that a professional trader sees in ordinary indicators. VisualVol visually displays different volatility indicators on a single scale and a common align. Highlights the excess of volume indicators in color. At the same time, Tick and Real Volume, Actual range, ATR, candle size and return (open-close difference) can be displayed. Thanks to VisualVol, you will see the market periods and the right time for different trading operations. This version is intended f
FREE
Aggression Volume
Flavio Javier Jarabeck
4.29 (17)
Aggression Volume Indicator is the kind of indicator that is rarely found in the MQL5 community because it is not based on the standard Volume data provided by the Metatrader 5 platform. It requires the scrutiny of all traffic Ticks requested on the platform... That said, Aggression Volume indicator requests all Tick Data from your Broker and processes it to build a very special version of a Volume Indicator, where Buyers and Sellers aggressions are plotted in a form of Histogram. Additionally,
FREE
Mirror Chart MT5
Andrej Hermann
5 (1)
The Mirror Chart MT5 is a overlay indicator specifically designed to project a second financial instrument directly onto the main chart window. This tool is invaluable for traders who rely on correlation analysis, as it visualizes the price movements of two different instruments in real time. Unlike traditional overlays, this indicator utilizes intelligent, dynamic centering and scaling logic. It continuously analyzes the visible price range in the current window for both symbols and calculates
FREE
Value Chart Candlesticks
Flavio Javier Jarabeck
4.69 (13)
The idea of a Value Chart indicator was presented in the very good book I read back in 2020 , " Dynamic Trading Indicators: Winning with Value Charts and Price Action Profile ", from the authors Mark Helweg and David Stendahl. The idea is simple and the result is pure genius: Present candlestick Price analysis in a detrended way! HOW TO READ THIS INDICATOR Look for Overbought and Oversold levels. Of course, you will need to test the settings a lot to find the "correct" one for your approach. It
FREE
Elevate Your Trading with Advanced Anchored Volume Weighted Average Price Technology Unlock the true power of price action with our premium Anchored VWAP Indicator for MetaTrader 5 - the essential tool for precision entries, strategic exits, and high-probability trend continuation setups. Write me a DM for a 7 day free trial.  Anchored VWAP Plus gives traders unprecedented control by allowing custom anchor points for Volume Weighted Average Price calculations on any chart. With support for 4 sim
FREE
Weis Waves
Flavio Javier Jarabeck
2.83 (18)
The original author is David Weis, an expert in the Wyckoff Method. The Weis Wave is a modern adaptation of the 1930's Wyckoff Method, another expert in Tape Reading techniques and Chart Analysis. Weis Waves takes market volume and stacks it into waves according to price conditions giving the trader valuable insights about the market conditions. If you want to learn more about this subject you can find tons of videos in YouTube. Just look for "The Wickoff Method", "Weis Wave" and "Volume Spread
FREE
VP hidden
Emr Aljnaby
4.33 (12)
The indicator works to convert normal volume into levels and determine financial liquidity control points. It is very similar in function to Fixed Volume Profile. But it is considered more accurate and easier to use than the one found on Trading View because it calculates the full trading volumes in each candle and in all the brokers present in MetaTrade, unlike what is found in Trading View, as it only measures the broker’s displayed prices. To follow us on social media platforms: telegram
FREE
Donchian Breakout And Rsi
Mattia Impicciatore
5 (1)
Descrizione generale Questo indicatore è una versione avanzata del classico Donchian Channel , arricchita con funzioni operative per il trading reale. Oltre alle tre linee tipiche (massimo, minimo e linea centrale), il sistema rileva i breakout e li segnala graficamente con frecce sul grafico, mostrando solo la linea opposta alla direzione del trend per semplificare la lettura. L’indicatore include: Segnali visivi : frecce colorate al breakout Notifiche automatiche : popup, push e email Filtro R
FREE
This indicator sums up the difference between the sells aggression and the buys aggression that occurred in each Candle, graphically plotting the waves of accumulation of the aggression volumes.   Through these waves an exponential average is calculated that indicates the direction of the business flow. Note: This indicator DOES NOT WORK for Brokers and/or Markets WITHOUT the type of aggression (BUY or SELL).   Be sure to try our Professional version with configurable features and alerts:  Agre
FREE
Simple QM Pattern MT5
Suvashish Halder
4.5 (2)
Simple QM Pattern   is a powerful and intuitive trading indicator designed to simplify the identification of the Quasimodo (QM) trading pattern. The QM pattern is widely recognized among traders for effectively signaling potential   reversals   by highlighting key market structures and price action formations. This indicator helps traders easily visualize the QM pattern directly on their charts, making it straightforward even for those who are new to pattern trading. Simple QM Pattern includes d
FREE
Overview Market Volume Profile Modes is a powerful MT5 volume distribution indicator that integrates multiple Volume Profile variants. Users can switch between different analysis modes through a simple menu selection. This indicator helps traders identify key price levels, support and resistance zones, and market volume distribution. Core Concepts • POC (Point of Control): The price level with the highest volume concentration, representing the market's accepted "fair value" area • VAH (Value A
FREE
Simple Anchored VWAP MT5
Suvashish Halder
5 (2)
Simple Anchored VWAP   is a lightweight yet powerful tool designed for traders who want precise volume-weighted levels without complexity. This indicator lets you anchor VWAP from any point on the chart and instantly see how price reacts around institutional volume zones. MT4 Version - https://www.mql5.com/en/market/product/155320 Join To Learn Market Depth -   https://www.mql5.com/en/channels/suvashishfx Using VWAP bands and dynamic levels, the tool helps you understand where real buying and s
FREE
Enhanced Volume Profile: The Ultimate Order Flow & Liquidity Analysis Tool Overview Enhanced Volume Profile is an indicator for MetaTrader 5 that displays the traded volume at specific price levels over a defined period. It separates the total volume into buy and sell components, presenting them as a side-by-side histogram on the chart. This allows users to observe the volume distribution and the proportion of buy and sell volumes at each price level. Graphics Rendering The indicator uses the
FREE
BoxInside MT5
Evgeny Shevtsov
5 (4)
This indicator calculates the volume profile and places labels that correspond to the VAH, VAL and POC levels, for each candle individually. Indicator operation features The indicator works on the timeframes from M3 to MN, but it uses the history data of smaller periods: M1 - for periods from M3 to H1, M5 - for periods from H2 to H12, M30 - for the D1 period, H4 - for the W1 period, D1 - for the MN period. The color and location of the VAL, VAH and POC labels on the current candle are considere
FREE
Waves Sizer
Flavio Javier Jarabeck
3.86 (7)
Wyckoff fans, enjoy! Ideally to be used with the Weis Waves indicator, but it can be easily used alone, the Waves Sizer puts the range (in resulting Price movement) done by the Price on its market swings. You can control how accurate or loose will be the swings. This tool is very helpful for visually know how much the Price has traveled in your Timeframe. This way you can confront this level of effort with the resulting Volume, etc... Weis Waves indicator: https://www.mql5.com/en/market/produc
FREE
Haven Volume Profile
Maksim Tarutin
4.56 (9)
Haven Volume Profile è un indicatore multifunzionale per l'analisi del profilo di volume che aiuta a identificare i livelli di prezzo chiave basati sulla distribuzione del volume di scambi. È stato progettato per i trader professionisti che desiderano comprendere meglio il mercato e identificare i punti di ingresso e di uscita cruciali per le loro operazioni. Altri prodotti ->  QUI Caratteristiche principali: Calcolo del Point of Control (POC) - il livello con la massima attività commerciale, ut
FREE
Donchian Pro
Paulo Henrique Faquineli Garcia
4.75 (4)
The Donchian Channel Channels are among the most popular tools of technical analysis, as they visually convey to the analyst the limits within which most price movement tends to occur. Channel users know that valuable information can be obtained at any time, whether prices are in the central region of a band or close to one of the border lines. One of the best known techniques to explore these concepts is Bollinger Bands. However, John Bollinger was not the only one to research the application
FREE
VM Auto SLTP Basic
Van Minh Nguyen
5 (1)
VM Auto SLTP Basic - Intelligent Trade Management for Scalpers Enhance your scalping strategy to a higher level. VM Auto SLTP Basic automatically manages Stop Loss and Take Profit for orders that are opened manually or by other Expert Advisors. This tool does not open trades on its own, allowing you to maintain full control while enjoying precise risk management. Key Features: SL/TP based on ATR or fixed price Automatic SL move to Breakeven Risk management as a percentage of account balance Supp
FREE
Basic Vwap
james mugendi
4 (1)
Simple Vwap with the daily, weekly and monthly VWAP is the abbreviation for   volume-weighted average price , which is a technical analysis tool that shows the ratio of an asset's price to its total trade volume. It provides traders and investors with a measure of the average price at which a stock is traded over a given period of time. How it's used Identify entry and exit points:   Traders can use VWAP to determine when to buy or sell an asset.   Understand price trends :  Traders can use V
FREE
Expansoes M
Marcus Vinicius Da Silva Miranda
The M Extensions are variations of the Golden Ratio (Fibonacci Sequence). It is the World's first technique developed for Candle Projections. Advantages: Easy to plot. Candle anchoring; High and accurate precision as support and resistance; Excellent Risk x Return ratio; Works in any timeframe; Works in any asset / market.   The M Extensions are classified into: M0: Zero point (starting candle) RC: Initial candle control region M1: Extension region 1 M2: Extension region 2 M3: Extension regi
FREE
UT Alart Bot
Menaka Sachin Thorat
4.75 (4)
To get access to MT4 version please click  https://www.mql5.com/en/market/product/130055&nbsp ; - This is the exact conversion from TradingView: "Ut Alart Bot Indicator". - You can message in private chat for further changes you need. Here is the source code of a simple Expert Advisor operating based on signals from Ut Bot Indicator . #property copyright "This EA is only education purpose only use it ur own risk" #property link " https://sites.google.com/view/automationfx/home " #property versio
FREE
RSI abcd
Francisco Gomes Da Silva
4.33 (3)
RSI ABCD Pattern Finder: Strategia Tecnica 1. Come Funziona l'Indicatore Combina il RSI classico con il rilevamento automatico di pattern armonici ABCD . Componenti Principali RSI standard (periodo regolabile) Marcatori di massimi e minimi (frecce) Pattern ABCD (linee verdi/rosse) Filtri ipercomprato (70) e ipervenduto (30) 2. Configurazione su MT5 period = 14 ; // Periodo RSI size = 4 ; // Dimensione massima del pattern OverBought = 70 ; // Livello ipercomprato OverSold = 30 ; // Livello iperve
FREE
VWAP Personnal Custom
Vincent Jose Proenca
VWAP_PC_MQL5 — a simple home-built VWAP indicator showing real-time volume-weighted price levels directly on your MT5 chart. TF: Works on all timeframes. Pair: Compatible with all symbols — Forex, indices, commodities, and stocks. Settings: Applied Price – price type used for VWAP calculation (Close, Typical, Weighted, etc.) Line Color / Width / Style – customize VWAP line appearance Session Reset – optional reset per day or continuous mode How it works (VWAP principle): VWAP (Volume Weighted
FREE
Order Book, known also as Market Book, market depth, Level 2, - is a dynamically updated table with current volumes of orders to buy and to sell specific financial instument at price levels near Bid and Ask. MetaTrader 5 provides the means for receiving market book from your broker, but in real time only, without access to its history. This expert adviser OrderBook History Playback allows you to playback the market book events on the history using files, created by OrderBook Recorder . The exper
FREE
Tick Profile Free
Elia Burstein
5 (3)
This indicator will show a vertical representation of the volume distribution within a selected user range. This is a free version of the full product. It is limited to use on a week old data or older. Find the full product at  https://www.mql5.com/en/market/product/42234 . Main features: This Indicator will create an image that will allow viewing the tick volume per price level in a graphical form. The indicator will work on any range size in any time-frame, limited only by your computer mem
FREE
MIDAS Super VWAP
Flavio Javier Jarabeck
4.27 (11)
Imagine VWAP, MVWAP and MIDAS in one place... Well, you found it! Now you can track the movement of Big Players in various ways, as they in general pursue the benchmarks related to this measuring, gauging if they had good execution or poor execution on their orders. Traders and analysts use the VWAP to eliminate the noise that occurs throughout the day, so they can measure what prices buyers and sellers are really trading. VWAP gives traders insight into how a stock trades for that day and deter
FREE
AP Session Boxes — Asian / London / NY Range Overlay (MT5 Indicator) Clean session boxes on your chart. This lightweight indicator draws the   Asian ,   London , and   New York   time windows directly on the chart, including each box’s   high   and   low   as dashed lines. It’s perfect for quick context, breakout planning, and clean screenshots. Instant structure:   See where the market ranged during key sessions. Breakout prep:   Use the hi/lo lines as reference for pending orders or alerts fr
FREE
"While our free indicators provide a solid foundation, our paid products offer advanced neural filtering and automated risk management features that help you scale your trading consistency. Upgrade your edge today by visiting our specialized catalog for professional-grade EAs and indicators." What is this indicator? This Basic Support and Resistance Indicator -Free-   is designed to help traders automatically identify key market levels, such as supports and resistances, across multiple symbols
FREE
Cumulative Delta MT5
Evgeny Shevtsov
4.53 (62)
The indicator analyzes the volume scale and splits it into two components - seller volumes and buyer volumes, and also calculates the delta and cumulative delta. The indicator does not flicker or redraw, its calculation and plotting are performed fairly quickly, while using the data from the smaller (relative to the current) periods. The indicator operation modes can be switched using the Mode input variable: Buy - display only the buyer volumes. Sell - display only the seller volumes. BuySell -
FREE
Gli utenti di questo prodotto hanno anche acquistato
SuperScalp Pro
Van Minh Nguyen
5 (14)
SuperScalp Pro – Sistema avanzato di indicatore per scalping con filtri multipli SuperScalp Pro è un sistema avanzato di indicatore per scalping che combina il classico Supertrend con molteplici filtri di conferma intelligenti. L’indicatore funziona in modo efficiente su tutti i timeframe da M1 a H4 ed è particolarmente adatto per XAUUSD, BTCUSD e le principali coppie Forex. Può essere utilizzato come sistema stand-alone o integrato in modo flessibile nelle strategie di trading esistenti. L’indi
Azimuth Pro
Ottaviano De Cicco
5 (6)
LAUNCH PROMO Azimuth Pro price is initially set at 299$ for the first 100 buyers. Final price will be 499$ . THE DIFFERENCE BETWEEN RETAIL AND INSTITUTIONAL ENTRIES ISN'T THE INDICATOR — IT'S THE LOCATION. Most traders enter at arbitrary price levels, chasing momentum or reacting to lagging signals. Institutions wait for price to reach structured levels where supply and demand actually shift. Azimuth Pro maps these levels automatically: swing-anchored VWAP, multi-timeframe structure lines, an
Divergence Bomber
Ihor Otkydach
4.89 (85)
Ogni acquirente dell’indicatore riceverà inoltre gratuitamente: L’utilità esclusiva “Bomber Utility”, che gestisce automaticamente ogni operazione, imposta i livelli di Stop Loss e Take Profit e chiude le posizioni secondo le regole della strategia I file di configurazione (set file) per adattare l’indicatore a diversi asset I set file per configurare il Bomber Utility in tre modalità: “Rischio Minimo”, “Rischio Bilanciato” e “Strategia di Attesa” Una guida video passo-passo per installare, conf
ARICoins
Temirlan Kdyrkhan
ARICoin is a powerful trading companion designed to generate high-probability entry signals with dynamic TP/SL/DP levels based on volatility. Built-in performance tracking shows win/loss stats, PP1/PP2 hits, and success rates all updated live. Key Features: Buy/Sell signals with adaptive volatility bands Real-time TP/SL/DP levels based on ATR Built-in MA Filter with optional ATR/StdDev volatility Performance stats panel (Success, Profit/Loss, PP1/PP2) Alerts via popup, sound, push, or email Cust
Entry In The Zone and SMC Multi Timeframe is a real-time market analysis tool developed based on Smart Money Concepts (SMC). It is designed to analyze market structure, price direction, reversal points, and key zones across multiple timeframes in a systematic way. The system displays Points of Interest (POI) and real-time No Repaint signals, with instant alerts when price reaches key zones or when signals occur within those zones. It functions as both an Indicator and a Signal System (2-in-1), c
CGE Trading Suite
Carl Gustav Johan Ekstrom
5 (1)
CGE Trading Suite delivers the analytical edge typically reserved for professional trading desks. The platform integrates a full suite of analytical tools into one seamless workflow: dynamic grid mapping, liquidity behavior analysis, ECM, trend lines, MIDAS, trade cycles, and directional channel projections. Together, these provide a unified view of market structure and momentum. Directional clarity is further enhanced by the capital flow index, which measures currency basket strength to identif
Se acquisti questo indicatore, riceverai il mio Trade Manager Professionale + EA  GRATUITAMENTE. Innanzitutto è importante sottolineare che questo sistema di trading è un indicatore Non-Repainting, Non-Redrawing e Non-Lagging, il che lo rende ideale sia per il trading manuale che per quello automatico. Corso online, manuale e download di preset. Il "Sistema di Trading Smart Trend MT5" è una soluzione completa pensata sia per i trader principianti che per quelli esperti. Combina oltre 10 indicat
Gold Entry Sniper
Tahir Mehmood
5 (6)
Gold Entry Sniper – Dashboard ATR Multi-Timeframe per Scalping e Swing Trading sull’Oro Gold Entry Sniper è un indicatore avanzato per MetaTrader 5 che offre segnali di acquisto/vendita precisi per XAUUSD e altri strumenti, basato sulla logica ATR Trailing Stop e l' analisi multi-timeframe . Caratteristiche e Vantaggi Analisi Multi-Timeframe – Visualizza trend su M1, M5, M15 in un'unica dashboard. Trailing Stop Basato su ATR – Stop dinamici che si adattano alla volatilità. Dashboard Professional
Meridian Pro
Ottaviano De Cicco
5 (1)
Meridian Pro: Professional Multi-Timeframe Trend Matrix for MT5 Overview Meridian Pro is a multi-timeframe trend matrix by Merkava Labs that compresses directional state, strength, momentum condition and matrix agreement into one compact panel. One adaptive engine, applied consistently from M1 to W1. No per-symbol tuning. No indicator stacking. One structured readout across every asset and every timeframe. Launch Offer — Get Meridian Pro for USD 99 (introductory). Regular price: USD 149. 1. Why
RelicusRoad Pro: Sistema Operativo Quantitativo di Mercato 70% DI SCONTO ACCESSO A VITA (TEMPO LIMITATO) - UNISCITI A 2.000+ TRADER Perché la maggior parte dei trader fallisce anche con indicatori "perfetti"? Perché operano su Singoli Concetti isolati. Un segnale senza contesto è una scommessa. Per vincere serve CONFLUENZA . RelicusRoad Pro non è un semplice indicatore. È un Ecosistema Quantitativo completo . Mappa la "Fair Value Road", distinguendo tra rumore e rotture strutturali. Smetti di in
FX Trend MT5 NG
Daniel Stein
5 (4)
FX Trend NG: La Nuova Generazione di Intelligenza di Trend Multi-Mercato Panoramica FX Trend NG è uno strumento professionale di analisi del trend multi-timeframe e monitoraggio dei mercati. Ti consente di comprendere la struttura completa del mercato in pochi secondi. Invece di passare tra numerosi grafici, puoi identificare immediatamente quali strumenti sono in trend, dove il momentum sta diminuendo e dove esiste un forte allineamento tra i timeframe. Offerta di Lancio – Ottieni FX Trend NG
Power Candles MT5
Daniel Stein
5 (6)
Power Candles – Segnali di ingresso basati sulla forza per tutti i mercati Power Candles porta l’analisi di forza collaudata di Stein Investments direttamente sul grafico dei prezzi. Invece di reagire solo al prezzo, ogni candela viene colorata in base alla reale forza di mercato, consentendo di identificare immediatamente accumuli di momentum, accelerazioni della forza e transizioni di trend pulite. Un’unica logica per tutti i mercati Power Candles funziona automaticamente su tutti i simboli di
AriX
Temirlan Kdyrkhan
1 (4)
AriX Indicator for MT5 A powerful trend-following and signal-evaluation tool AriX is a custom MT5 indicator that combines Moving Averages and ATR-based risk/reward logic to generate clear buy/sell signals. It visualizes dynamic SL/TP levels, evaluates past trade outcomes, and displays win/loss statistics in a clean on-chart panel. Key features include: Buy/Sell signals based on MA crossovers ATR-based SL/TP1/TP2/TP3 levels with visual lines and labels Signal outcome tracking with real-time stat
Quantum TrendPulse
Bogdan Ion Puscasu
5 (22)
Ecco   Quantum TrendPulse   , lo strumento di trading definitivo che combina la potenza di   SuperTrend   ,   RSI   e   Stocastico   in un unico indicatore completo per massimizzare il tuo potenziale di trading. Progettato per i trader che cercano precisione ed efficienza, questo indicatore ti aiuta a identificare con sicurezza le tendenze di mercato, i cambiamenti di momentum e i punti di entrata e uscita ottimali. Caratteristiche principali: Integrazione SuperTrend:   segui facilmente l'andame
Trend Screener Pro MT5
STE S.S.COMPANY
4.84 (102)
Indicatore di tendenza, soluzione unica rivoluzionaria per il trading di tendenze e il filtraggio con tutte le importanti funzionalità di tendenza integrate in un unico strumento! È un indicatore multi-timeframe e multi-valuta al 100% non ridipingibile che può essere utilizzato su tutti i simboli/strumenti: forex, materie prime, criptovalute, indici e azioni. Trend Screener è un indicatore di tendenza che segue un indicatore efficiente che fornisce segnali di tendenza a freccia con punti nel gra
[ My Products ] , [ My Channel ]   ,  [ LIVE SIGNAL ] HFT Spike Detector HFT Spike Detector è uno strumento professionale di monitoraggio dei tick progettato per analizzare e misurare in tempo reale i movimenti di prezzo ad alta frequenza (picchi improvvisi causati da HFT). Il suo scopo è permetterti di rilevare slippage anomalo, gap di liquidità e picchi di prezzo a livello millisecondo causati dal broker, utilizzando dati numerici. Poiché analizza il flusso di tick in tempo reale e le cond
Atomic Analyst MT5
Issam Kassas
3.94 (31)
Innanzitutto, vale la pena sottolineare che questo indicatore di trading non è repaint, non è ridisegno e non presenta ritardi, il che lo rende ideale sia per il trading manuale che per quello automatico. Manuale utente: impostazioni, input e strategia. L'Analista Atomico è un indicatore di azione del prezzo PA che utilizza la forza e il momentum del prezzo per trovare un miglior vantaggio sul mercato. Dotato di filtri avanzati che aiutano a rimuovere rumori e segnali falsi, e aumentare il pote
Strumento per market maker. Meravith: Analizzerà tutti i timeframe e mostrerà il trend attualmente in corso. Evidenzierà le zone di liquidità (equilibrio dei volumi) dove i volumi rialzisti e ribassisti sono uguali. Mostrerà tutti i livelli di liquidità dei diversi timeframe direttamente sul grafico. Genererà e presenterà un’analisi di mercato testuale a scopo di riferimento. Calcolerà obiettivi, livelli di supporto e punti di stop-loss in base al trend attuale. Calcolerà il rapporto rischio/ren
OmniSync Projection
Antonio-alin Teculescu
5 (1)
Chronos Fractal Engine is an innovative price projection indicator for MetaTrader 5, designed to transform your technical analysis by intelligently identifying and projecting historical price patterns. Built upon an advanced correlation algorithm and the fractal principles of the market, this powerful tool visualizes potential future price movements, giving you a unique edge in your trading decisions. What is Chronos Fractal Engine? At its core, the Chronos Fractal Engine employs a sophisticat
Bill Williams Advanced
Siarhei Vashchylka
5 (11)
Bill Williams Advanced is designed for automatic chart analysis using Bill Williams' "Profitunity" system. The indicator analyzes four timeframes at once. Manual (Be sure to read before purchasing) Advantages 1. Analyzes the chart using Bill Williams' "Profitunity" system. Signals are displayed in a table in the corner of the screen and on the price chart. 2. Finds all known AO and AC signals, as well as zone signals. Equipped with a trend filter based on the Alligator. 3. Finds "Divergence Bar
Currency Strength Dashboard Pro Pannello professionale di analisi della forza delle valute in tempo reale per MetaTrader 5 . L’indicatore calcola e visualizza la forza di 8 valute principali (EUR, USD, GBP, JPY, CHF, AUD, CAD, NZD) utilizzando 28 coppie di valute simultaneamente su più timeframe. Il pannello offre al trader una visione completa del mercato a colpo d’occhio — senza calcoli aggiuntivi né la necessità di passare tra diversi grafici. Metodo di calcolo L’indicatore si basa su un meto
Grabber System MT5
Ihor Otkydach
4.83 (23)
Ti presento un eccellente indicatore tecnico: Grabber, che funziona come una strategia di trading "tutto incluso", pronta all’uso. In un solo codice sono integrati strumenti potenti per l’analisi tecnica del mercato, segnali di trading (frecce), funzioni di allerta e notifiche push. Ogni acquirente di questo indicatore riceve anche gratuitamente: L’utility Grabber: per la gestione automatica degli ordini aperti Video tutorial passo dopo passo: per imparare a installare, configurare e utilizzare
Presentazione       Quantum Breakout PRO   , l'innovativo indicatore MQL5 che sta trasformando il modo in cui scambi le zone di breakout! Sviluppato da un team di trader esperti con un'esperienza di trading di oltre 13 anni,       Quantum Breakout PRO       è progettato per spingere il tuo viaggio di trading a nuovi livelli con la sua strategia innovativa e dinamica della zona di breakout. Quantum Breakout Indicator ti fornirà frecce di segnalazione sulle zone di breakout con 5 zone target di
FX Power MT5 NG
Daniel Stein
5 (31)
FX Power: Analizza la Forza delle Valute per Decisioni di Trading Più Intelligenti Panoramica FX Power è lo strumento essenziale per comprendere la reale forza delle principali valute e dell'oro in qualsiasi condizione di mercato. Identificando le valute forti da comprare e quelle deboli da vendere, FX Power semplifica le decisioni di trading e rivela opportunità ad alta probabilità. Che tu segua le tendenze o anticipi inversioni utilizzando valori estremi di Delta, questo strumento si adatta
Advanced Supply Demand MT5
Bernhard Schweigert
4.53 (15)
La migliore soluzione per qualsiasi principiante o trader esperto! Questo indicatore è uno strumento di trading unico, di alta qualità e conveniente perché abbiamo incorporato una serie di funzionalità proprietarie e una nuova formula. Con questo aggiornamento, sarai in grado di mostrare fusi orari doppi. Non solo potrai mostrare una TF più alta, ma anche entrambe, la TF del grafico, PIÙ la TF più alta: SHOWING NESTED ZONES. Tutti i trader di domanda di offerta lo adoreranno. :) Informazioni imp
RFI levels PRO MT5
Roman Podpora
3.67 (3)
L'indicatore mostra accuratamente i punti di inversione e le zone di ritorno dei prezzi in cui il       Principali attori   . Vedi dove si formano le nuove tendenze e prendi decisioni con la massima precisione, mantenendo il controllo su ogni operazione. VERSION MT4     -    Rivela il suo massimo potenziale se combinato con l'indicatore   TREND LINES PRO Cosa mostra l'indicatore: Strutture di inversione e livelli di inversione con attivazione all'inizio di un nuovo trend. Visualizzazione dei li
Market Structure Order Block Dashboard MT5 è un indicatore per MT5 focalizzato sulla struttura di mercato e sui concetti ICT / Smart Money: HH/HL/LH/LL , BOS , ChoCH , oltre a Order Blocks , Fair Value Gaps (FVG) , liquidità (EQH/EQL, sweeps), sessioni / Kill Zones e un Volume Profile integrato, con una dashboard compatta di confluence. Importante: è uno strumento di analisi . Non esegue operazioni (non è un EA). Bonus per gli acquirenti Dopo l’acquisto, puoi ricevere 2 indicatori bonus (a scel
Trend Forecaster
Alexey Minkov
5 (7)
The Trend Forecaster indicator utilizes a unique proprietary algorithm to determine entry points for a breakout trading strategy. The indicator identifies price clusters, analyzes price movement near levels, and provides a signal when the price breaks through a level. The Trend Forecaster indicator is suitable for all financial assets, including currencies (Forex), metals, stocks, indices, and cryptocurrencies. You can also adjust the indicator to work on any time frames, although it is recommen
Crystal Heikin Ashi Signals
Muhammad Jawad Shabir
5 (1)
Crystal Heikin Ashi Signals - Professional Trend & Signal Detection Indicator Advanced Heikin Ashi Visualization with Intelligent Signal System for Manual & Automated Trading Final Price: $149 ---------> Price goes up $10 after every 10 sales . Limited slots available — act fast . Overview Crystal Heikin Ashi Signals is a professional-grade MetaTrader 5 indicator that combines pure Heikin Ashi candle visualization with an advanced momentum-shift detection system. Designed for both manual traders
Scopri quale strategia funziona davvero sul tuo simbolo - prima di rischiare denaro reale. Power Bar rileva le barre di prezzo estreme su qualsiasi simbolo e qualsiasi timeframe, poi esegue istantaneamente il backtest di 3 diverse strategie di trading per confrontare tassi di vincita, fattori di profitto e P&L fianco a fianco. Tutto in un unico pannello interattivo. Niente supposizioni. Niente curve-fitting. Solo dati. Cosa rende Power Bar unico? La maggior parte degli indicatori fornisce un se
Altri dall’autore
Iceblock Volume
Vincent Jose Proenca
5 (1)
Frase breve: Iceblock — indicatore MT4 che identifica cluster di alto volume con limitato movimento di prezzo (comportamento simile a iceberg). TF: Funziona su tutti i timeframe (M1–D1). Coppie: Compatibile con Forex, indici, oro e CFD. Impostazioni: VolumeLookback – numero di candele per la media del volume VolumeThreshold – moltiplicatore per considerare il volume anormale ClusterSize – numero di candele vicine per confermare un cluster RangeComparisonPeriod – periodo per la media degli int
FREE
Pivot PDHL Levels
Vincent Jose Proenca
AutoPivot – Indicatore automatico dei punti pivot Indicatore MT4 che mostra i punti pivot (PP, R1/R2/R3, S1/S2/S3) e i livelli del giorno precedente (PDH/PDL). Caratteristiche principali: Adattamento automatico al timeframe del grafico (H4/D1/W1) Zone tra PDH/PDL e il livello di supporto/resistenza più vicino 8 temi di colore preconfigurati Personalizzazione completa di colori, stili di linea e opacità delle zone Etichette compatte con visualizzazione opzionale del prezzo Aggiornamenti automatic
CustomBreakout
Vincent Jose Proenca
Range Breakout EA – Simple Description Concept An automated trading robot for MetaTrader 5 that exploits range breakouts with two key periods: Features Automatic market hours management Customizable Stop Loss and Take Profit Smart Trailing Stop Built-in testing mode for simulation Detailed logs for monitoring How It Works Records extreme prices at the start of the day Waits for a breakout of the secondary range Opens a position in the breakout direction Automatically manages the trade (SL/TP/Tr
FREE
VolumeSR MT4
Vincent Jose Proenca
his indicator automatically identifies key support and resistance levels by analyzing volume patterns. Unlike traditional S/R tools that rely only on price, Volume S/R finds levels where the market truly reacted.   DETECTION LOGIC: - High Volume Zones: Price levels where strong buying/selling occurred - Low Volume Zones: Areas of weak interest - potential breakout or reversal zones   SMART FILTERING: - Nearby levels are automatically merged to avoid chart clutter - Maximum levels limit keeps yo
FREE
PDHL – simply displays the highs and lows of previous days directly on your chart, providing a quick and visual reference of past key levels. The indicator is lightweight and easily customizable , allowing you to adjust the number of days displayed, the colors, as well as the style and thickness of the lines to suit your preferences. It is designed to be simple and practical, but may not work on all instruments or platforms . Only teste Tested only with CFDs
FREE
VWAP Personnal Custom
Vincent Jose Proenca
VWAP_PC_MQL5 — a simple home-built VWAP indicator showing real-time volume-weighted price levels directly on your MT5 chart. TF: Works on all timeframes. Pair: Compatible with all symbols — Forex, indices, commodities, and stocks. Settings: Applied Price – price type used for VWAP calculation (Close, Typical, Weighted, etc.) Line Color / Width / Style – customize VWAP line appearance Session Reset – optional reset per day or continuous mode How it works (VWAP principle): VWAP (Volume Weighted
FREE
Dynamic Pivot Zones
Vincent Jose Proenca
Dynamic Pivot Zones – Your Level Assistant on the Chart This indicator is a bit like a GPS for your trading . It shows you where the price likes to hang out, where it gets nervous, and where it flies through. No more calculating pivots by hand or guessing support and resistance levels. What it does: Automatically plots H1, H4, and D1 pivots . Shows support and resistance zones : R1, R2, S1, S2. Lines are colored and easy to read , so you can instantly see what’s hot or cold. Why you’ll love it:
FREE
Volume-to-Price Movement Oscillator (VP Oscillator) for MT5 The VP Oscillator highlights the balance (or imbalance) between trading volume and price movement, helping traders spot hidden accumulation, distribution, or weakening trends. How It Works: Calculates each bar’s price range (High–Low) and tick volume. Normalizes both values over a set period (default: 14). Plots the absolute difference between them ×100 — showing how closely price action aligns with trading activity. Interpretation: Hig
FREE
Custom Box CFDs
Vincent Jose Proenca
Range Box Indicator for Trading Sessions This indicator allows traders to visualize and analyze specific time ranges directly on their chart by drawing rectangular boxes for each trading session. Key Features: Customizable session interval: set your own session start and end times. Number of days displayed: choose how many past sessions are visible. Default color and special color for Monday: easily highlight weekly patterns. Adjustable border width: customize the appearance of the rectangles to
FREE
This indicator allows you to number bars within a trading session for CFDs. It works on GER40, UK100, US30, US100, and US500 and is fully customizable to fit your trading style and chart preferences. Key Features & Parameters: Customizable session interval: define your own session start and end times Option to hide even numbers for a cleaner chart Adjust number distance to position the bar numbers as you prefer Font size and color: choose the size and color that suit your chart Number of days di
FREE
VMS Oscillator
Vincent Jose Proenca
Volume & Move Strength (VMS) Indicator for MT5 The VMS Indicator displays the relationship between trading volume and price movement strength, helping traders assess how well market activity supports price action. How It Works: Measures tick volume as trading activity. Calculates move strength using a normalized True Range (%). Both values can be smoothed (default: 5) and optionally normalized (0–100) for consistency across markets. Plots two lines in a separate window: Blue (Volume) – trading a
FREE
Daily Bar Number CFD
Vincent Jose Proenca
indicator that numbers the bars (candles) in a custom trading session. The indicator allows: Defining the session start time (StartHour and StartMinute) Displaying numbers only on odd bars (if AfficherUniquementImpairs is true) Displaying numbers on the last N days (NbJours) Customizing the color and font size of the text The indicator will loop through the bars of the last N days and, for each day, start counting from the session start time. It will display the bar number (starting at 1) belo
FREE
Better Moving Average
Vincent Jose Proenca
STRUCTURAL TREND LINES - MT4 Indicator Simple indicator that automatically draws trend lines based on market structure. Features: - 3 degrees of structure detection (short, medium, long term) - Configurable swing strength for each degree - Single color per degree for clean visualization - Adjustable number of lines per degree - Customizable colors and line widths How it works: The indicator identifies swing highs and lows based on the strength parameter, then connects these points to create t
FREE
Adaptive Flow MAs
Vincent Jose Proenca
Adaptive Flow MAs is a moving average indicator designed to naturally adjust to market movements. Unlike traditional averages, it dynamically adapts its periods based on recent volatility and the current trend. The EMA closely follows rapid price swings to capture every impulse, while the SMA remains smoother, providing a stable and reliable reference. With a clean display showing the current adaptive periods, this tool helps traders feel the “flow” of the market without visual clutter. It’s cr
FREE
STRUCTURAL TREND LINES - MT4/MT5 Indicator Simple indicator that automatically draws trend lines based on market structure. Features: - 3 degrees of structure detection (short, medium, long term) - Configurable swing strength for each degree - Single color per degree for clean visualization - Adjustable number of lines per degree - Customizable colors and line widths How it works: The indicator identifies swing highs and lows based on the strength parameter, then connects these points to crea
FREE
The Candle Activity Visualizer turns your chart into a dynamic heatmap, giving you a clear view of buying and selling pressure. In-Depth Market Insight: Active Zone Detection: The algorithm highlights areas where high volume builds up within a narrow price range, revealing key pressure zones. Real-Time Intensity: Colors adjust in real time, shifting smoothly from cool tones to warmer shades as activity increases. Visual Customization: 5 Color Palettes: Choose from five professionally designed th
Rainbow Price Visualizer v1.21 See where the market really breathes. Turns your MT4 chart into an ultra-precise heatmap that highlights price zones favored by big players. Why it matters 300 price levels at 0.2‑pip resolution — microscopic detail. 8 visual themes (Rainbow, Fire, Ocean…) for instant readibility. Smart opacity: low noise fades, real zones pop. Lightweight rendering with automatic cleanup. Fully customizable: saturation, opacity, resolution, history depth. Bands project into the f
Indicatore a Bolle — Rallentamento del Prezzo + Picco di Volume Uno strumento visivo semplice che mostra quadrati colorati sul grafico quando il prezzo rallenta improvvisamente accompagnato da un picco di volume. (Funzione di riempimento con effetto bolle concentriche) Aiuta a individuare i momenti chiave in cui il mercato si prepara a muoversi. Cosa fa l’indicatore: Rileva i momenti in cui il mercato “esita” prima di muoversi Mostra dove entra grande volume senza variazioni significative di pre
Institutional Flow Indicator A smart volume-based tool that detects institutional activity zones through direct order flow patterns. It reveals where large institutions operate. An advanced volume indicator that filters out noise to identify probable institutional patterns. Key Features Smart cluster detection Automatic identification Signal classification: Violet / Yellow – Institutional Zone – Strong, sustained institutional activity Red / Green – Strong Signal – Significant buying/selling pre
AMD Adaptive MA MT4
Vincent Jose Proenca
5 (1)
Media Mobile Adattiva AMD (AAMA) AAMA è un indicatore di media mobile adattiva per MetaTrader 4 che regola automaticamente la sua reattività in base alle condizioni di mercato. Caratteristiche principali: Media mobile adattiva basata sul Rapporto di Efficienza di Kaufman – reagisce rapidamente durante i trend e filtra il rumore nelle fasi laterali Rilevamento automatico delle 4 fasi di mercato AMD: Accumulazione, Markup (rialzo), Distribuzione, Markdown (ribasso) Adattamento alla volatilità tra
STRUCTURAL TREND LINES - MT4 Indicator Simple indicator that automatically draws trend lines based on market structure. Features: - 3 degrees of structure detection (short, medium, long term) - Configurable swing strength for each degree - Single color per degree for clean visualization - Adjustable number of lines per degree - Customizable colors and line widths How it works: The indicator identifies swing highs and lows based on the strength parameter, then connects these points to create t
Volume Profil MT4
Vincent Jose Proenca
Volume Profile Rectangle – Descrizione del Prodotto Sommario Indicatore interattivo del profilo di volume che mostra un’analisi orizzontale del volume scambiato a ciascun livello di prezzo all’interno di un’area selezionata. Crea automaticamente un rettangolo mobile e visualizza barre colorate che rappresentano la distribuzione del volume rialzista e ribassista. Cosa fa: Mostra il volume orizzontale : Visualizza la distribuzione del volume a ciascun livello di prezzo tramite barre orizzontali An
Proxy OrderFlow MT4
Vincent Jose Proenca
5 (1)
Indicatore basato sul disequilibrio del tick-spread. TF: Funziona su tutti i timeframe (da M1 a D1). Coppie: Compatibile con Forex, indici, oro e CFD (regolazione automatica per JPY, Oro e CFD). Impostazioni: TickWindow (200) – finestra di osservazione dei tick SpreadWeight (1.5) – peso dello spread NormalizationPeriod (20) – periodo di normalizzazione (z-score) Overbought / Oversold (±3.0) – soglie di allerta AlertCooldown (300s) – tempo di raffreddamento tra gli avvisi Conclusione: Proxy Or
Nexus Signal System
Vincent Jose Proenca
DESCRIZIONE TECNICA Nexus Signal System è un indicatore MT4 che combina 12 criteri tecnici per generare segnali di trading. Il sistema analizza la congiunzione di più fattori (trend, momentum, volume, zone di supporto/resistenza) prima di confermare un segnale, riducendo il numero di falsi segnali rispetto agli indicatori che utilizzano un solo criterio. CRITERI DI ANALISI (Punteggio 0–15): Rilevamento pattern (pin bar, engulfing) Analisi Multi-Timeframe (conferma del trend su timeframe superior
NexusSignal Scalping
Vincent Jose Proenca
DESCRIZIONE TECNICA Nexus Signal System è un indicatore MT4 che combina 12 criteri tecnici per generare segnali di trading. Il sistema analizza la congiunzione di più fattori (trend, momentum, volume, zone di supporto/resistenza) prima di confermare un segnale, riducendo il numero di falsi segnali rispetto agli indicatori che utilizzano un solo criterio. CRITERI DI ANALISI (Punteggio 0–15): Rilevamento pattern (pin bar, engulfing) Analisi Multi-Timeframe (conferma del trend su timeframe superior
VR Signal
Vincent Jose Proenca
VolumeRejectionSignals v5.0 Indicatore avanzato di analisi del volume Descrizione generale VolumeRejectionSignals v5.0 è un indicatore tecnico avanzato progettato per identificare con precisione movimenti significativi dei prezzi attraverso un’analisi approfondita dei rifiuti di volume. Combinando la dinamica del flusso di ordini e la struttura del mercato, rileva le zone in cui la pressione di acquisto o vendita diminuisce, permettendo di anticipare inversioni o accelerazioni di tendenza. Sist
Liquidity Compression MT4
Vincent Jose Proenca
5 (1)
Indicatore Istituzionale di Compressione della Liquidità L’indicatore misura in tempo reale il restringimento della liquidità utilizzando la larghezza normalizzata delle Bande di Bollinger, il volume e lo spread medio, per individuare le fasi di compressione prima dei breakout di prezzo. Visualizzazione: Finestra separata in stile professionale, con istogramma “Compression Score” e linea di soglia (“Threshold”). Caratteristiche Principali Rilevamento precoce: Identifica le zone di contrazione p
Mean Reversion Probability – Indicatore di Reversione Statistica Descrizione breve Indicatore istituzionale che calcola la probabilità statistica di un ritorno alla media mobile 200, basato sull’analisi delle sovra-estensioni storiche. Identifica con precisione quantitativa le zone di affaticamento del mercato. Caratteristiche principali Analisi statistica avanzata – Costruisce un database di oltre 500 estensioni storiche per calcolare probabilità reali Punteggio di probabilità 0–99% – Quantif
WBP Chart Signals
Vincent Jose Proenca
Italiano – WBP Chart Signals – Indicatore di pressione di acquisto/vendita multi-timeframe Descrizione: WBP Chart Signals è un indicatore avanzato che misura la pressione del mercato attraverso l’analisi di volume, spread e price action. Ideale per i trader che desiderano segnali precisi con conferma multi-timeframe e analisi in stile istituzionale. Caratteristiche principali: Weighted Buy Pressure (WBP): Algoritmo proprietario che combina VWAP, MA200, forza del volume, liquidità e momentum Ana
ARB è un indicatore progettato per identificare opportunità di breakout ad alta probabilità, grazie a un sistema di canali ATR adattivi e a un modello di punteggio multifattoriale preciso (0–100). Combina volatilità, volume, momentum e tendenza multi–timeframe per offrire segnali filtrati, visivi e utilizzabili in tempo reale. PRINCIPI DI FUNZIONAMENTO L’indicatore si basa sul concetto di Adaptive Range Breakout (ARB) , un approccio moderno al trading di rotture che regola automaticamente le sog
Filtro:
Lamar Jackson
362
Lamar Jackson 2026.02.17 08:39 
 

L'utente non ha lasciato alcun commento sulla valutazione.

Rispondi alla recensione