Transaction Speed MT5

5

L’indicatore evidenzia le zone in cui viene dichiarato interesse sul mercato, per poi mostrare la zona di accumulo degli ordini.
Funziona come un book degli ordini su larga scala.
Questo è l’indicatore per i grandi capitali. Le sue prestazioni sono eccezionali.
Qualsiasi interesse ci sia nel mercato, lo vedrai chiaramente.

(Questa è una versione completamente riscritta e automatizzata – non è più necessaria un’analisi manuale.)
La velocità di transazione è un indicatore concettualmente nuovo che mostra dove e quando si accumulano grandi ordini sul mercato e quali vantaggi offre.
Riesce a rilevare i cambiamenti di tendenza in fase molto precoce.
Nel Forex, il volume viene spesso frainteso: in realtà si tratta di variazione di prezzo nel tempo, quindi il termine corretto è velocità di transazione.
Tutto dipende da come pensiamo, agiamo e analizziamo.
Cambiare paradigma è essenziale.
Questo indicatore ridefinisce completamente il concetto di volume nel Forex, applicando una logica precisa e trasformandola in uno strumento unico e accurato.

Come si usa:

Per impostazione predefinita, l’indicatore è in modalità automatica e può essere utilizzato su qualsiasi timeframe.
Per passare alla modalità manuale, basta cliccare sul pulsante Auto / Manual Mode.

In modalità manuale, tutti i calcoli iniziano dal 1º gennaio 2025.
È possibile modificare liberamente questa data per osservare risultati diversi.
Il periodo dati ottimale è di quattro-sei mesi, così da includere diversi cicli di mercato e garantire basi solide.
Più è lungo il periodo, meno zone vengono visualizzate.

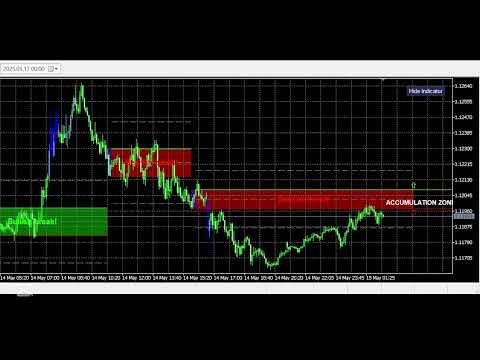
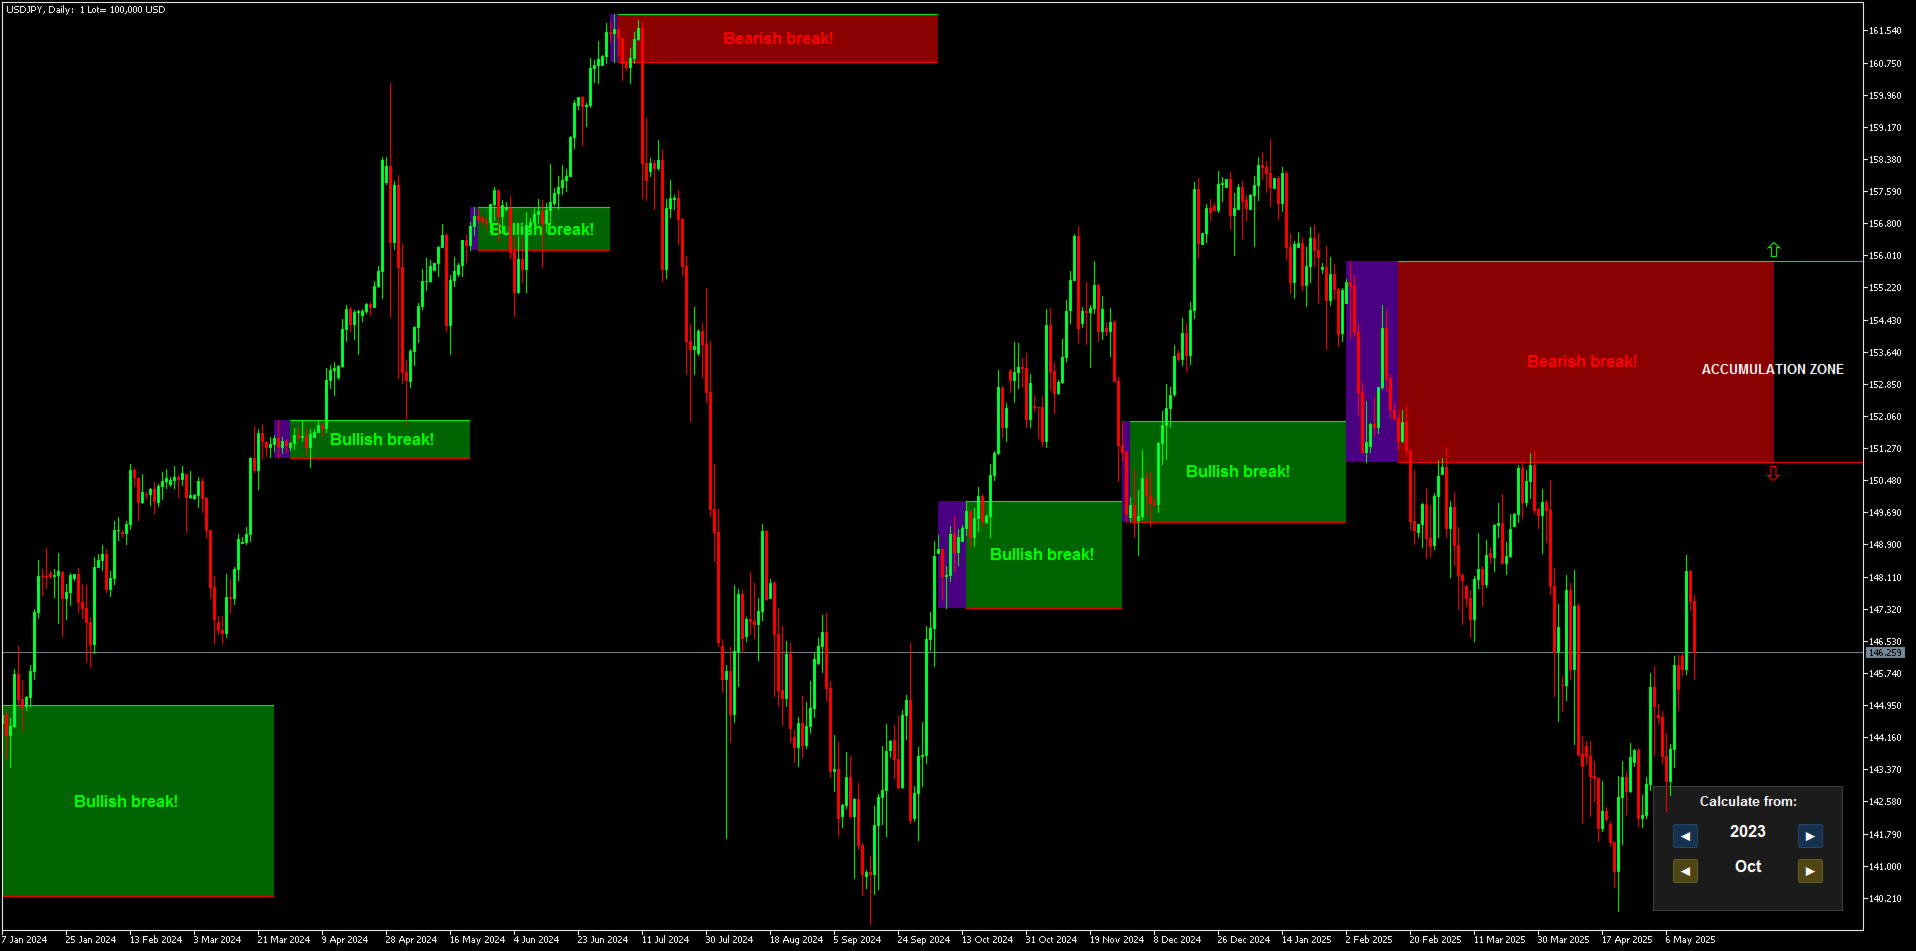
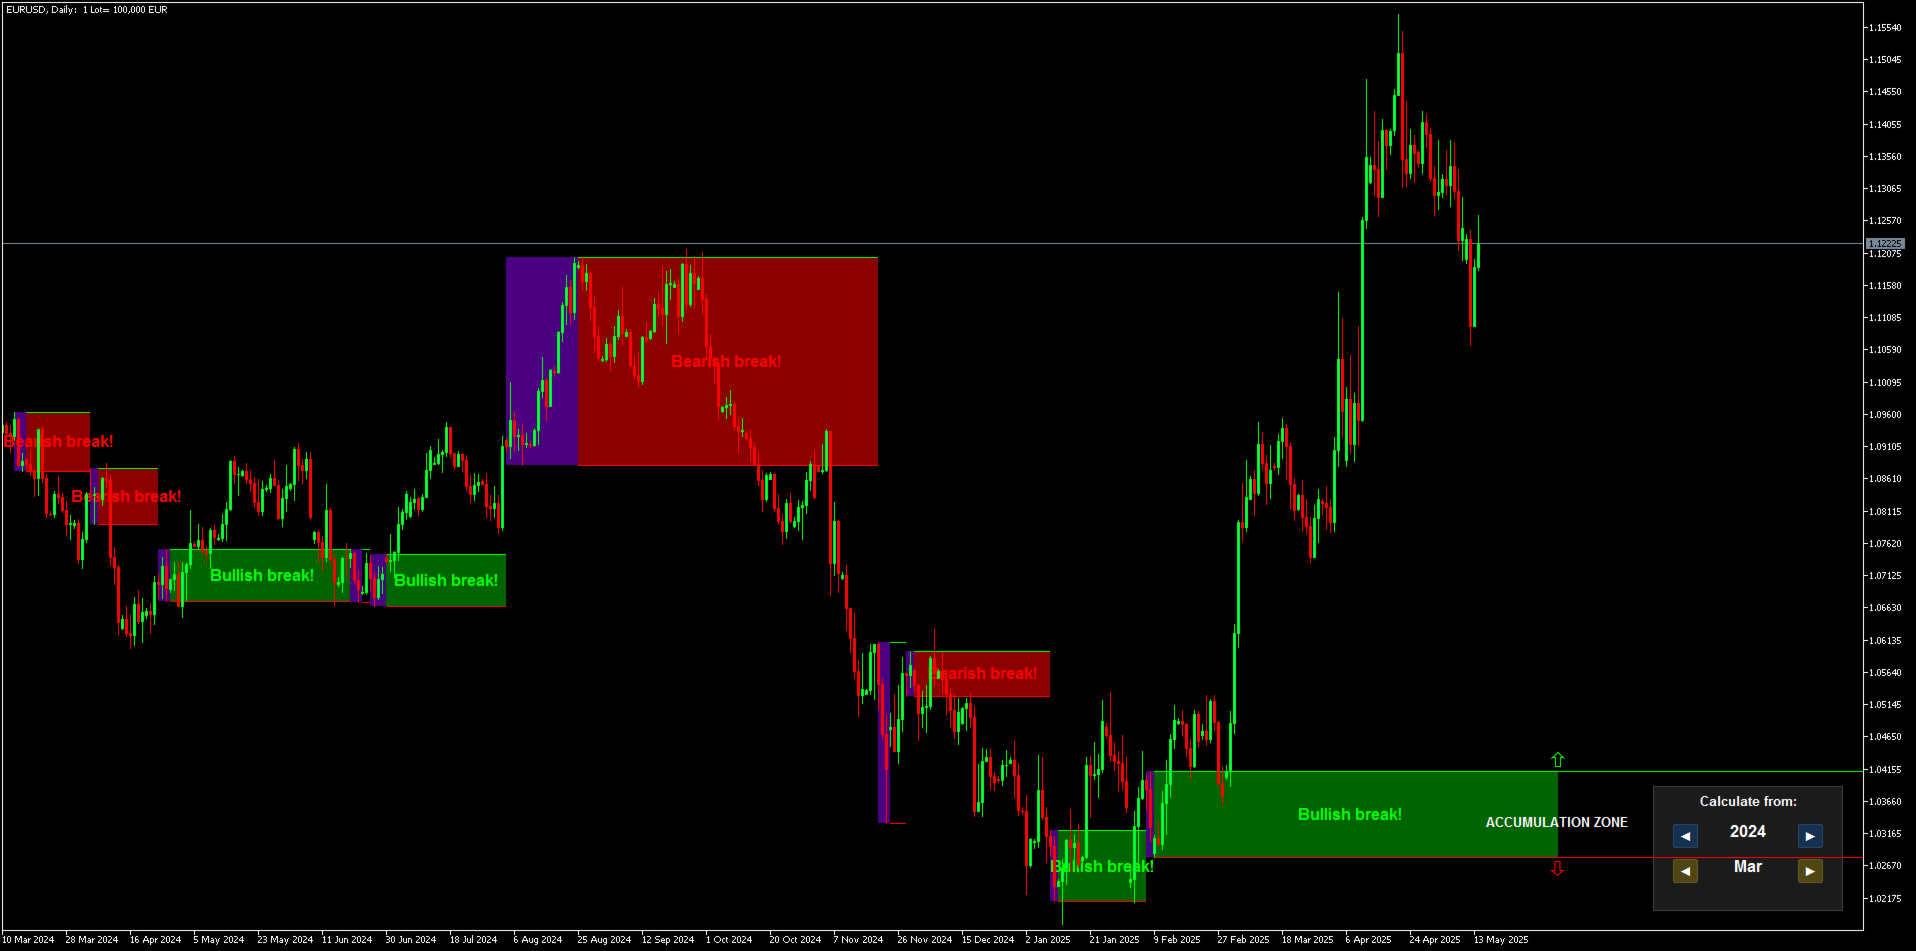
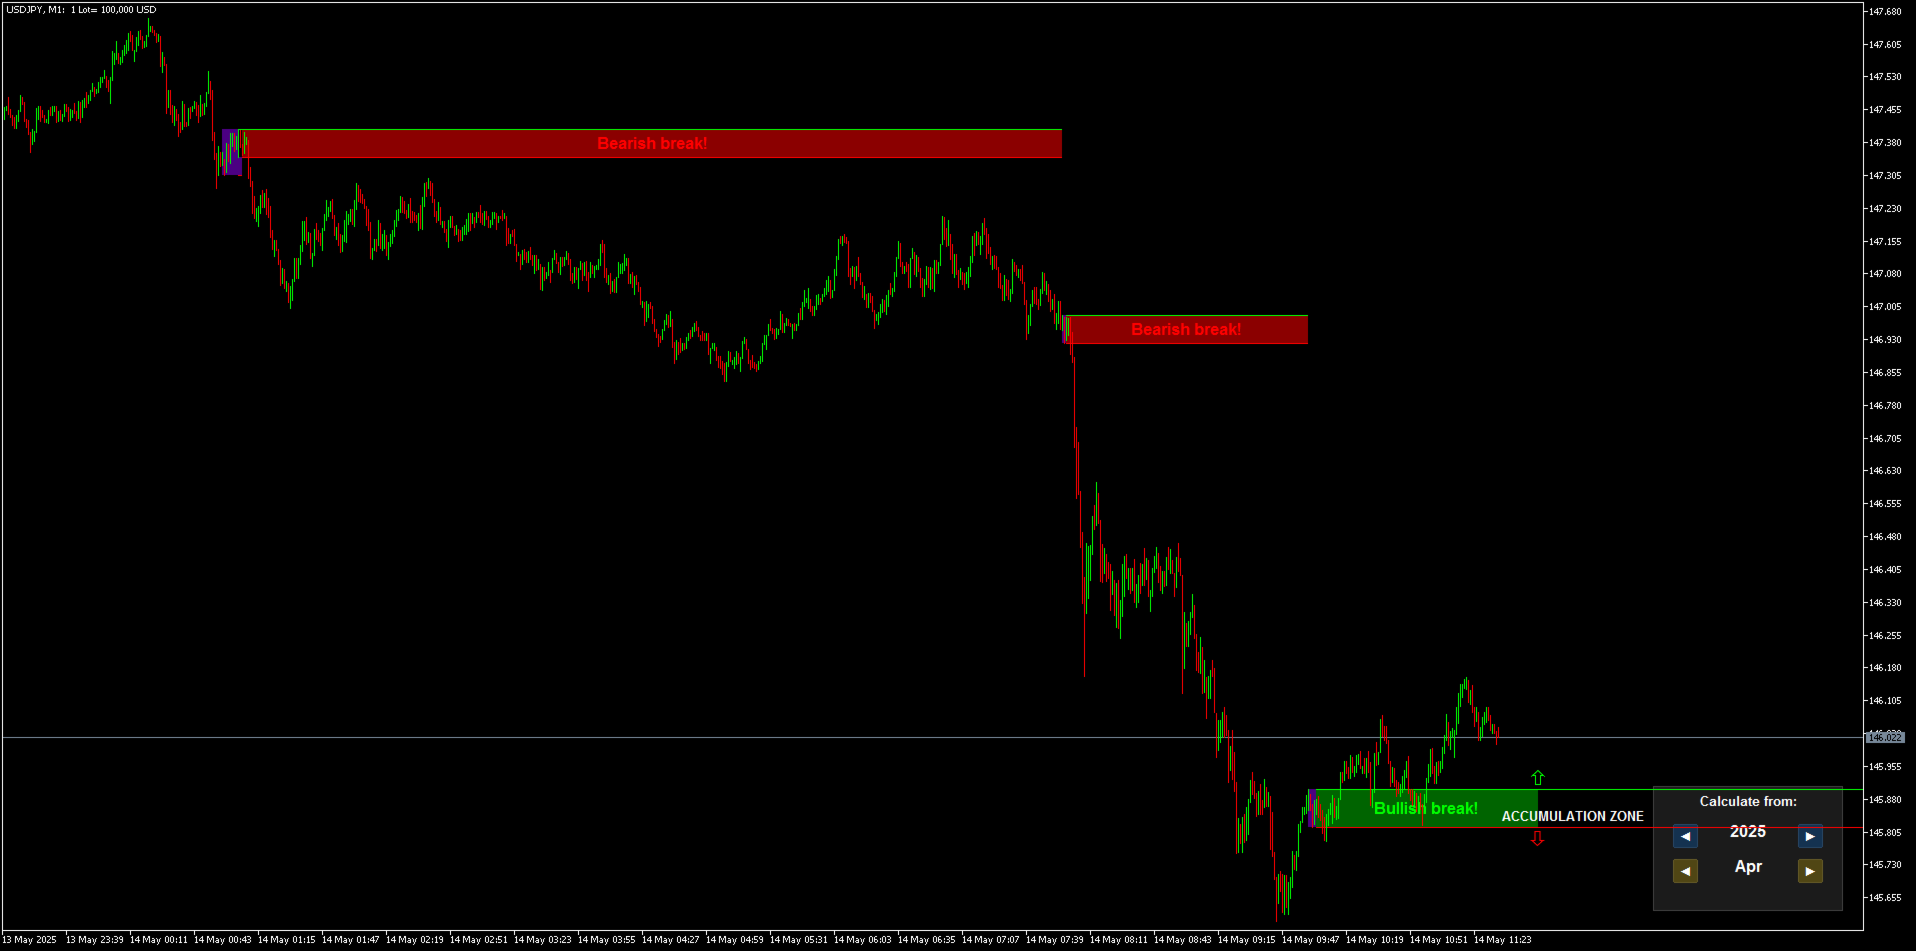
La zona in cui il mercato mostra interesse dichiarato è indicata con un rettangolo viola.
Successivamente, viene mostrata la zona di accumulo degli ordini.

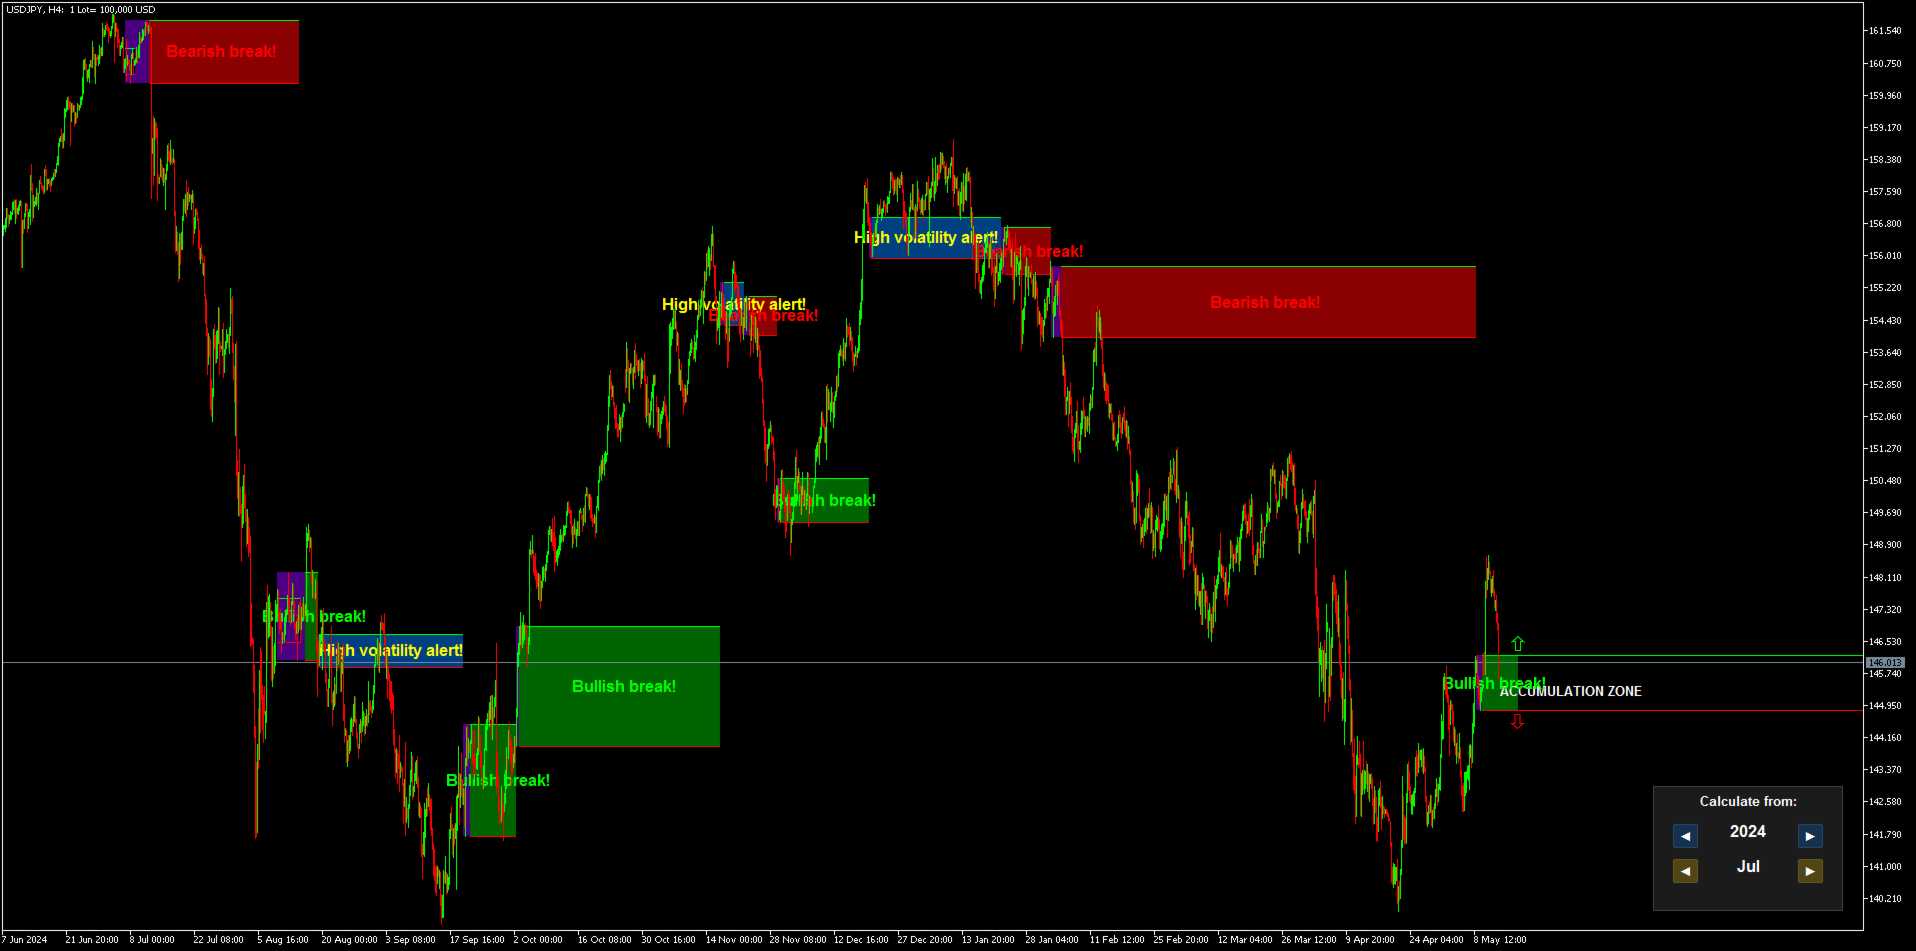
  • Se il mercato rompe sopra questa zona, la tendenza è rialzista e la zona diventa verde;

  • Se rompe sotto, la tendenza è ribassista e la zona diventa rossa.

Una candela che chiude completamente al di fuori della zona, senza toccarne i bordi, è considerata un vero breakout.

Quando una candela si forma completamente fuori dalla zona di accumulo, segnala un breakout e mostra la direzione del mercato.
La tendenza rimane valida fino a un breakout opposto o alla comparsa di una nuova zona di interesse.

Puoi fare trading seguendo la logica “da zona a zona”:

Esempio 1:
Quando c’è un breakout della zona di accumulo, apri un’operazione nella direzione del mercato.

Esempio 2:
Sul grafico H4 c’è un breakout rialzista e il mercato sale. Dopo un po’ appare una zona su H1.
Puoi chiudere la posizione e aspettare che la zona H1 indichi la prossima direzione.

Esempio 3:
Se ti trovi all’interno di una zona, puoi vendere dalla parte superiore o acquistare da quella inferiore, finché non c’è un breakout.
Questa è una strategia di trading in range, ma più rischiosa.
Non fare mai trading contro l’indicatore! Mai!

Se una zona viene rotta su entrambi i lati, riceverai un segnale di alta volatilità (High Volatility Alert).

Queste sono le tracce del denaro.
E tutto ciò non è visibile a occhio nudo, perché nel Forex si usa il volume per tick, uno dei più grandi equivoci del mercato.
Questo indicatore di velocità di transazione converte il volume per tick in attività reale di mercato.

È uno strumento estremamente serio, pensato per analisi avanzate.

Raccomandazioni:

  • Coppie di valute: solo strumenti con alto volume per tick – EUR/USD, USD/JPY, GBP/USD, ecc.

  • Timeframe: tutti

  • Deposito minimo: nessuno

  • Tipo di conto: nessuna limitazione

  • Broker: nessuna limitazione (meglio broker grandi per via del maggior volume)

Scienza pura.


Recensioni 2
Max2233
509
Max2233 2025.07.08 10:33 
 

I would like to compliment this work of art composed by IVAN, a very precise indicator and in combination with his other jewels created by him, trading has simply become simpler and more intuitive. A round of applause to IVAN.

Mase
1729
Mase 2025.05.29 14:17 
 

Simply perfect! In combination with Ivan's other technical indicators, it is a powerful tool. Warning: highly addictive, as the indicators bring so much joy and success. Highly recommended.

Prodotti consigliati
Trade smarter, not harder: Empower your trading with Harmonacci Patterns This is arguably the most complete harmonic price formation auto-recognition indicator you can find for the MetaTrader Platform. It detects 19 different patterns, takes fibonacci projections as seriously as you do, displays the Potential Reversal Zone (PRZ) and finds suitable stop-loss and take-profit levels. [ Installation Guide | Update Guide | Troubleshooting | FAQ | All Products ] It detects 19 different harmonic pri
Owl Smart Levels MT5
Sergey Ermolov
4.03 (32)
Versione MT4  |  FAQ L' indicatore Owl Smart Levels è un sistema di trading completo all'interno dell'unico indicatore che include strumenti di analisi di mercato popolari come i frattali avanzati di Bill Williams , Valable ZigZag che costruisce la corretta struttura a onde del mercato, e i livelli di Fibonacci che segnano i livelli esatti di entrata nel mercato e luoghi per prendere profitti. Descrizione dettagliata della strategia Istruzioni per lavorare con l'indicatore Consulente-assistente
Overview Harmonic Patterns MT5 is a technical analysis indicator designed for the MetaTrader 5 platform. It identifies and displays harmonic price patterns, such as Butterfly, Cypher, Crab, Bat, Shark, and Gartley, in both bullish and bearish directions. The indicator calculates key price levels, including entry, stop loss, and three take-profit levels, to assist traders in analyzing market movements. Visual elements and customizable alerts enhance usability on the chart. Features Detects six ha
Gartley Projections D
Oleksandr Medviediev
3 (2)
The indicator identifies the harmonic patterns (XABCD) according to developments of H.M.Gartley ( "Profits in the Stock Market" , 1935г). It projects D-point as a point in the perspective projection (specify ProjectionD_Mode = true in the settings). Does not redraw. When a bar of the working timeframe closes, if the identified pattern point has not moved during Patterns_Fractal_Bars bars, an arrow appears on the chart (in the direction of the expected price movement). From this moment on, the ar
Matreshka
Dimitr Trifonov
5 (2)
Matreshka self-testing and self-optimizing indicator: 1. Is an interpretation of the Elliott Wave Analysis Theory. 2. Based on the principle of the indicator type ZigZag, and the waves are based on the principle of interpretation of the theory of DeMark. 3. Filters waves in length and height. 4. Draws up to six levels of ZigZag at the same time, tracking waves of different orders. 5. Marks Pulsed and Recoil Waves. 6. Draws arrows to open positions 7. Draws three channels. 8. Notes support and re
MercariaPattern1-2-3 відстежує рух ціни, знаходить трьоххвильові структури 1-2-3 та підсвічує момент, коли сценарій підтверджується пробоєм ключового рівня. MercariaPattern1-2-3 tracks price movement, detects three-leg 1-2-3 structures and highlights the moment when the scenario is confirmed by a key level breakout. Індикатор збирає локальні свінги в компактну фігуру 0–1–2–3 , чекає підтвердженого пробою та будує стрілку входу з готовими рівнями SL/TP. The indicator combines local swings into a
The RSI Divergence + FVG Signal indicator combines Relative Strength Index (RSI) Divergence with Fair Value Gap (FVG) detection to generate high-probability buy and sell signals based on both momentum shifts and institutional imbalance zones. Core Features: RSI Divergence Detection : Identifies both regular and hidden bullish/bearish divergences between price and RSI. Divergences indicate potential trend reversals or continuation. FVG Zone Recognition : Detects Fair Value Gaps (imbalances caused
Noize Absorption Index - is the manual trading system that measures the difference of pressure between bears forces and bulls forces. Green line - is a noize free index that showing curent situation. Zero value of index shows totally choppy/flat market.Values above zero level shows how powerfull bullish wave is and values below zero measures bearish forces.Up arrow appears on bearish market when it's ready to reverse, dn arrow appears on weak bullish market, as a result of reverse expectation.
Il livello Premium è un indicatore unico con una precisione superiore all'80% delle previsioni corrette! Questo indicatore è stato testato dai migliori Specialisti di Trading per più di due mesi! L'indicatore dell'autore che non troverai da nessun'altra parte! Dagli screenshot puoi vedere di persona la precisione di questo strumento! 1 è ottimo per il trading di opzioni binarie con un tempo di scadenza di 1 candela. 2 funziona su tutte le coppie di valute, azioni, materie prime, criptovalu
ATrend
Zaha Feiz
4.82 (17)
"ATREND: Come funziona e come utilizzarlo" ### Come funziona L'indicatore "ATREND" per la piattaforma MT5 è progettato per fornire ai trader robusti segnali di acquisto e vendita utilizzando una combinazione di metodologie di analisi tecnica. Questo indicatore sfrutta principalmente l'Average True Range (ATR) per la misurazione della volatilità, insieme ad algoritmi di individuazione dei trend per identificare potenziali movimenti di mercato. Lascia un messaggio dopo l'acquisto e ricevi un rega
The indicator detects and displays М. Gartley's Butterfly pattern. The pattern is plotted by the extreme values of the ZigZag indicator (included in the resources, no need to install). After detecting the pattern, the indicator notifies of that by the pop-up window, a mobile notification and an email. The pattern and wave parameters are displayed on the screenshots. The default parameters are used for demonstration purposes only in order to increase the amount of detected patterns. Parameters z
Manyal trading system, CovEchoTrend Robot, focuses on reliability and flexibility. By employing statistical analysis methods to study the relationships between the base indicator and market patterns, the system enables a deeper understanding of market processes. Intelligent pattern analysis: The application of statistical data processing helps identify key trend reversal points more accurately, signaling significant market shifts. Informed decision-making is based on the intersection of indicato
L'indicateur SMC Venom Model BPR est un outil professionnel pour les traders travaillant dans le concept Smart Money (SMC). Il identifie automatiquement deux modèles clés sur le graphique des prix: FVG   (Fair Value Gap) est une combinaison de trois bougies, dans laquelle il y a un écart entre la première et la troisième bougie. Forme une zone entre les niveaux où il n'y a pas de support de volume, ce qui conduit souvent à une correction des prix. BPR   (Balanced Price Range) est une combinaiso
STRICTLY FOR BOOM INDEX ONLY!!!!! Here I bring the Maximum Trend Arrows OT1.0 MT5 indicator. This indicator is made up of a combination of different trend indicators for entries and exits, for entries an orange arrow will paint on the chart below the current market and a red flag for closing of trades and it produces buy arrows only. When the orange arrow appears, it will appear along with it's sound to notify you. The 1H timeframe is recommended, don't use it anywhere else than on the 1H timefr
PREngulfing
Slobodan Manovski
PR EA - Engulfing Pattern Trading System Automated Engulfing Pattern Detection with MA Confirmation The PR EA is a Meta Trader 5 expert advisor that identifies and trades bullish/bearish engulfing candlestick patterns when confirmed by a moving average filter. Designed for swing trading on 30-minute charts with compatibility for M15 and H1 time frames. Key Features: Pattern Recognition - Detects valid bullish/bearish engulfing candle formations Trend Confirmation - 238-period SMA filter
# DRAWDOWN INDICATOR V4.0 - The Essential Tool to Master Your Trading ## Transform Your Trading with a Complete Real-Time Performance Overview In the demanding world of Forex and CFD trading, **knowing your real-time performance** isn't a luxury—it's an **absolute necessity**. The **Drawdown Indicator V4.0** is much more than a simple indicator: it's your **professional dashboard** that gives you a clear, precise, and instant view of your trading account status. --- ## Why This Indicator
The   Fibonacci Confluence Toolkit   is a technical analysis tool designed to help traders identify potential price reversal zones by combining key market signals and patterns. It highlights areas of interest where significant price action or reactions are anticipated, automatically applies Fibonacci retracement levels to outline potential pullback zones, and detects engulfing candle patterns. Its unique strength lies in its reliance solely on price patterns, eliminating the need for user-define
##   ONLY GOLD ##   Тiльки Золото ## **Mercaria Professional Trading Zones - Complete Guide** ## **Mercaria Professional Trading Zones - Повний посібник** ### **How Mercaria Zones Work / Як працюють зони Mercaria** **English:** Mercaria Zones is an advanced trading indicator that identifies high-probability support and resistance areas using ZigZag extremes combined with mathematical zone calculations. The indicator works on multiple timeframes simultaneously, providing a comprehensive view
Time And Sales Delta
Evgeny Shevtsov
5 (2)
The indicator displays the delta and the cumulative delta based on the "Time & Sales" deals list data. In addition to the standard timeframes, the indicator displays data regarding the seconds timeframes (S5, S10, S15, S20, S30) to choose from. Using the rectangle, user can select an arbitrary area in the indicator subwindow to view the ratio of the volumes of deals of buyers and sellers within this area. Indicator features: The indicator works correctly only on those trading symbols for which
Innanzitutto, vale la pena sottolineare che questo Strumento di Trading è un Indicatore Non-Ridipingente, Non-Ridisegnante e Non-Laggante, il che lo rende ideale per il trading professionale. Corso online, manuale utente e demo. L'Indicatore Smart Price Action Concepts è uno strumento molto potente sia per i nuovi che per i trader esperti. Racchiude più di 20 utili indicatori in uno solo, combinando idee di trading avanzate come l'Analisi del Trader del Circolo Interno e le Strategie di Tradin
Terra Infinity is a flat indicator. This improved version of the CalcFlat indicator has three additional lines that significantly increase its effectiveness. Unlike its predecessor with two static levels, Terra Infinity adds three dynamic lines above the main histogram, which are interpreted as follows: base signal line, minimum signal line, maximum signal line. These lines are formed using the additional parameter Avg, which is the average value of the histogram. Averaging produces a line cl
The  SuperTrend Advance Trading  is a widely-used technical indicator based on  SuperTrend Strategy + Price Action + EMA . How it works: -  Buy/Sell Signals  can be generated when the trend reverses, the conditions of Price action, TrendLine and EMA are met. - After the  Signal  appears, be patient and wait until the candle closes, at that time place the order as soon as possible. You may have time to review your entry, consider whether it is a good entry or not. - Carefully review the entry, up
Gioteen Volatility Index (GVI) - your ultimate solution to overcoming market unpredictability and maximizing trading opportunities. This revolutionary indicator helps you in lowering your losing trades due to choppy market movements. The GVI is designed to measure market volatility, providing you with valuable insights to identify the most favorable trading prospects. Its intuitive interface consists of a dynamic red line representing the volatility index, accompanied by blue line that indicate
Double HMA MTF for MT5
Pavel Zamoshnikov
4 (4)
This is an advanced multi-timeframe version of the popular Hull Moving Average (HMA) Features Two lines of the Hull indicator of different timeframes on the same chart. The HMA line of the higher timeframe defines the trend, and the HMA line of the current timeframe defines the short-term price movements. A graphical panel with HMA indicator data from all timeframes at the same time . If the HMA switched its direction on any timeframe, the panel displays a question or exclamation mark with a tex
Engulfing with EMAs Indicator Unlock the power of advanced candlestick pattern detection with the Engulfing with EMAs Indicator , a cutting-edge tool designed for MetaTrader 5. This futuristic indicator combines the precision of engulfing pattern analysis with the trend-following strength of Exponential Moving Averages (EMA 21 and EMA 50), empowering traders to identify high-probability setups across all currency pairs and timeframes. Key Features: Comprehensive Engulfing Detection : Detects b
Ultimate Boom and Crash Indicator The Ultimate Boom and Crash Indicator is a cutting-edge tool developed by  Coetsee Digital , designed to identify potential spike opportunities in the market. Crafted for traders focusing on Deriv and Weltrade synthetic markets, this indicator is optimized to operate exclusively on the 3-minute (M3), 5-minute (M5), 15-minute (M15), 30-minute (M30), and 1-hour (H1) timeframes and supports only the following pairs: PainX 1200, PainX 999, PainX 800, PainX 600, Pai
Auto Optimized RSI   è un indicatore a freccia intelligente e facile da usare, progettato per fornire segnali di acquisto e vendita precisi. Utilizza simulazioni di trading su dati storici per individuare automaticamente i livelli RSI più efficaci per ogni strumento e timeframe. Questo indicatore può essere utilizzato come sistema di trading autonomo o integrato nella tua strategia esistente, ed è particolarmente utile per i trader a breve termine. A differenza dei livelli fissi tradizionali del
Introduction to the Manual Backtesting Indicator on MQL5 The MetaTrader platform provides an excellent backtesting tool for evaluating Expert Advisors (EAs). However, when it comes to manually backtesting a strategy to assess its effectiveness, this tool has some limitations: You cannot manually draw zones or trend lines while in backtesting mode. You cannot switch timeframes to check time alignment. For example, if my strategy requires additional confirmation from a higher timeframe (HTF), this
PZ Divergence Trading MT5
PZ TRADING SLU
3.71 (7)
Unlock hidden profits: accurate divergence trading for all markets Tricky to find and scarce in frequency, divergences are one of the most reliable trading scenarios. This indicator finds and scans for regular and hidden divergences automatically using your favourite oscillator. [ Installation Guide | Update Guide | Troubleshooting | FAQ | All Products ] Easy to trade Finds regular and hidden divergences Supports many well known oscillators Implements trading signals based on breakouts Displays
Bullet indicator x
Dorah Zandile Mahesu
The bullet indicator gives accurate direction of the market structure, it will indicate to you the exact direction whether it be the market is in a downtrend or if it's in an uptrend it will give you that information which will inturn benefits you by saving you the time it takes to analyse that structure, this indicator works on a timeframes and it's most favourable on higher timeframes. How it works: -The green arrow will be at the support of the structure indicating buys -The red arrow will b
Gli utenti di questo prodotto hanno anche acquistato
AriX
Temirlan Kdyrkhan
1 (4)
AriX Indicator for MT5 A powerful trend-following and signal-evaluation tool AriX is a custom MT5 indicator that combines Moving Averages and ATR-based risk/reward logic to generate clear buy/sell signals. It visualizes dynamic SL/TP levels, evaluates past trade outcomes, and displays win/loss statistics in a clean on-chart panel. Key features include: Buy/Sell signals based on MA crossovers ATR-based SL/TP1/TP2/TP3 levels with visual lines and labels Signal outcome tracking with real-time stat
ARICoins
Temirlan Kdyrkhan
ARICoin is a powerful trading companion designed to generate high-probability entry signals with dynamic TP/SL/DP levels based on volatility. Built-in performance tracking shows win/loss stats, PP1/PP2 hits, and success rates all updated live. Key Features: Buy/Sell signals with adaptive volatility bands Real-time TP/SL/DP levels based on ATR Built-in MA Filter with optional ATR/StdDev volatility Performance stats panel (Success, Profit/Loss, PP1/PP2) Alerts via popup, sound, push, or email Cust
ARIScalping
Temirlan Kdyrkhan
ARIScalp is a powerful trading companion designed to generate high-probability entry signals with dynamic TP/SL/DP levels based on volatility. Built-in performance tracking shows win/loss stats, PP1/PP2 hits, and success rates all updated live. Key Features: Buy/Sell signals with adaptive volatility bands Real-time TP/SL/DP levels based on ATR Built-in MA Filter with optional ATR/StdDev volatility Performance stats panel (Success, Profit/Loss, PP1/PP2) Alerts via popup, sound, push, or email Cus
Ottieni l’indicatore AUX GRATUITO e il supporto EA Download diretto — Clicca qui [ D.I.C.E ] The DICE Indicator  Divergence in Chaos Environment è uno strumento MT5 specializzato per trader che applicano la Teoria delle Onde di Elliott nel contesto delle tecniche di Trading Chaos. Identifica divergenze nascoste e regolari nell’azione dei prezzi, sincronizzate con l’ambiente di mercato caotico descritto da Bill Williams. Caratteristiche principali Divergenza allineata alle Onde di Elliott: rilev
Rtc ML Ai Predictor
Muhammad Faisal Sagala
Rtc ML Ai | Predictor CORE MACHINE LEARNING ENGINE Adaptive ML Market Predictor – Multi-Bar Trend & Candle Forecast What This Indicator Does This indicator is a  real-time market prediction engine  designed to analyze price behavior and estimate  future market tendencies . Unlike conventional indicators, this system  does not rely on static parameters or historical curve-fitting , but adapts its internal state dynamically during live market operation. Instead of using static rules, the indic
L’indicatore analizza il volume da qualsiasi punto e calcola i livelli di esaurimento del mercato per quel volume. Linee principali di Meravith: Linea di esaurimento del volume rialzista – funge da obiettivo. Linea di esaurimento del volume ribassista – funge da obiettivo. Linea di tendenza – indica la tendenza del mercato. Cambia colore a seconda che il mercato sia rialzista o ribassista e funge da supporto di tendenza. Come utilizzarlo: fai doppio clic sulla linea verticale viola e spostala ne
Max Ribbon Mt5
Stefano Frisetti
ATTENZIONE: Questo indicatore è distribuito ESCLUSIVAMENTE su MQL5.com Versione MT4:   https://www.mql5.com/it/market/product/160363 Versione MT5:   https://www.mql5.com/it/market/product/160410 ================================================================================ MAX RIBBON ver 1.00 L'indicatore che ti mostra il TREND in modo chiaro e inequivocabile! ================================================================================ DESCRIZIONE MAX RIBBON è un indicatore di trend
TrendMaestro5
Stefano Frisetti
Attenzione alle truffe, questo indicatore e' distribuito esclusivamente su MQL5.com nota: questo indicatore e' per METATRADER5, se vuoi la versione per  METATRADER4 questo e' il link:   https://www.mql5.com/it/market/product/108106 TRENDMAESTRO ver 2.5 TRENDMAESTRO   riconosce un nuovo TREND sul nascere, non sbaglia mai. La sicurezza di identificare un nuovo TREND non ha prezzo. DESCRIZIONE TRENDMAESTRO identifica un nuovo TREND sul nascere, questo indicatore prende in esame la volatilita' i
Pantera Indicator
Temirlan Kdyrkhan
5 (1)
A tool for on-chart strategy backtesting and performance analysis. A utility for developing, debugging, and testing custom trading ideas and indicator functions. An indicator designed to quickly test trading concepts and visualize the effectiveness of different input parameters. An all-in-one sandbox for testing everything from simple crossovers to complex, multi-condition trading systems.
+++++++++++++++++++++++++++++++++++++++++++++++++++++++++++++++++++++++++++++++++++++++++++++++++ +++ Link to EURUSD Only Free Version -->  https://www.mql5.com/en/market/product/156904?source=Unknown +++++++++++++++++++++++++++++++++++++++++++++++++++++++++++++++++++++++++++++++++++++++++++++++++ Hallo Trader, This is a traditional GANN & FIBONACCI strategy based on detection of an impulsive move in the opposite direction. This is called a Breakout. At the moment of Breakout, the indicator draw
FXLAND Smart Reversal Indicator (MT5) FXLAND Smart Reversal Indicator is a professional technical analysis tool designed to help traders identify potential price reversal zones and key market turning points with clarity and precision. The best reversal indicator and price return by choosing only one ceiling or floor in each time frame A masterpiece of combining mathematics and Gann, fractal matrix, Fibonacci, movement angle and time. Completely intelligent Key Features Detects potenti
VTrende Pro
Andrii Diachenko
5 (1)
VTrende Pro - MTF indicator for trend trading with a display panel for MT5 *** Videos can be translated into any language using subtitles (video language - Russian) Although the signals of the VTrende Pro indicator can be used as signals of a full-fledged trading system, it is recommended to use them in conjunction with the Bill Williams TS. VTrende Pro is an extended version of the VTrende indicator. Difference between Pro version and VTrende: - Time zones - Signal V - signal 1-2 waves -    S
UZFX {SSS} Scalping Smart Signals MT5 è un indicatore di trading ad alte prestazioni non ridipinto progettato per scalper, day trader e swing trader che richiedono segnali accurati e in tempo reale in mercati in rapida evoluzione. Sviluppato da (UZFX-LABS), questo indicatore combina l'analisi dell'andamento dei prezzi, la conferma del trend e il filtraggio intelligente per generare segnali di acquisto e vendita ad alta probabilità su tutte le coppie di valute e tutti i timeframe. Caratteristich
Hello I Want to introduce The Forex Buy Sell Arrow Premium MT5 i recently release this premium indicator! its 1000% Non Repaint Indicator, It Work Perfectly Well,, i tested it day by day, Just mind blowing Result,  Including Powerful trend Algorithm! How It Work? well, it work market trend formula, when trend Bullish Or when trend Bearish,  Recommend Timeframe M30, H1 it work all timeframe, and all currency pair, 100% non repaint, How to take signal From Forex Buy Sell Arrow Premium Ind
WanaScalper
Isaac Wanasolo
1 (1)
A scalping indicator based on mathematical patterns, which on average gives signals with relatively small SL, and also occasionally helps to catch big moves in the markets (more information in the video) This indicator has three main types of notifications: The first type warns of a possible/upcoming signal on the next bar The second type indicates the presence of a ready signal to enter the market/open a position The third type is for SL and TP levels - you will be notified every time price re
MATADOR GOLD – XAUUSD MT5 M5 Timeframe Scalp Signals MATADOR GOLD is a professional signal indicator designed for XAUUSD (Gold) scalping on the M5 timeframe , with optional higher-timeframe confirmation. This indicator does not open or manage trades automatically . It provides structured buy and sell signals, intelligent filtering, and alerts, allowing traders to execute trades using their own strategy and risk management rules. Core Concept (Multi-Concept Architecture) MATADOR GOLD is built
Frontier Pivots
Nestor Jose Mendez Boza
FRONTIER PIVOTS - Geometric Levels Indicator This indicator plots support and resistance levels/ranges on the chart using mathematical calculations. It helps traders identify potential price reaction zones based on geometric patterns. Main Features: Automatically calculates and displays key price levels Plots both support and resistance lines Uses daily price data for level calculation Clean visual presentation with different colors for different level types No repainting - levels remain static
Scalping Winning Signals Pro SWS
Muhammad Usman Siddique
5 (1)
UZFX SWS {Scalping Winning Signals} Pro v1.0 è un potente indicatore non ridipingente sviluppato da Usman Zabir (UZFX LABS) appositamente per scalper, day trader e swing trader alla ricerca di segnali di ingresso precisi in mercati in rapido movimento. Ideale per i trader che richiedono segnali affidabili e in tempo reale senza ritardi o false ridipinture. I MIEI INTERVALLI DI TEMPO CONSIGLIATI*: 30 M E OLTRE. {1H} È IL MIO PREFERITO. E I RISULTATI SONO SORPRENDENTI...! Le caratteristiche prin
Enigma 112
issam rahhal sabour
Enigma 112 Indicator - User Manual Enigma 112 Indicator Complete User Manual - Ultimate Trading Solution Introduction The Enigma 112 is a comprehensive multi-timeframe trading indicator that combines advanced technical analysis concepts including Tesla 3-6-9 Gates, Huddleston Theory, PO3 Dealing Ranges, and sophisticated risk management systems. Tesla 3-6-9 Gates Based on Nikola Tesla's vortex mathematics for precise support and resistance levels Huddleston Theory Volume-based market
The Expert Advisor and the video are attached in the Discussion tab . The robot applies only one order and strictly follows the signals to evaluate the indicator efficiency. Pan PrizMA CD Phase is an option based on the Pan PrizMA indicator. Details (in Russian). Averaging by a quadric-quartic polynomial increases the smoothness of lines, adds momentum and rhythm. Extrapolation by the sinusoid function near a constant allows adjusting the delay or lead of signals. The value of the phase - wave s
Классификатор силы тренда. Показания на истории не меняет. Изменяется классификация только незакрытого бара. По идее подобен полной системе ASCTrend, сигнальный модуль которой, точнее его аппроксимация в несколько "урезанном" виде, есть в свободном доступе, а также в терминале как сигнальный индикатор SilverTrend . Точной копией системы ASCTrend не является. Работает на всех инструментах и всех временных диапазонах. Индикатор использует несколько некоррелируемых между собой алгоритмов для класси
FFx Universal Strength Meter PRO is more than a basic strength meter. Instead of limiting the calculation to price, it can be based on any of the 19 integrated strength modes + 9 timeframes. With the FFx USM, you are able to define any period for any combination of timeframes. For example, you can set the dashboard for the last 10 candles for M15-H1-H4… Full flexibility! Very easy to interpret... It gives a great idea about which currency is weak and which is strong, so you can find the best pai
The FFx Universal MTF alerter shows on a single chart all the timeframes (M1 to Monthly) with their own status for the chosen indicator. 9 indicators mode (MACD-RSI-Stochastic-MA-ADX-Ichimoku-Candles-CCI-PSAR). Each can be applied multiple times on the same chart with different settings. Very easy to interpret. Confirm your BUY entries when most of the timeframes are showing green color. And confirm your SELL entries when most of the timeframes are showing red color. 2 Alert Options : input to s
The FFx Watcher PRO is a dashboard displaying on a single chart the current direction of up to 15 standard indicators and up to 21 timeframes. It has 2 different modes: Watcher mode: Multi Indicators User is able to select up to 15 indicators to be displayed User is able to select up to 21 timeframes to be displayed Watcher mode: Multi Pairs User is able to select any number of pairs/symbols User is able to select up to 21 timeframes to be displayed This mode uses one of the standard indicators
FFx Patterns Alerter gives trade suggestions with Entry, Target 1, Target 2 and StopLoss .... for any of the selected patterns (PinBar, Engulfing, InsideBar, OutsideBar) Below are the different options available: Multiple instances can be applied on the same chart to monitor different patterns Entry suggestion - pips to be added over the break for the entry 3 different options to calculate the SL - by pips, by ATR multiplier or at the pattern High/Low 3 different options to calculate the 2 TPs -
MetaTrader 4 version available here : https://www.mql5.com/en/market/product/24881 FFx Basket Scanner is a global tool scanning all pairs and all timeframes over up to five indicators among the 16 available. You will clearly see which currencies to avoid trading and which ones to focus on. Once a currency goes into an extreme zone (e.g. 20/80%), you can trade the whole basket with great confidence. Another way to use it is to look at two currencies (weak vs strong) to find the best single pairs
MetaTrader 4 version available here: https://www.mql5.com/en/market/product/25793 FFx Pivot SR Suite PRO is a complete suite for support and resistance levels. Support and Resistance are the most used levels in all kinds of trading. Can be used to find reversal trend, to set targets and stop, etc. The indicator is fully flexible directly from the chart 4 periods to choose for the calculation: 4Hours, Daily, Weekly and Monthly 4 formulas to choose for the calculation: Classic, Camarilla, Fibonac
ClassicSBA
Umri Azkia Zulkarnaen
this indicator very simple and easy if you understand and agree with setup and rule basic teknical sba you can cek in link : please cek my youtube channel for detail chanel : an for detail info  contact me  basicly setup buy (long) for this indicator is Magenta- blue and green candle or magenta - green  and green candlestik and for setup sell (short) is Black - yellow - and red candle or black - red  and red candlestik
Pendiente de Precio
Cesar Juan Flores Navarro
Indicador en base a la pendiente de la linea de precio, dibuja una línea de color cuando sube a base de los precios que previamente has sido procesados o linealizados, y cuando baja la pendiente la linea linealizada toma otro color. En este caso se a considerado 6 lineas de diferentes procesos desde pendientes largas hacia las cortas, observándose que cuando coincidan las pendientes se produce un máximo o mínimo, lo que a simple vista nos permitirá hacer una COMPRA O VENTA.
Индикатор Coefficient Of Determination (COD) представляет собой значение коэффициента детерминации или квадрат коэффициента корреляции между зависимой переменной — ценой и объясняющей переменной — тиковым объемом. Что это дает нам на практике? COD отлично распознает кульминацию трендовых движений, что позволяет подбирать оптимальные точки и ловить развороты рынка. Как использовать индикатор: Наиболее популярная торговая стратегия строится совместно с трендовым индикатором Moving Average (MA), пе
Altri dall’autore
Meravith
Ivan Stefanov
5 (1)
L'indicatore analizza il volume da ogni punto e calcola i livelli di esaurimento del mercato per quel volume. È composto da tre linee: Linea di esaurimento del volume rialzista Linea di esaurimento del volume ribassista Una linea che indica la tendenza del mercato. Questa linea cambia colore per riflettere se il mercato è rialzista o ribassista. Puoi analizzare il mercato da qualsiasi punto di partenza tu scelga. Una volta che una linea di esaurimento del volume è raggiunta, identifica un nuovo
L’indicatore analizza il volume da qualsiasi punto e calcola i livelli di esaurimento del mercato per quel volume. Linee principali di Meravith: Linea di esaurimento del volume rialzista – funge da obiettivo. Linea di esaurimento del volume ribassista – funge da obiettivo. Linea di tendenza – indica la tendenza del mercato. Cambia colore a seconda che il mercato sia rialzista o ribassista e funge da supporto di tendenza. Come utilizzarlo: fai doppio clic sulla linea verticale viola e spostala ne
Uno dei pochi indicatori che calcola i livelli esclusivamente in base al prezzo. L’indicatore non è influenzato dai timeframe, dai trend o dai cicli di mercato. Uno degli indicatori più logici mai creati. L’indicatore FIFTY è ora disponibile in una versione automatica, che elimina la necessità di tracciare manualmente i livelli. Questa versione disegna automaticamente sul grafico i livelli giornalieri, settimanali, mensili e annuali, garantendo precisione e risparmio di tempo. Inoltre, sono pres
Meravith AUTO
Ivan Stefanov
5 (1)
Meravith Auto è una versione automatizzata del sistema di trading Meravith. L'indicatore è composto da una linea di tendenza che cambia colore. Quando è rialzista è verde, quando è ribassista è rossa. Questa è la linea di supporto del trend. Una linea di liquidità, dove il volume rialzista è uguale al volume ribassista. Una linea di deviazione rialzista tripla. Una linea di deviazione ribassista tripla. Punti viola e blu che indicano un volume elevato. Il punto viola indica un volume maggiore di
MACD divergency
Ivan Stefanov
5 (4)
Questo indicatore identifica con precisione le divergenze rialziste e ribassiste tra i movimenti di prezzo e l’istogramma MACD, utilizzando medie mobili esponenziali (EMA) con periodi di 5 (veloce) e 34 (lenta) e una linea di segnale con periodo 5. L’indicatore mette in evidenza i punti in cui il momentum si indebolisce, segnalando possibili inversioni di trend. Regole per la corretta identificazione delle divergenze La divergenza rialzista è valida quando il prezzo forma massimi crescenti e l’i
FREE
Horizont
Ivan Stefanov
Horizont è un sistema di trading che fornisce una configurazione completa di operazione: punto di ingresso, target 1, target 2 e stop loss, tutti calcolati automaticamente. Il sistema identifica automaticamente i massimi e i minimi del mercato e li collega per definire il trend attuale. Lei seleziona quale trend tradare e Horizont genera i relativi livelli di ingresso, target e stop. Il sistema include una gestione automatica del rischio. Controlla il saldo del conto, calcola il rischio e sugge
Meravith Auto è una versione automatizzata del sistema di trading Meravith. L'indicatore è composto da una linea di tendenza che cambia colore. Quando è rialzista è verde, quando è ribassista è rossa. Questa è la linea di supporto del trend. Una linea di liquidità, dove il volume rialzista è uguale al volume ribassista. Una linea di deviazione rialzista tripla. Una linea di deviazione ribassista tripla. Punti viola e blu che indicano un volume elevato. Il punto viola indica un volume maggiore di
Oscillatore di momentum avanzato che regola automaticamente il suo periodo in base alla volatilità del mercato per segnali di ipercomprato e ipervenduto più accurati. Come Funziona: L'indicatore utilizza un calcolo del periodo adattivo che si riduce durante l'alta volatilità e si allunga durante la bassa volatilità. Questa regolazione dinamica fornisce segnali più rapidi quando il mercato è in trend e riduce i falsi segnali durante le fasi di lateralità. Il valore RSI viene calcolato sulla base
FREE
Questo indicatore è uno strumento interattivo di etichettatura delle Onde di Elliott per MetaTrader 4 e 5. Consente all’utente di posizionare manualmente le etichette delle onde direttamente sul grafico, selezionando la dimensione dell’etichetta, il colore e il tipo di onda (correzioni ABC, impulsi a 5 onde o strutture WXY) da un menu sul grafico. Con un solo clic sul grafico, l’indicatore posiziona in modo sequenziale le etichette delle onde appropriate nel prezzo e nel tempo scelti, aiutando i
FREE
Separated Volume
Ivan Stefanov
5 (1)
Questo indicatore separa efficacemente il volume dei tick nel mercato forex in categorie rialziste e ribassiste. Inoltre, fornisce la funzionalità di calcolare e visualizzare la somma dei volumi dei tick rialzisti e ribassisti per qualsiasi periodo selezionato a scelta. È possibile regolare facilmente il periodo spostando le due linee blu sul grafico, consentendo un'analisi dei volumi personalizzabile e precisa, adatta alle proprie esigenze di trading. Se lo trovate utile, le vostre recensio
FREE
Questo indicatore è uno strumento interattivo di etichettatura delle Onde di Elliott per MetaTrader 4 e 5. Consente all’utente di posizionare manualmente le etichette delle onde direttamente sul grafico, selezionando la dimensione dell’etichetta, il colore e il tipo di onda (correzioni ABC, impulsi a 5 onde o strutture WXY) da un menu sul grafico. Con un solo clic sul grafico, l’indicatore posiziona in modo sequenziale le etichette delle onde appropriate nel prezzo e nel tempo scelti, aiutando i
FREE
Livelli leggendari di William Gann in un indicatore MT5 completamente automatizzato. GANN Master individua le zone chiave in cui il prezzo è più probabile che si inverta o continui il trend, basandosi sui dati Daily, Weekly e Monthly. Funzionalità principali Pulsanti a clic singolo per il periodo: clicca Daily, Weekly o Monthly per tracciare istantaneamente le zone relative al giorno, alla settimana o al mese correnti Modalità Automatica e Manuale • Automatica: GANN Master calcola tutti i livell
Naturu
Ivan Stefanov
5 (1)
“Naturu” è un indicatore manuale che utilizza la simmetria della natura come algoritmo. Conquista il mercato con una strategia semplice e saggezza nascosta! Quando carichi l’indicatore, vedrai due linee: Top e Bottom. Clicca una volta su una linea per attivarla. Per spostarla, basta cliccare sulla candela dove vuoi posizionarla. Definisci un punto alto e un punto basso, e l’indicatore calcola automaticamente: Una zona magenta che mostra dove gli interessi di tori e orsi sono più vicini, ossia l
Sense
Ivan Stefanov
5 (2)
SENSE è un sistema automatizzato che combina metodi GANN selezionati con calcoli frattali. Il sistema ci dice dove aprire e chiudere le operazioni. Non è più necessario perdere tempo in calcoli complessi: SENSE fa tutto per voi. Basta installare l'indicatore. Principi di base: Il mercato è rialzista quando il prezzo è al di sopra delle linee bianche. Comprate sopra le linee bianche, fermatevi sotto Le linee verdi sono obiettivi al rialzo Il mercato è ribassista quando il prezzo è al di sott
Imbalance Pro
Ivan Stefanov
5 (4)
L'indicatore misura lo squilibrio tra tori e orsi in un periodo scelto e mostra una linea retta tra i due punti. Se i tori hanno più volume degli orsi, la linea diventa verde.  Se gli orsi hanno più volume, la linea diventa rossa. La linea mostra anche la differenza percentuale di volume. L'indicatore mostra gli stessi dati in una finestra separata. È possibile vedere anche il volume diviso. L'indicatore ha due modalità. A tale scopo, in alto a sinistra è presente un pulsante che,  - se n
Two Snakes
Ivan Stefanov
5 (1)
2 SNAKES è un sistema di scalping di prima classe. Poiché gli inserimenti sono piuttosto precisi, è probabile che diventiate dipendenti da questo sistema molto rapidamente.  Avete 2 serpenti. Quando vedete una candela al di sopra o al di sotto di esse che non le tocca, questo è il vostro segnale di scalping. Se si utilizza un time frame più ampio, lo scalping può diventare trend following. Le serpentine sono calcolate con precisione in relazione allo stato attuale del mercato. NON SONO me
Questo indicatore si basa sull'esperienza pratica.  Inserite la data/ora del vostro top/bottom. Calcola il livello più visitato dal top/bottom fino al momento attuale. Si aggiorna automaticamente a ogni nuova candela. È possibile utilizzare contemporaneamente più indicatori per diversi trend e timeframe. La lunghezza è sempre tracciata dall'inizio del periodo fino al presente. Utile strumento PRO.
FREE
Enigmera
Ivan Stefanov
5 (8)
ENIGMERA: Il cuore del mercato Importante: La demo di MQL5.com funziona nel Strategy Tester e potrebbe non riflettere completamente le funzionalità di Enigmera. Consulta la descrizione, gli screenshot e il video per maggiori dettagli. Non esitare a inviarmi un messaggio se hai domande! Il codice dell'indicatore è stato completamente riscritto. La versione 3.0 aggiunge nuove funzionalità e corregge i bug accumulati dall'inizio dell'indicatore. Introduzione Questo indicatore e sistema di trading
Levelss
Ivan Stefanov
5 (1)
L'indicatore LEVELSS mostra: - Zona rialzista e ribassista giornaliera. È visibile tutti i giorni dalle 00:00 alle 23:59.  - La zona rialzista e ribassista settimanale. È visibile da lunedì 0:00 a venerdì 23:59 ogni settimana. - Canale appositamente calcolato da un timeframe specifico che viene visualizzato su tutti gli altri timeframe. Per impostazione predefinita, si tratta del timeframe a 4 ore, che può essere modificato in qualsiasi altro timeframe si desideri operare. Viene calcolato senz
GANN Master
Ivan Stefanov
5 (1)
Gli obiettivi precisi di GANN sono calcolati secondo i suoi metodi collaudati e presentati chiaramente davanti a te. Questo strumento è progettato per rendere il trading più fluido e intuitivo. Spostando la linea bianca verso l'alto o quella verde verso il basso, capirai subito perché le tecniche di GANN rimangono influenti nel mondo del trading. Le strategie di GANN si concentrano sulla previsione dei movimenti di mercato con grande precisione, e questo strumento porta quel potere a portata di
Stefanov
Ivan Stefanov
The indicator displays support and resistance zones defined logically using the MACD. The entire concept is explained in the video, with specific examples shown. The indicator works on any instruments and timeframes. It does not repaint. After placing it on the chart, please go through all the timeframes sequentially, from monthly to 1-minute, so that all lines load correctly. After that, you can start using it. The concept is unique and has not been seen in other systems or indicators.
Fifty Pro
Ivan Stefanov
5 (1)
L'indicatore FIFTY è ora disponibile in una versione automatizzata, eliminando la necessità di tracciare manualmente i livelli. Questa versione disegna automaticamente i livelli giornalieri, settimanali, mensili e annuali sul grafico, garantendo precisione e risparmiando tempo. Inoltre, sono presenti pulsanti per attivare o disattivare la visibilità di questi livelli, offrendo una personalizzazione completa. Per chi lo preferisce, la versione gratuita dell'indicatore rimane disponibile e complet
Naturu MT4
Ivan Stefanov
“Naturu” è un indicatore manuale che utilizza la simmetria della natura come algoritmo. Conquista il mercato con una strategia semplice e saggezza nascosta! Quando carichi l’indicatore, vedrai due linee: Top e Bottom. Clicca una volta su una linea per attivarla. Per spostarla, basta cliccare sulla candela dove vuoi posizionarla. Definisci un punto alto e un punto basso, e l’indicatore calcola automaticamente: Una zona magenta che mostra dove gli interessi di tori e orsi sono più vicini, ossia l’
Balance Levels è un indicatore di trading facile da usare che fornisce chiari segnali di acquisto e vendita insieme a livelli di prezzo dinamici, aiutando i trader a pianificare ingressi e uscite con maggiore sicurezza. Lo strumento è molto flessibile – può essere utilizzato come strategia autonoma oppure integrato in qualsiasi sistema di trading esistente. Funziona su tutti i timeframe e su tutti i mercati : Forex, Oro, Indici, Criptovalute o Azioni. Balance Levels si adatta a ogni stile di tra
Enigmera MT5
Ivan Stefanov
3.67 (3)
ENIGMERA: Il nucleo del mercato (Questo è un indicatore manuale e contiene funzioni che potrebbero non essere supportate dall’attuale ambiente di test di MetaTrader) Introduzione Questo indicatore e sistema di trading rappresentano un approccio unico ai mercati finanziari. ENIGMERA utilizza cicli frattali per calcolare con precisione i livelli di supporto e resistenza. Mostra la fase autentica di accumulazione e fornisce direzione e obiettivi. È un sistema che funziona sia in tendenza che in fas
SPEKULATOR è un sistema di trading manuale e un indicatore che ti aiuta a identificare le zone di supporto chiave e la direzione del mercato. Padroneggia il mercato con una strategia semplice e una saggezza nascosta. Selezioni un qualsiasi TOP e BOTTOM nel grafico, e l'indicatore disegna: Una zona di supporto per il tuo trend. Per una tendenza rialzista, appare una zona verde; per una tendenza ribassista, una zona rossa. La sensibilità della zona di supporto può essere regolata nelle impostazion
Time Zones Fifty L’indicatore risolve un problema fondamentale: Come dobbiamo contare il tempo? Quali zone usare, come e perché? È basato interamente sulla logica. Applicazione delle zone temporali Per applicare le zone temporali serve un punto di partenza. Questo punto deve essere definito logicamente, non scelto a caso. Alcuni scelgono di iniziare da: il primo giorno dell’anno, il primo giorno del mese, l’inizio di un trimestre o di una settimana. Ma ciò presuppone che l’attività del mercato s
Balance Levels is an easy-to-use trading indicator that provides clear buy and sell signals along with dynamic price levels, helping traders plan their entries and exits with more confidence. The tool is highly flexible – it can be used as a standalone strategy or integrated into any existing trading system. It works on all timeframes and across all markets: Forex, Gold, Indices, Crypto, or Stocks. Balance Levels suits every trading style – from scalping and intraday, to swing trading and even l
L’indicatore Volume Equilibrium mostra i livelli in cui il volume rialzista è uguale al volume ribassista. Può calcolare questi livelli per ogni giorno, settimana, mese e anno. Quando il prezzo si trova sopra la linea, significa che il volume è dalla parte dei compratori e il mercato è rialzista. Quando il prezzo si trova sotto la linea, significa che il volume è dalla parte dei venditori e il mercato è ribassista. L’indicatore utilizza l’algoritmo dell’indicatore “Meravith” per calcolare i live
Filtro:
Max2233
509
Max2233 2025.07.08 10:33 
 

I would like to compliment this work of art composed by IVAN, a very precise indicator and in combination with his other jewels created by him, trading has simply become simpler and more intuitive. A round of applause to IVAN.

Mase
1729
Mase 2025.05.29 14:17 
 

Simply perfect! In combination with Ivan's other technical indicators, it is a powerful tool. Warning: highly addictive, as the indicators bring so much joy and success. Highly recommended.

Rispondi alla recensione