IVISTscalp5
- Indicatori
- Versione: 10.4
- Aggiornato: 5 luglio 2026
- Attivazioni: 5

Итальянский
🇮🇹 [iVISTscalp5]: Un laboratorio per lo studio del comportamento del mercato attraverso il tempo
TLV Framework | Liquidity Activation Points
⸻
Descrizione Generale
iVISTscalp5 è un indicatore multilivello di timing e struttura dei prezzi sviluppato all’interno del progetto VISTmany.
Il sistema prevede il tempo, la direzione e l’ampiezza del movimento attraverso i Liquidity Activation Points (timings).
L’indicatore iVISTscalp5 può essere utilizzato con i parametri predefiniti per qualsiasi strumento finanziario.
⸻
Valore Pratico
L’indicatore iVISTscalp5 non è stato creato come un normale indicatore tecnico.
L’idea principale dello sviluppo era diversa:
dare a chiunque la possibilità di studiare il comportamento del mercato attraverso il tempo.
⸻
Time Language VISTmany (TLV) — Concetti Principali del Progetto
t(p)
t(p) sono i livelli di prezzo nei quali i timings vengono attivati.
⸻
p(p)
p(p) sono i principali livelli di prezzo costruiti dall’indicatore iVISTscalp5.
Le reazioni più forti si verificano spesso:
durante l’interazione tra t(p) e p(p).
⸻
Nel framework TLV (Time Language VISTmany)
il mercato viene considerato come un sistema nel quale non contano solo:
il prezzo
il volume
ma anche:
le strutture temporali del movimento.
Per questo motivo, la base principale dell’indicatore è costituita dai:
Liquidity Activation Points (timings)
— punti temporali nei quali il mercato ha una maggiore probabilità di attivare movimento.
⸻
Cos’è iVISTscalp5
iVISTscalp5 è un sistema non lineare di previsione per strumenti finanziari.
L’indicatore consente di:
prevedere il tempo di attivazione del movimento
analizzare la direzione probabile
valutare l’ampiezza media del movimento
studiare l’interazione tra prezzo e tempo
analizzare i Momentum Clusters
studiare le timing intersections
⸻
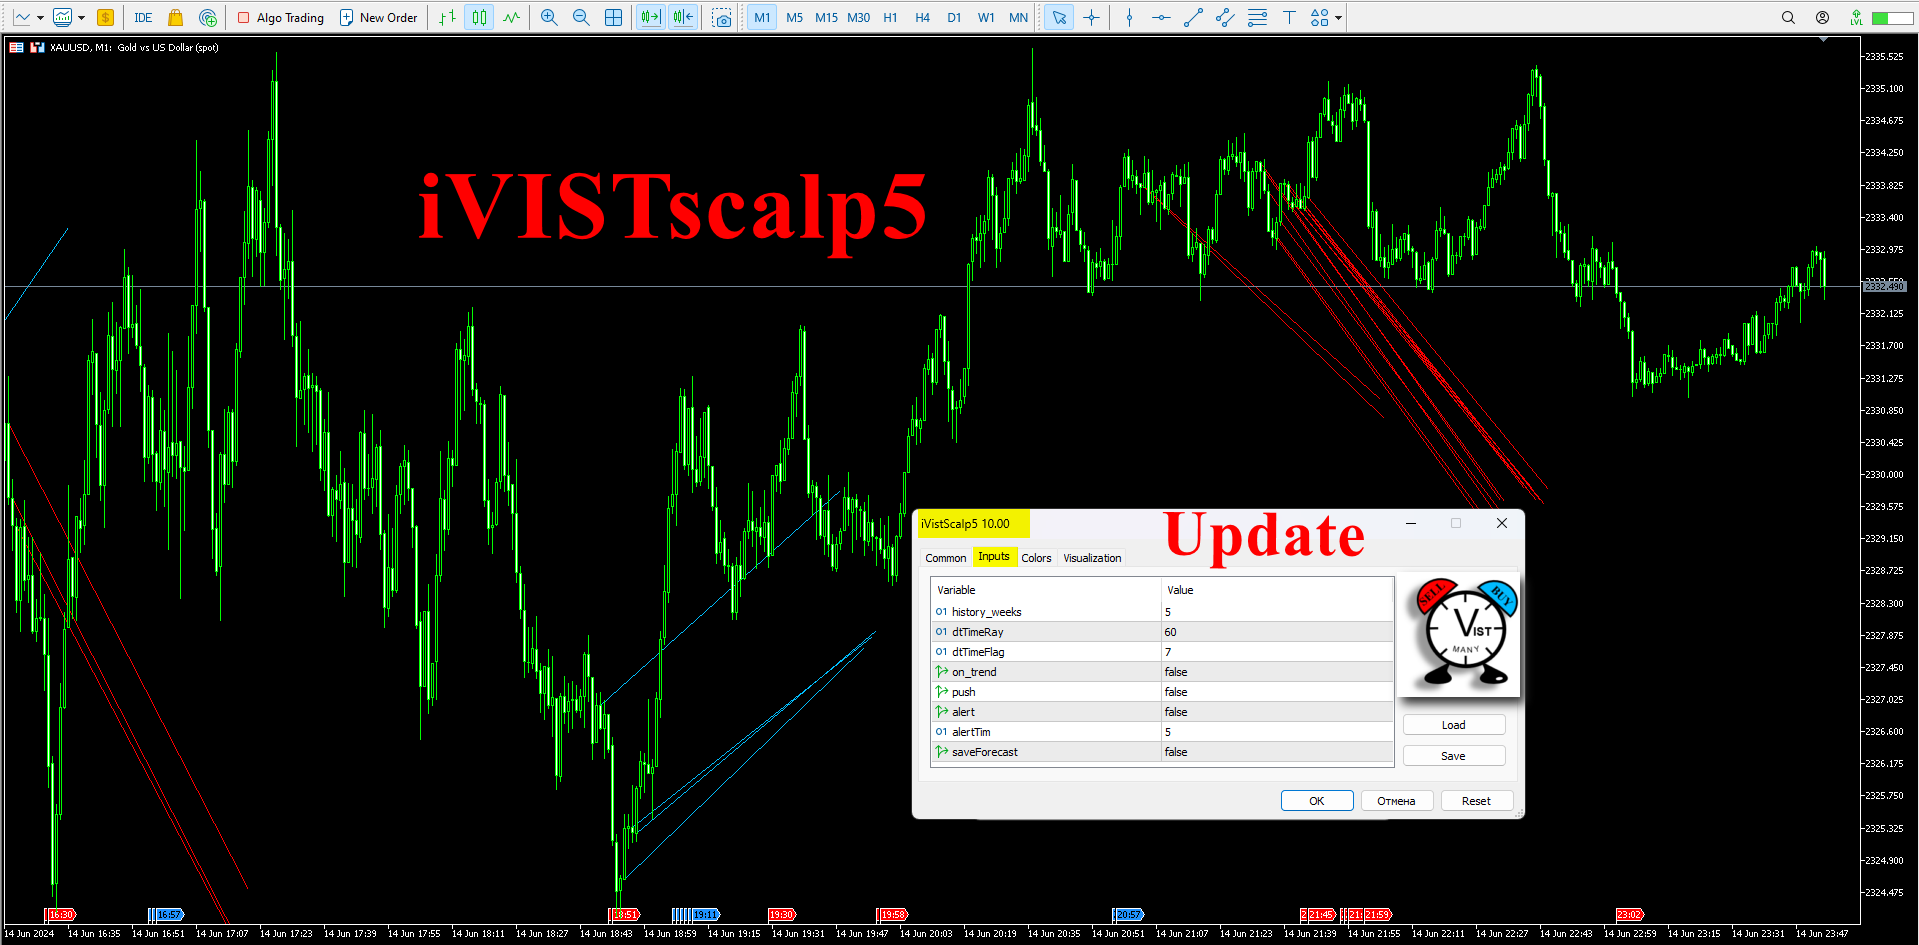
Installazione dell’Indicatore in MT5
MQL5 → Indicators → iVISTscalp5
Impostare la cronologia delle barre nel terminale MT5 ad almeno 10000:
Tools → Options → Max bars in chart = 10000
Successivamente riavviare MT5 e aggiungere iVISTscalp5 al grafico.
⸻
Uno degli Obiettivi Principali dell’Indicatore
è la ricerca del comportamento del mercato.
Per questo motivo si raccomanda di testare continuamente l’indicatore:
all’interno del MT5 Strategy Tester
per studiare il comportamento del mercato finanziario e la sua relazione con il tempo.
⸻
Perché è Importante?
Solo attraverso:
osservazione continua
test
analisi ripetuta
confronto delle timing structures
i trader possono iniziare a comprendere:
come il mercato reagisce al tempo
come il prezzo interagisce con i timings
come si formano le liquidity reactions
⸻
iVISTscalp5 Risponde a Tre Domande Fondamentali
Quando il mercato è pronto a muoversi
Dove è probabile una reazione
Quale tipo di movimento può essere atteso
⸻
L’Indicatore Combina
Timings
Livelli di prezzo
Deviazioni statistiche
⸻
Idea Principale
Il mercato non si muove casualmente.
Reagisce durante i:
Liquidity Activation Points (timings).
⸻
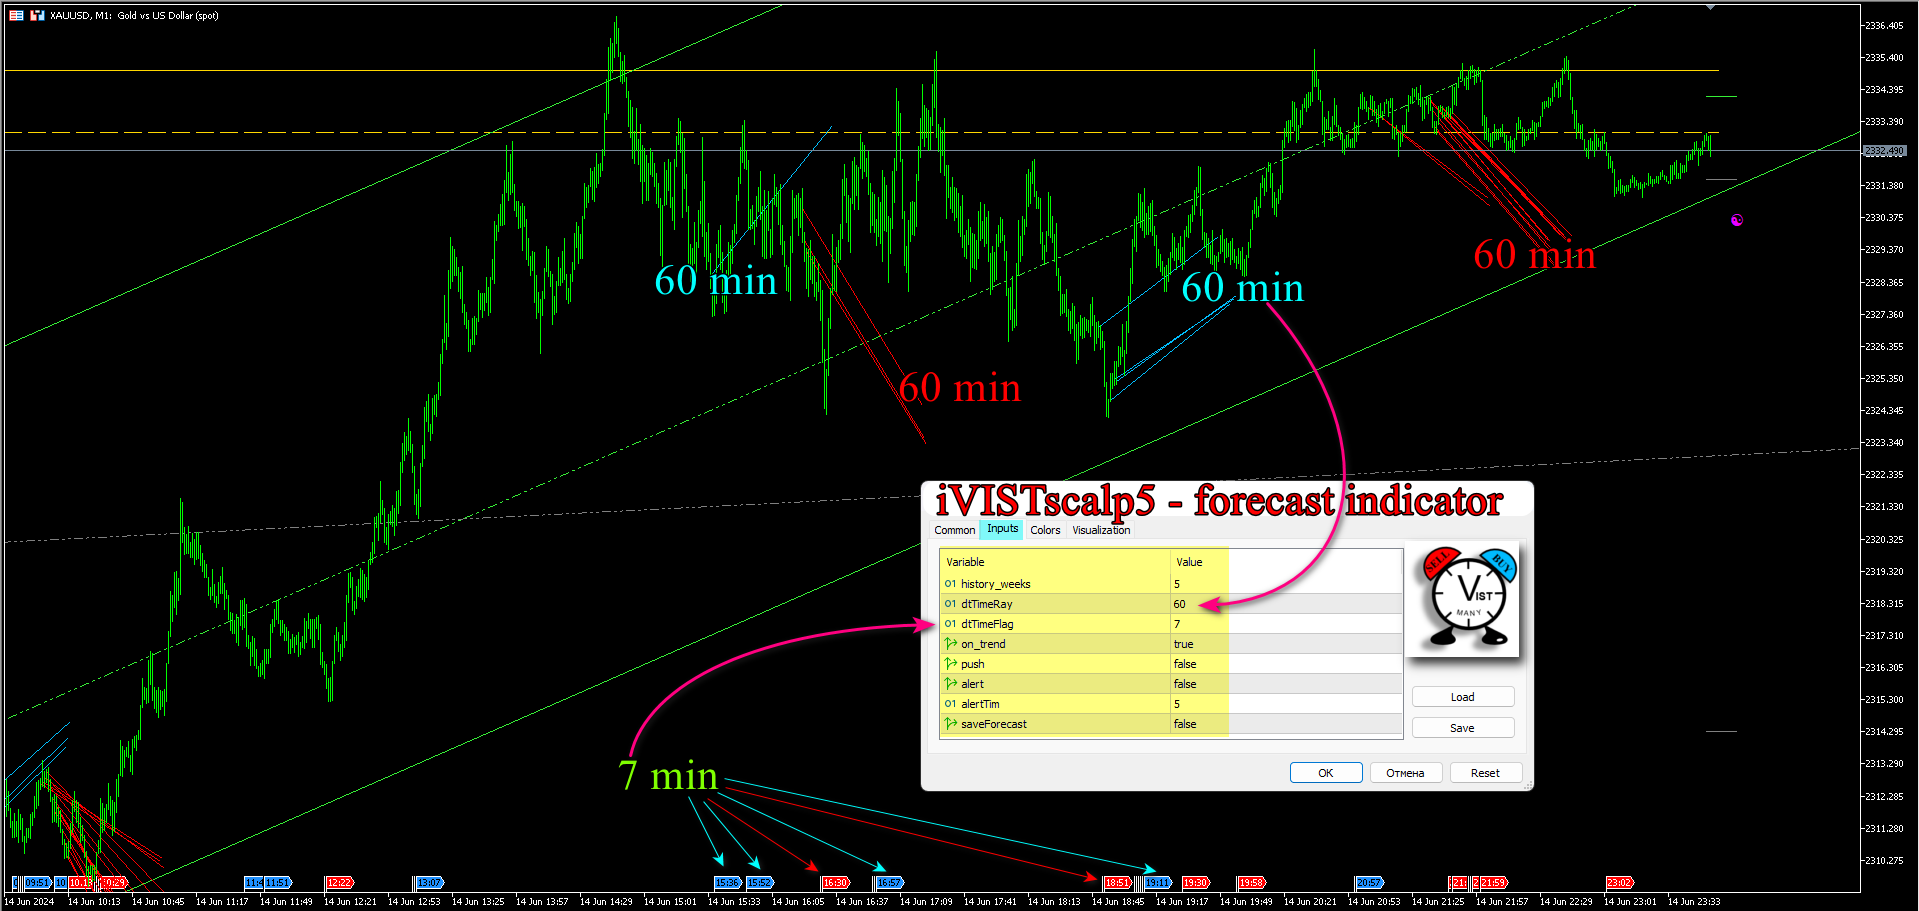
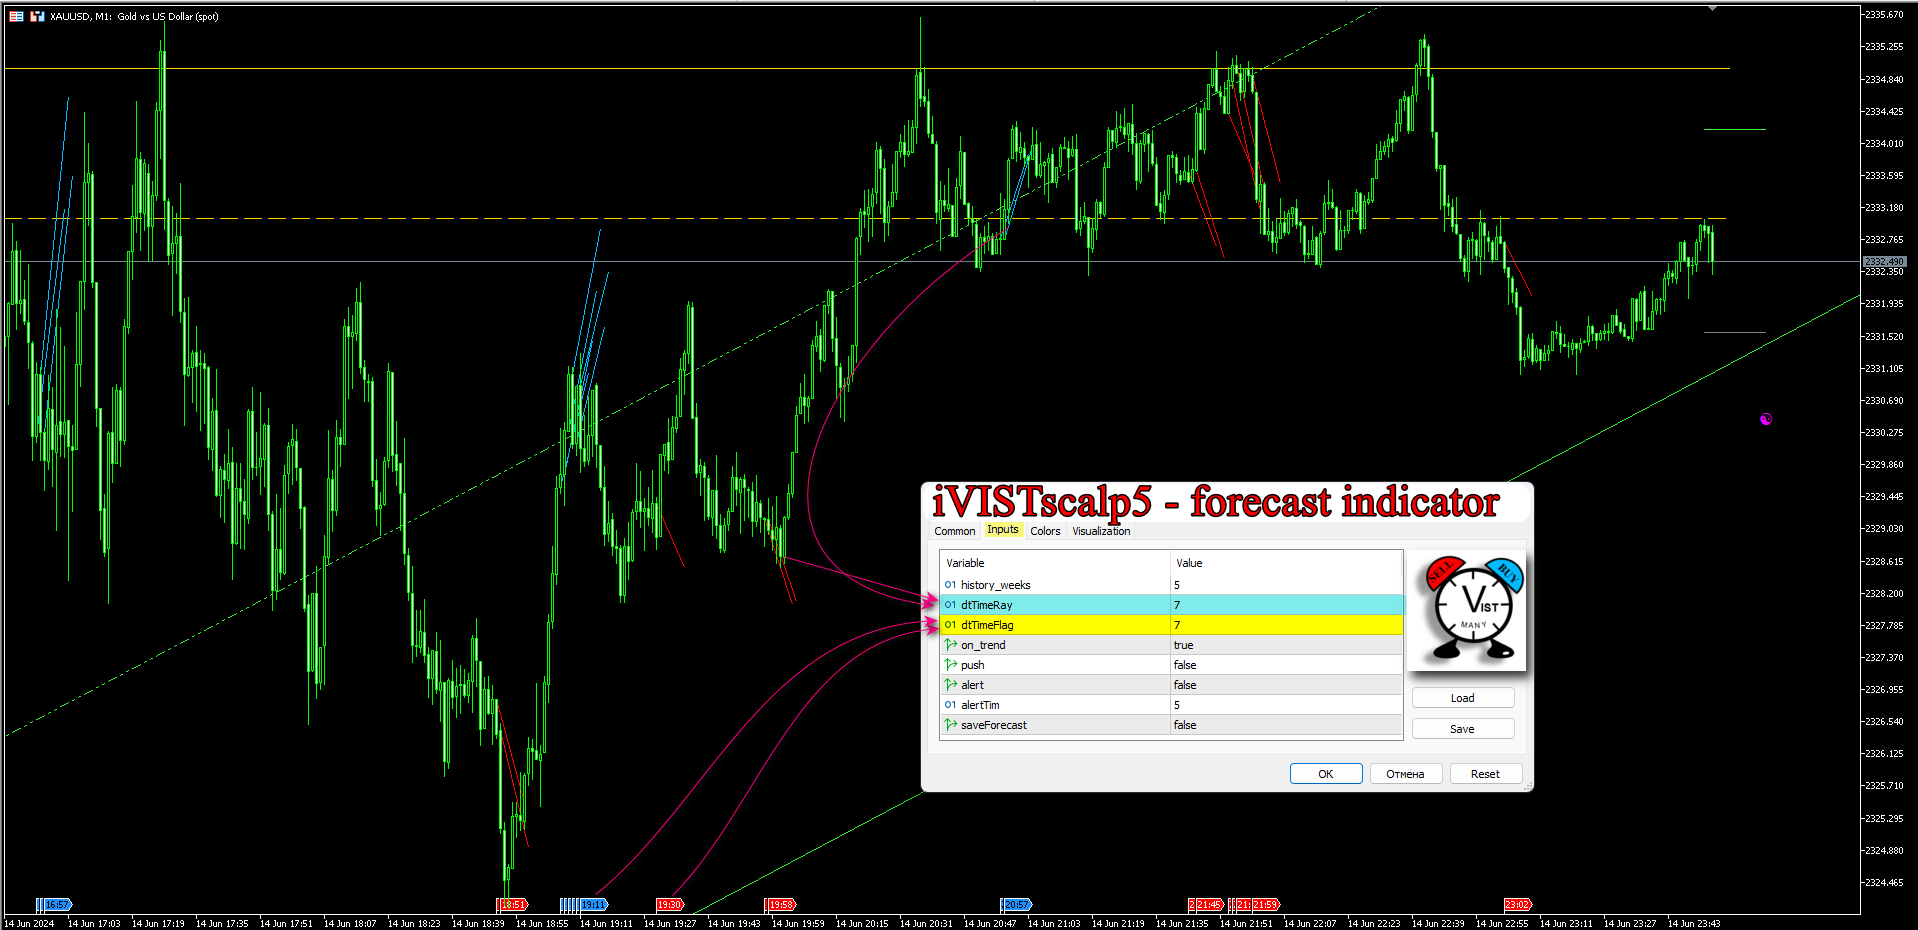
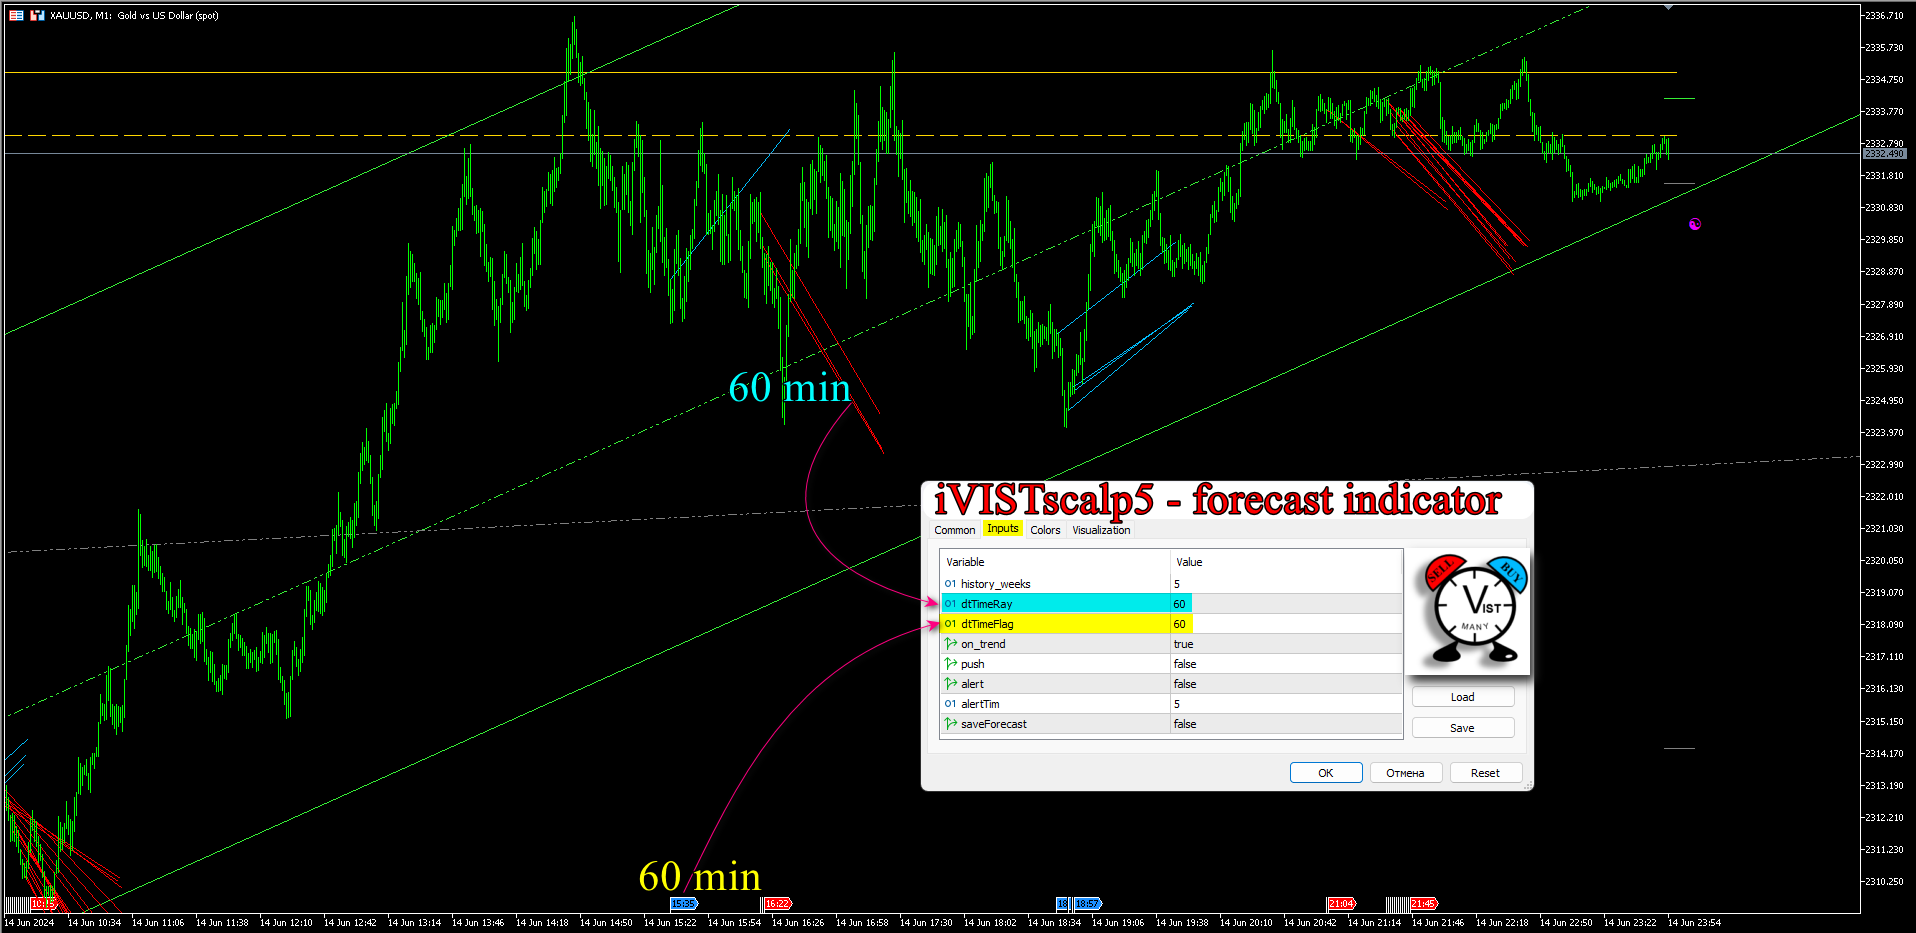
Sistema di Timings
I timings possono essere configurati in modo flessibile:
da 7 minuti in su.
Intervalli consigliati:
7 minuti
33 minuti
48 minuti
54 minuti
60 minuti
I timings superiori definiscono l’impulso principale della giornata.
I timings inferiori perfezionano il punto di ingresso.
Tuttavia, il trader può scegliere qualsiasi intervallo temporale.
⸻
Sistema Settimanale per l’Analisi e il Calcolo dei Timings (history_weeks)
da 5 settimane in su.
Per la 2ª e 3ª settimana di trading si raccomanda:
history_weeks = 5
Per la prima e le ultime settimane di trading si raccomanda:
history_weeks = 8
⸻
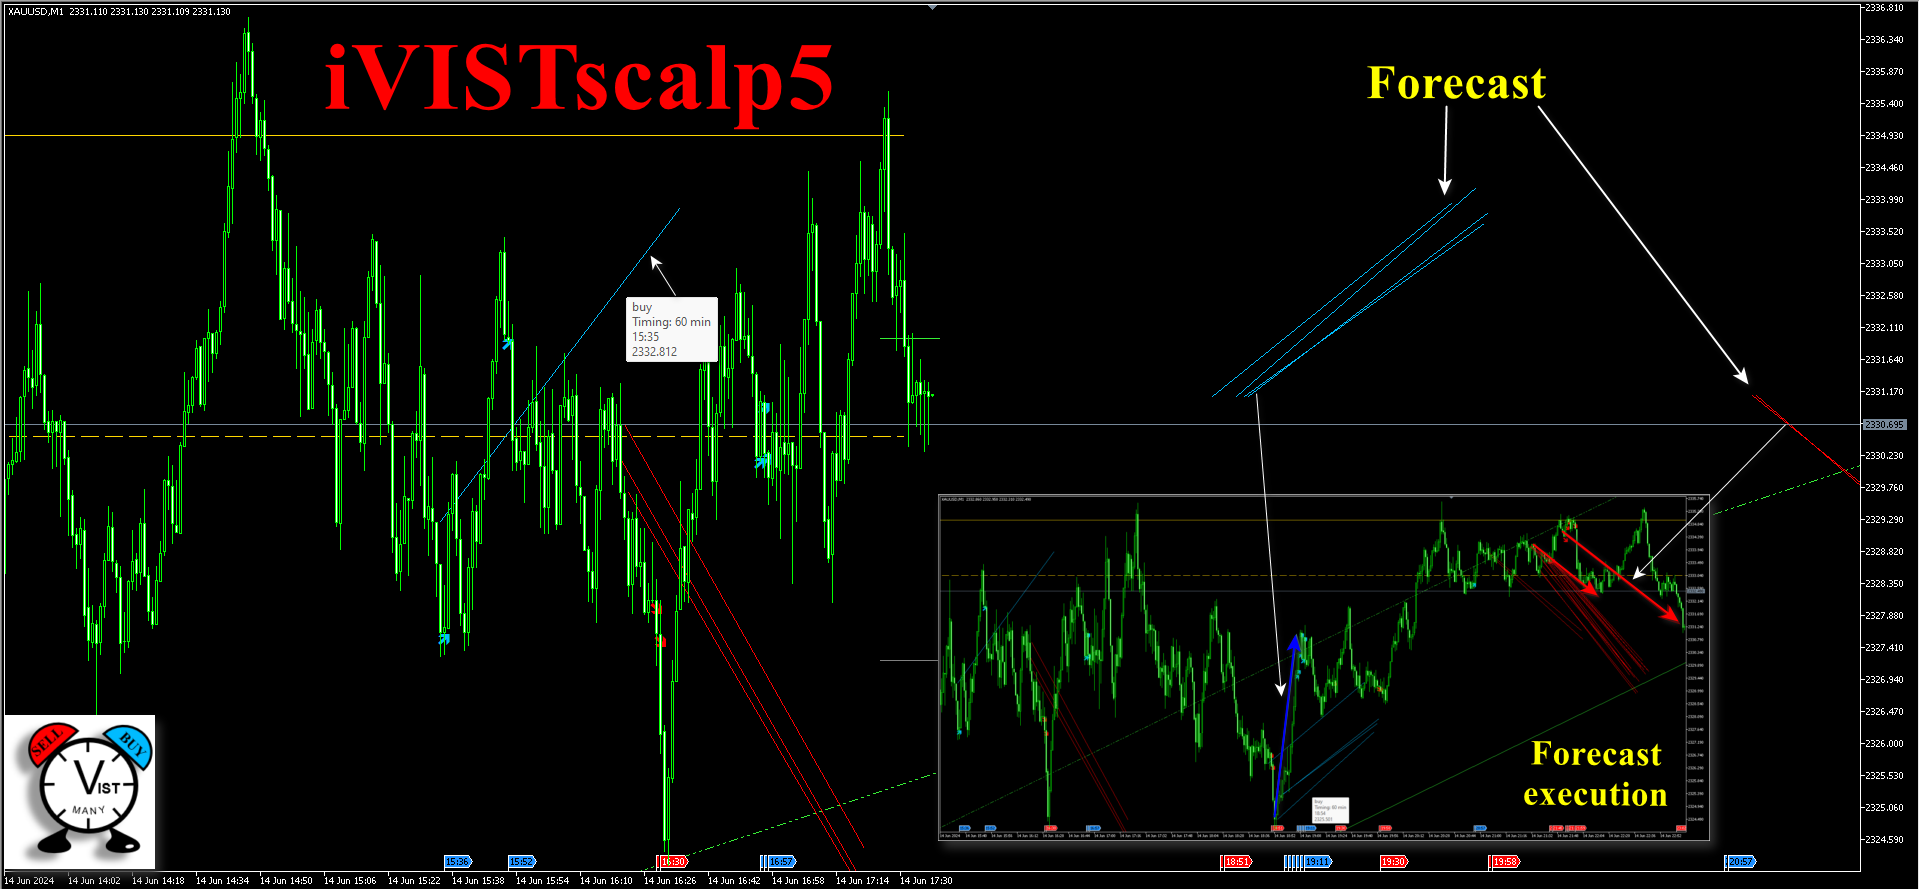
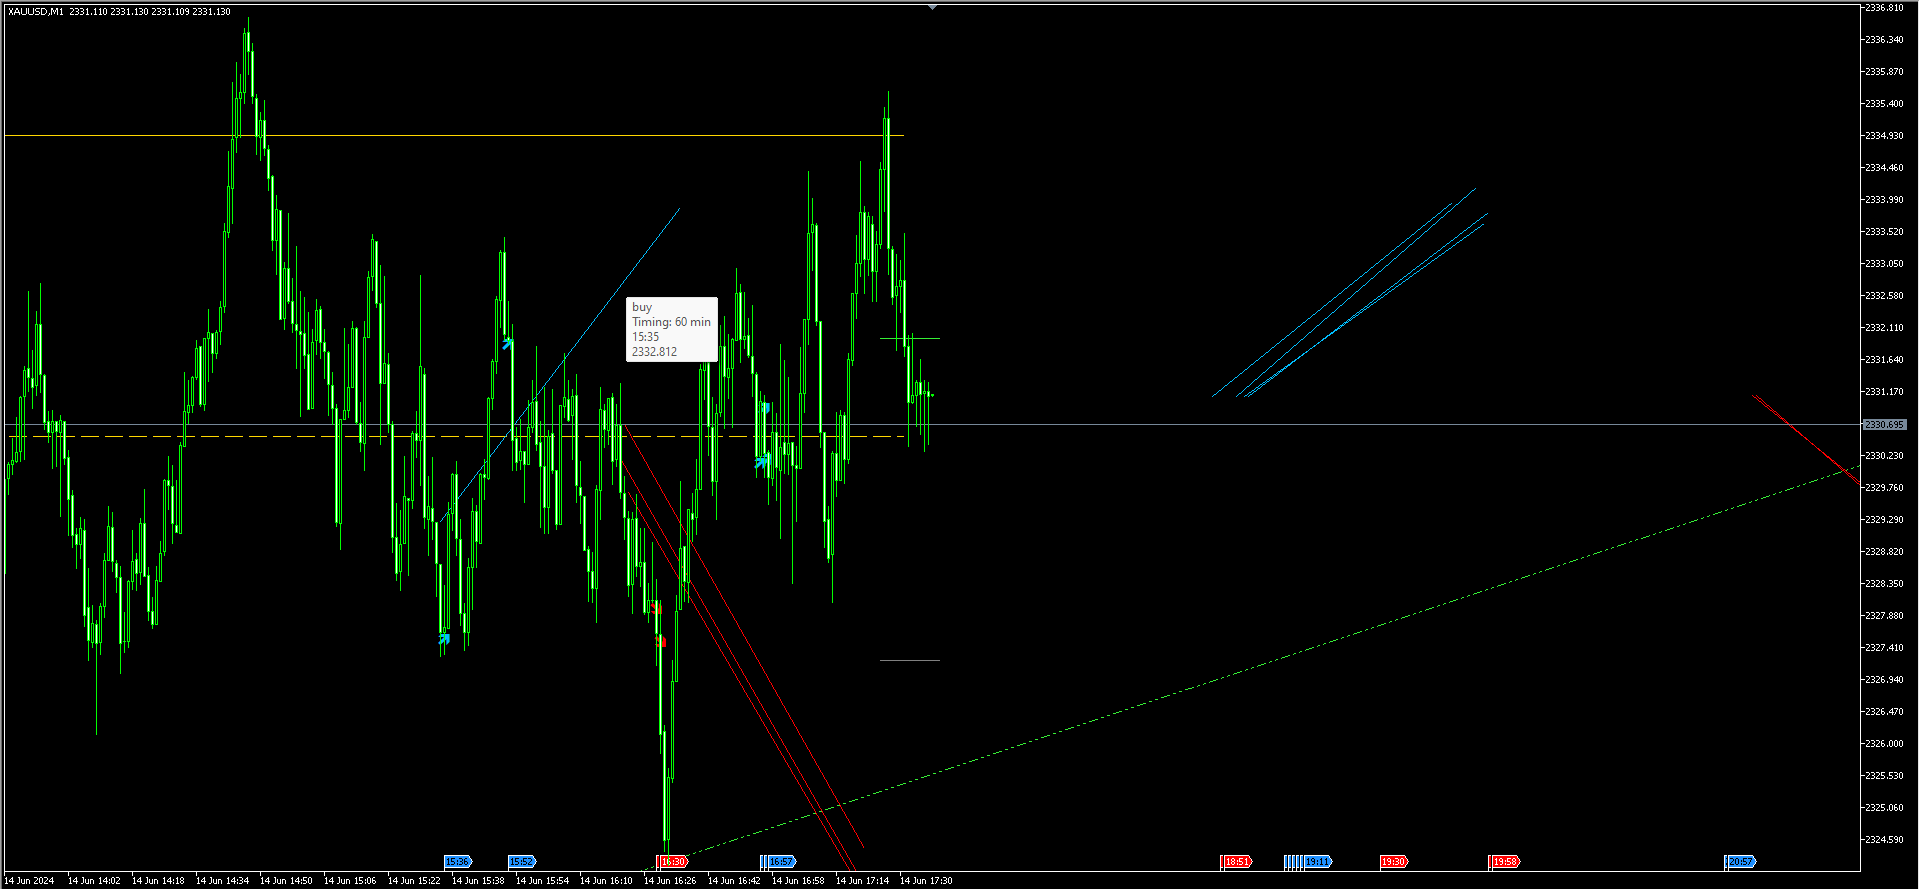
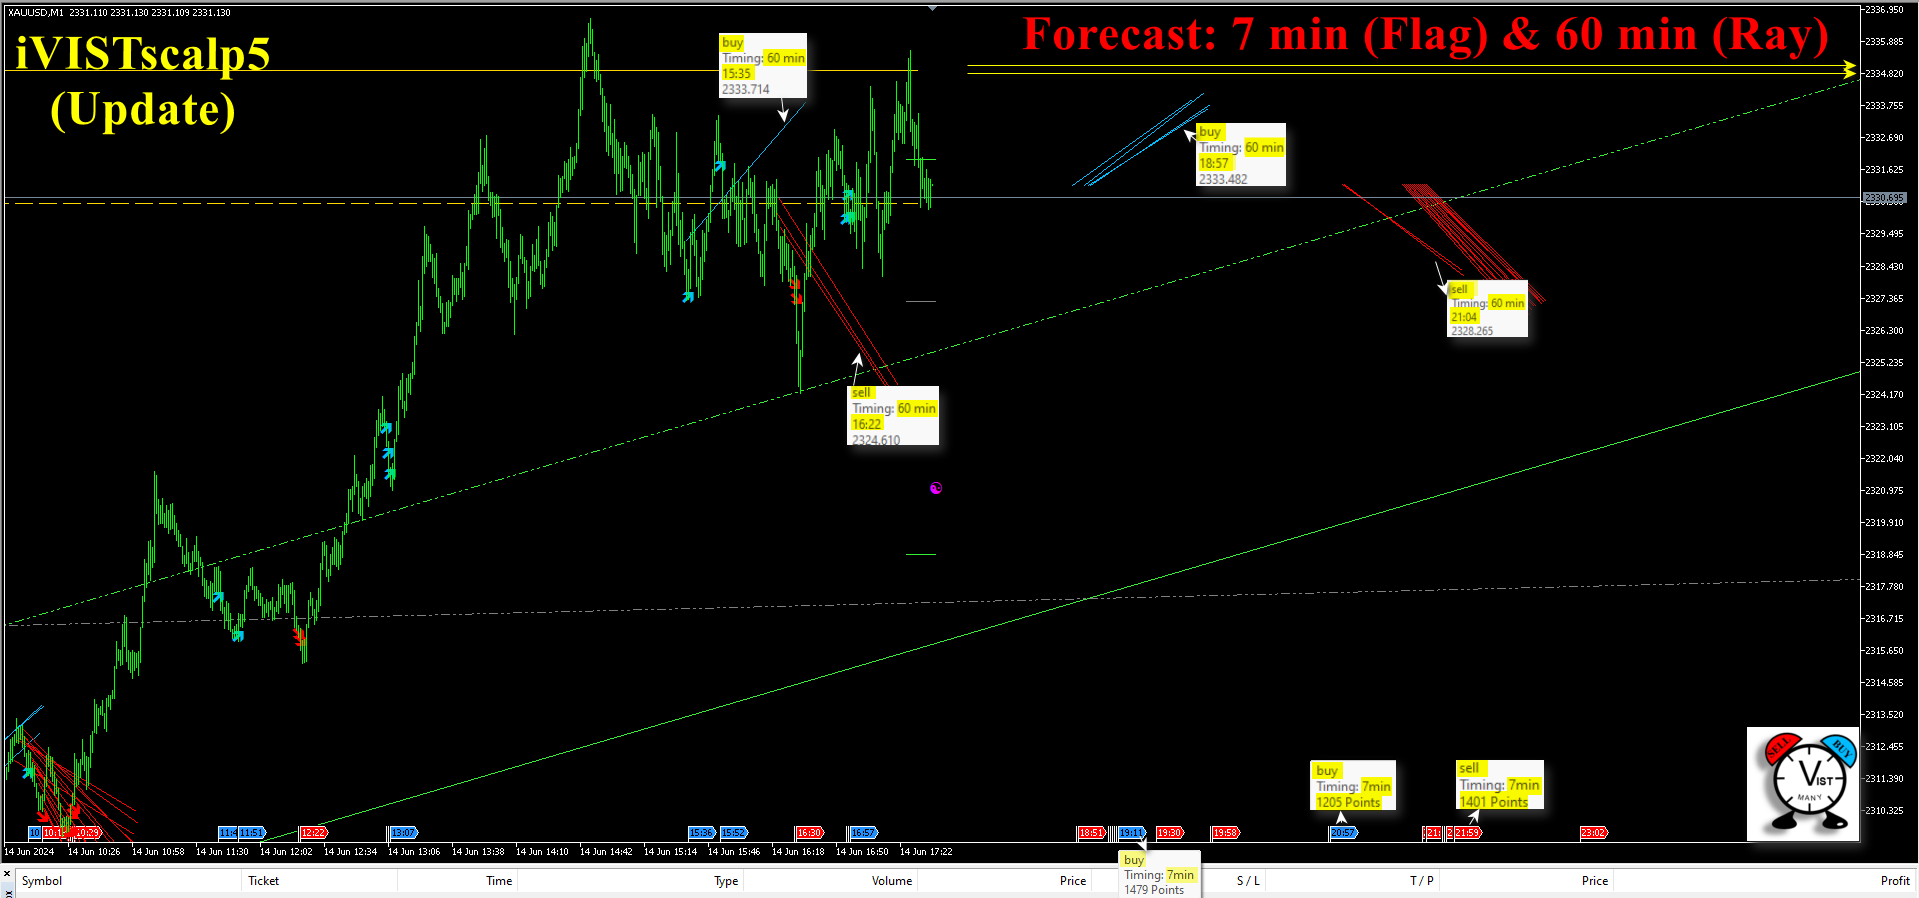
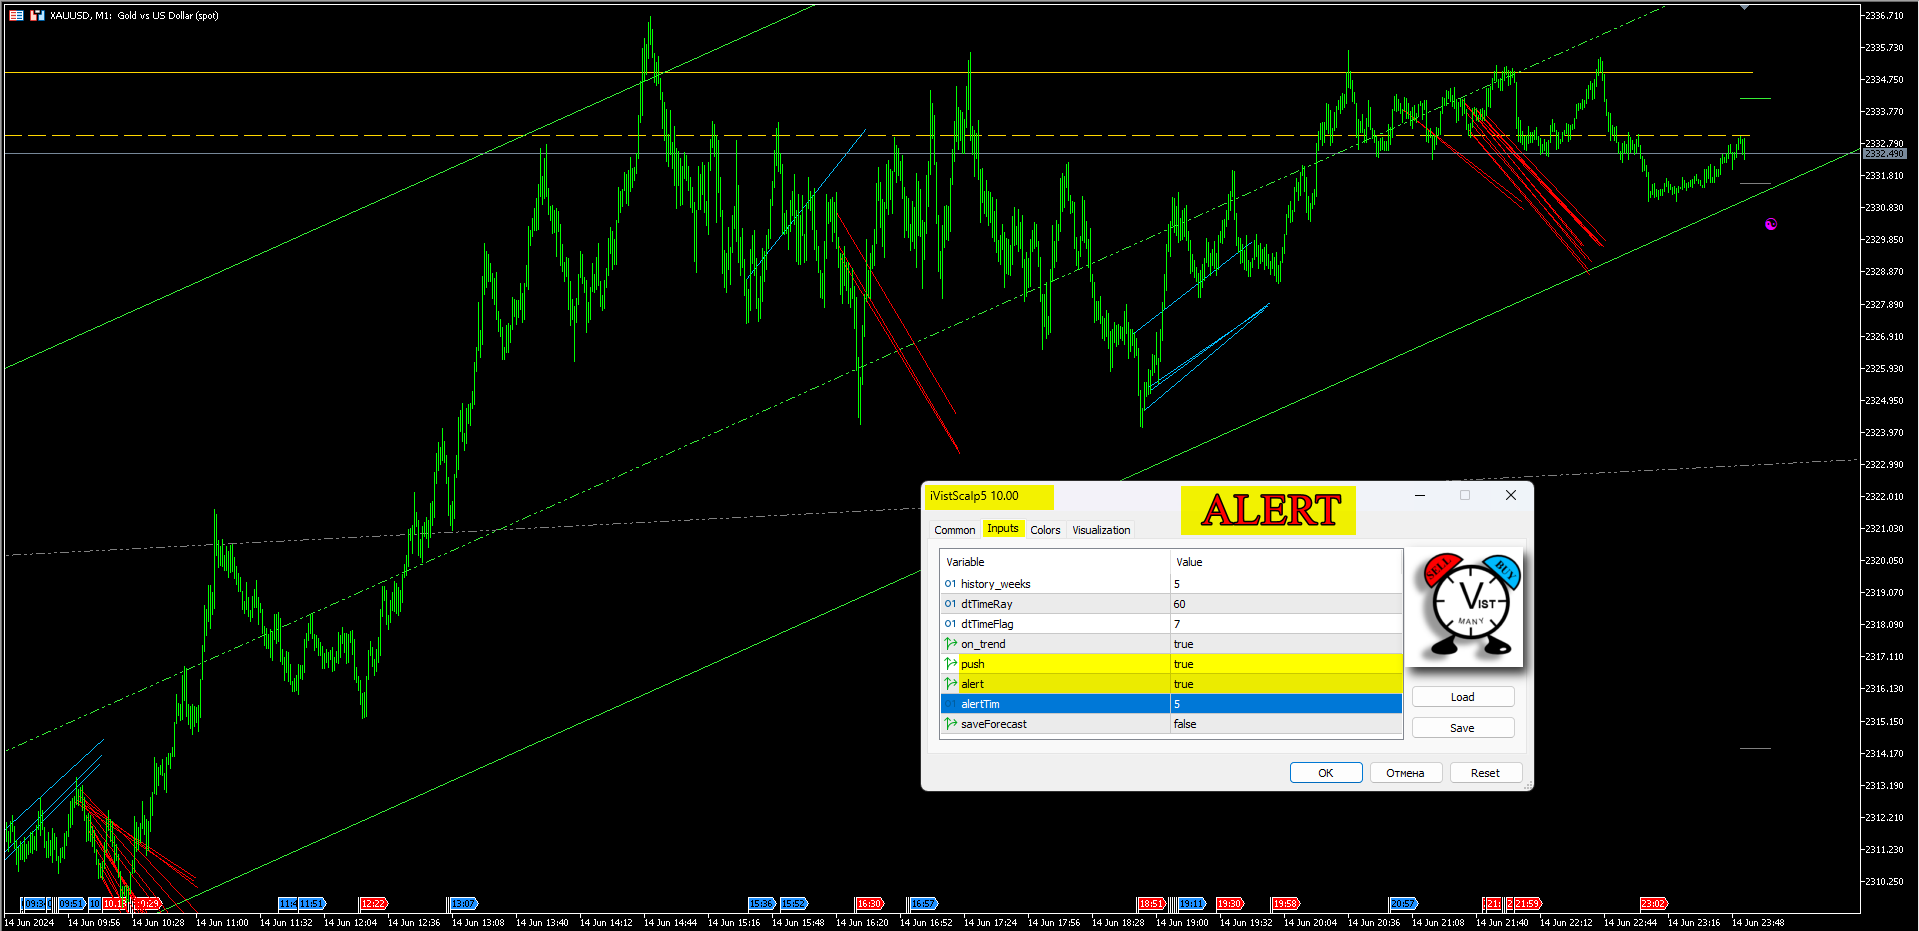
Visualizzazione: Flags e Rays
Flags
Un Flag rappresenta il momento previsto di attivazione dell’impulso.
Colori
🔵 Blu → Buy
🔴 Rosso → Sell
Informazioni (passando il mouse)
Operazione (buy/sell)
Intervallo del timing
Valore medio del movimento (points)
⸻
Rays
I Rays “fluttuano” fino al momento dell’attivazione e successivamente vengono attratti visivamente verso il prezzo.
Colori
🔵 Blu → Buy
🔴 Rosso → Sell
→ rappresenta il potenziale medio del movimento.
Informazioni (passando il mouse)
Operazione (buy/sell)
Intervallo del timing (minuti)
Orario del timing
⸻
Flessibilità
Flags e Rays possono essere invertiti.
⸻
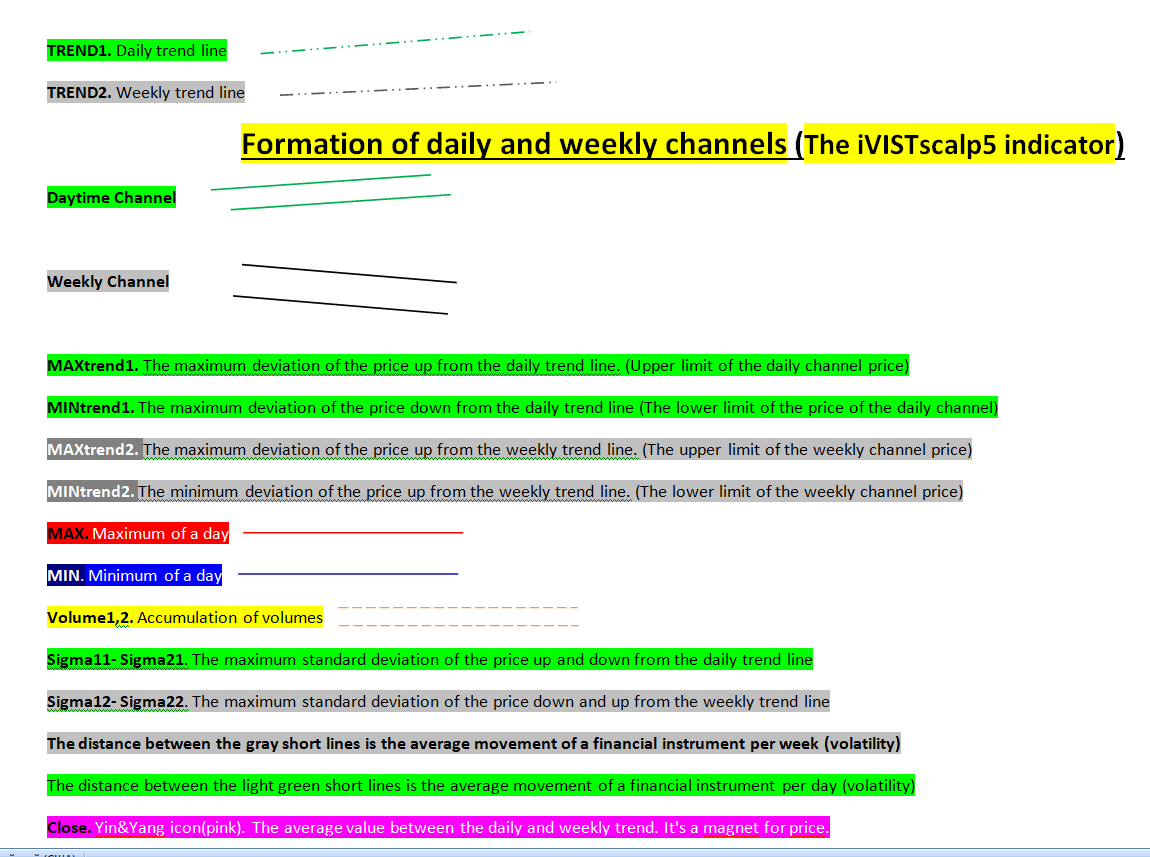
Canali di Prezzo
I canali giornalieri, settimanali e mensili definiscono:
trend
confini
zone di reazione
⸻
Livelli di Volume
I livelli di volume mostrano zone di accumulo delle contrattazioni.
Funzionano come:
supporto/resistenza
zone di liquidità
⸻
Deviazione Standard
Calcolata da:
trend giornaliero
struttura settimanale
struttura mensile
Mostra:
estremi
surriscaldamento del mercato
⸻
Balance Point (Cerchio Rosa)
È:
il centro di tutti i livelli di prezzo generati dall’indicatore.
Rappresenta:
equilibrio
punto di attrazione del prezzo
⸻
Regole Operative
Un timing non è un segnale,
ma un:
momento di attenzione.
È sempre necessario considerare il contesto.
Osservare la reazione del prezzo.
⸻
Condizioni
Estremi
Possono verificarsi:
inversioni
ritardi
⸻
News
Gli eventi economici possono spostare le reazioni.
⸻
Mercato Laterale
Sono possibili:
movimenti deboli
fasi di accumulazione
⸻
Filtraggio Direzionale
Dopo un forte ribasso:
→ ignorare i Sell timings.
Dopo un forte rialzo:
→ ignorare i Buy timings.
⸻
Retest
Il prezzo ritorna spesso al punto iniziale del timing.
Questo può essere utilizzato per le entrate.
⸻
Note Aggiuntive
i clusters aumentano la probabilità
i timings superiori sono più importanti
non tutti i timings devono essere tradati
⸻
Conclusione
iVISTscalp5 non è semplicemente un indicatore.
È un sistema per comprendere il mercato attraverso il tempo.
⸻
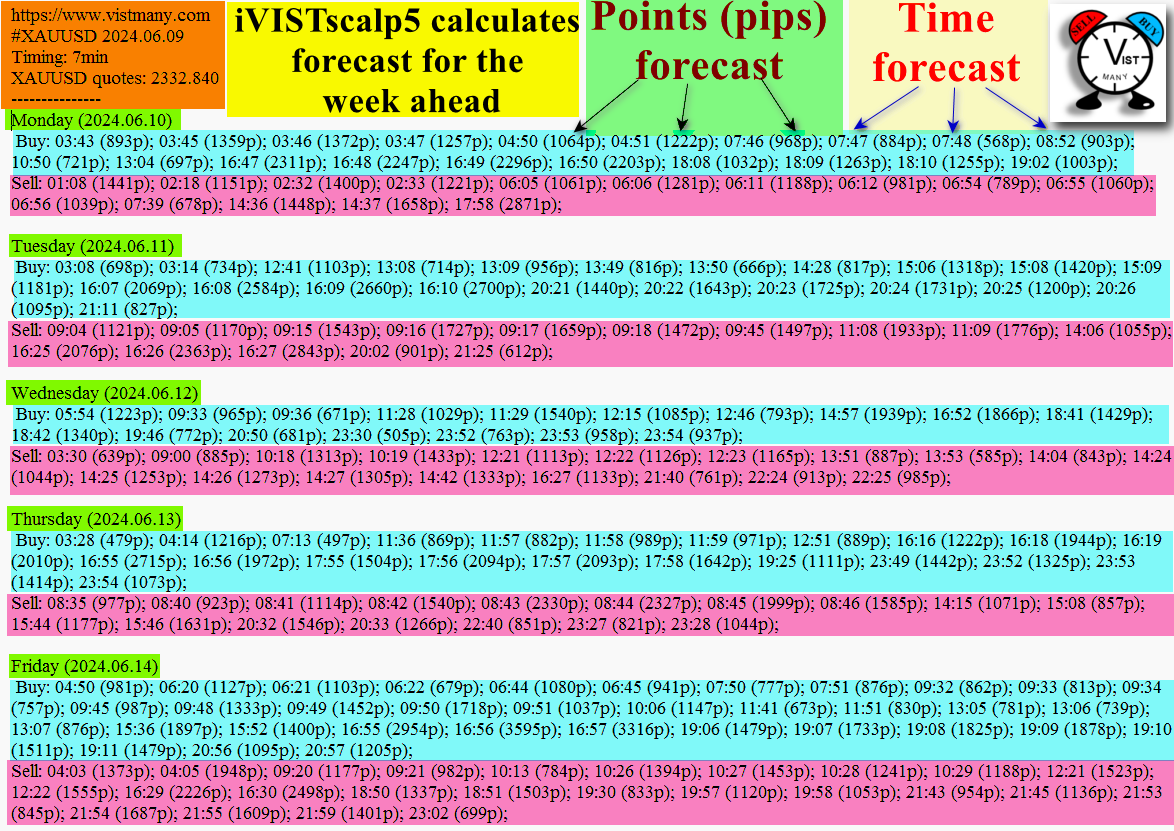
Web Version del Progetto
Oltre alla versione MT5, il progetto include anche:
una Web-version sul sito ufficiale del progetto. (https://vistmany.com/vistlab)
Questo permette di:
analizzare i timings senza terminale
studiare timing structures online
ricevere weekly forecasts
confrontare diversi strumenti finanziari


One of a kind indicator that can actually forecast future movement and the estimated number of points. I haven't found or seen anything like this. Developer is also constantly improving the system to help users. But the most amazing part is the support. Iryna will guide you all the way to be successful in using this amazing tool. Highly recommend. 5 stars all the way