Volume Equilibrium

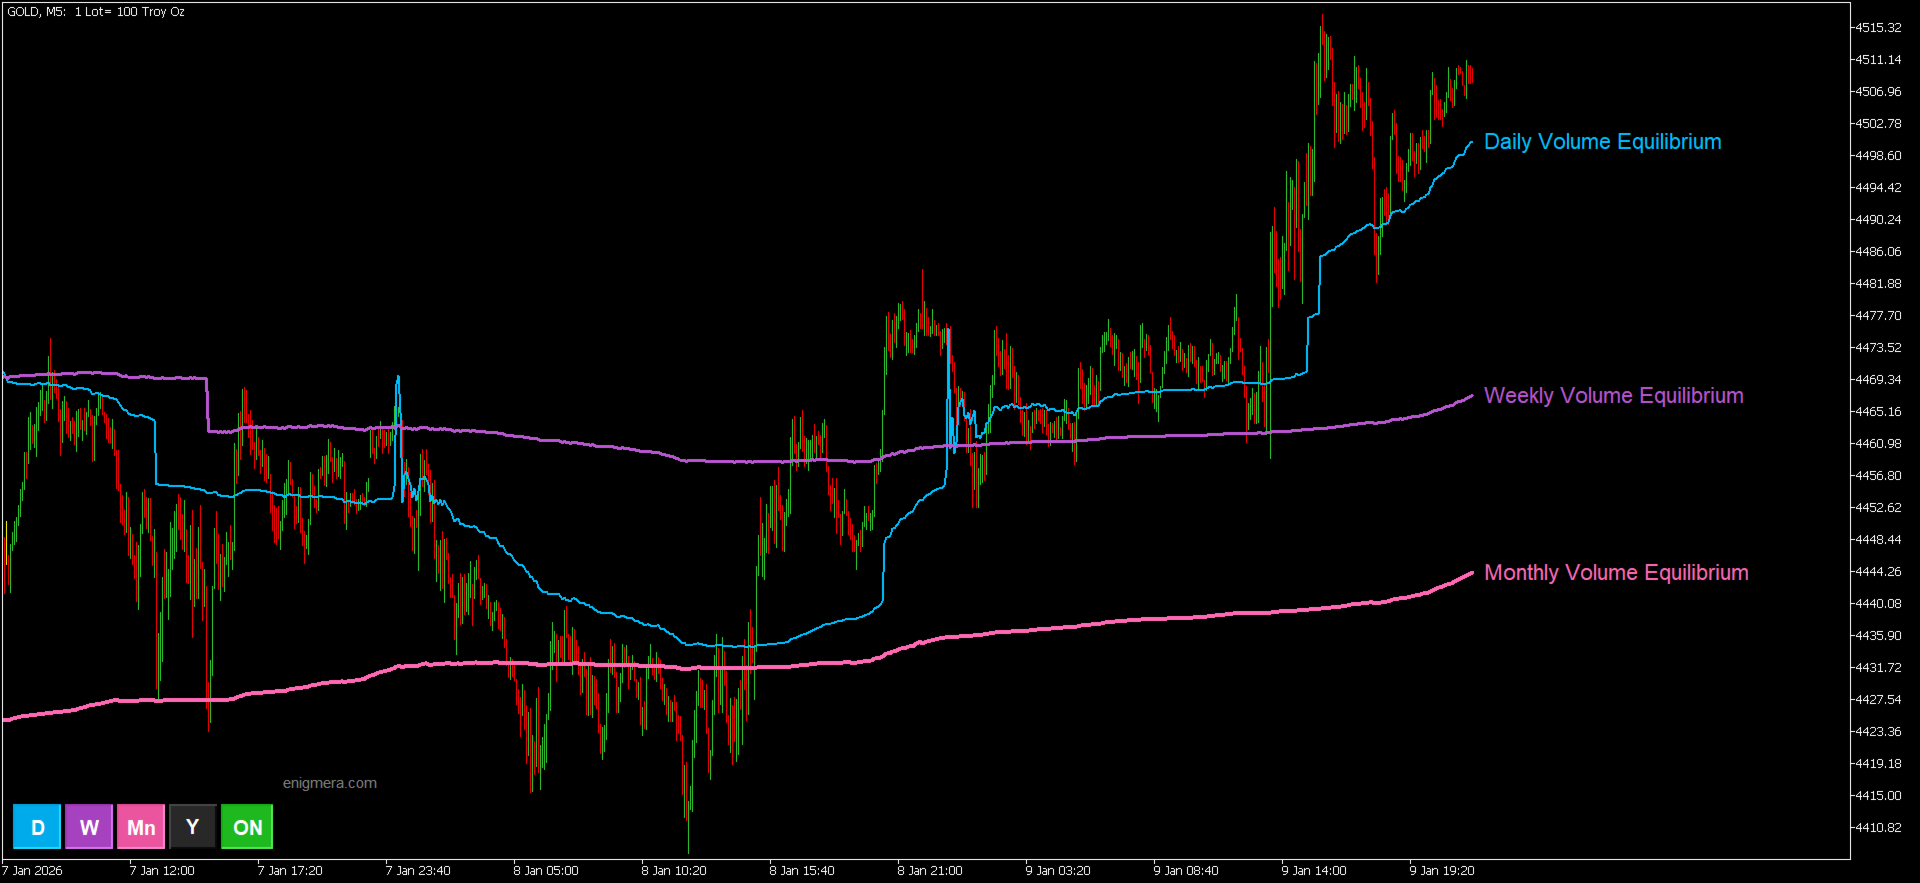
Volume Equilibrium 지표는 매수 거래량과 매도 거래량이 동일해지는 수준을 보여줍니다. 이 지표는 일간, 주간, 월간, 연간 기준으로 해당 레벨을 계산할 수 있습니다.

가격이 라인 위에 있을 때는 매수 거래량이 우세하며 시장이 상승 추세에 있음을 의미합니다. 가격이 라인 아래에 있을 때는 매도 거래량이 우세하며 시장이 하락 추세에 있음을 의미합니다.

이 지표는 ‘Meravith’ 지표 알고리즘을 사용하여 레벨을 계산합니다. 거래량 레벨은 매우 정밀하게 계산됩니다. 지표는 자동으로 작동하며 모든 시간 프레임에서 사용할 수 있습니다.

각 라인마다 버튼이 있어, 원하시는 거래량 균형 레벨만 선택하여 표시하실 수 있습니다. 또한 지표 전체를 표시하거나 숨길 수 있는 버튼도 있습니다.

보다 정확한 결과를 위해서는 많은 고객을 보유한 대형 브로커를 사용하시는 것이 좋습니다. 브로커는 자사 고객의 거래량만 표시하기 때문입니다.


추천 제품
RAD Real Acummulation and Distribution
Jose Alejandro Jacome Jimenez
RAD CRITICAL LEVES RAD indicator tracks “Relevant Volume” in real time, identifying accumulation and distribution processes, projecting them in the chart as SUPPORT or RESISTANCE zones. Natural   support   and resistance levels are generated by Volume Accumulation and Distribution processes. As these processes evolve, levels at which the relevant volume in the market place is positioned, become difficult areas to cross upwards or downwards. By using this information, traders can identify very s
This product is designed for the MT5 platform and offers two key features: VWAP (Volume Weighted Average Price) calculation and Volume Profile analysis. Advantages: VWAP Calculation: The product calculates the VWAP, which is a popular indicator used by traders to determine the average price of a security based on its trading volume. It helps identify potential buying or selling opportunities by comparing the current price to the average price weighted by volume. Volume Profile Analysis: The prod
이 표시기는 이산 Hartley 변환을 기반으로 합니다. 이 변환을 사용하면 재무 시계열을 처리할 때 다양한 접근 방식을 적용할 수 있습니다. 이 지표의 특징은 판독값이 차트의 한 지점이 아니라 지표 기간의 모든 지점을 참조한다는 것입니다. 시계열을 처리할 때 표시기를 사용하여 시계열의 다양한 요소를 선택할 수 있습니다. 필터링의 첫 번째 가능성은 이 접근 방식을 기반으로 합니다. 불필요한 모든 고주파수 구성 요소는 단순히 폐기됩니다. 첫 번째 그림은 이 방법의 가능성을 보여줍니다. CutOff 매개변수를 선택하면 원래 시계열의 세부 정보를 선택할 수 있습니다(빨간색 선 - 주요 정보만 남음 CutOff = 0, 노란색 - 주요 및 가장 낮은 주파수 기간 CutOff = 1 , 파란색 - 가장 높은 주파수의 모든 노이즈가 삭제됩니다. CutOff = 4 ). 그러나 이것이 유일한 가능성은 아닙니다. 추가 필터링으로 노이즈 성분을 억제할 수 있습니다. 두 옵션 모두 이 표시기에 구현
Manyal trading system, CovEchoTrend Robot, focuses on reliability and flexibility. By employing statistical analysis methods to study the relationships between the base indicator and market patterns, the system enables a deeper understanding of market processes. Intelligent pattern analysis: The application of statistical data processing helps identify key trend reversal points more accurately, signaling significant market shifts. Informed decision-making is based on the intersection of indicato
Breakout Boxes with Volume Pressure This indicator automates the identification of key consolidation zones (Supply and Demand) based on Market Pivots and Volatility (ATR). Unlike standard support/resistance tools, this indicator provides a unique   Volume Pressure Analysis   inside every box, giving you insight into the battle between Buyers and Sellers before a breakout occurs. Key Features Automated Supply & Demand Zones:   Automatically detects significant Pivot Highs and Lows to draw dyna
Limitless MT5
Dmitriy Kashevich
Limitless MT5 is a universal indicator suitable for every beginner and experienced trader. works on all currency pairs, cryptocurrencies, raw stocks Limitless MT5 - already configured and does not require additional configuration And now the main thing Why Limitless MT5? 1 complete lack of redrawing 2 two years of testing by the best specialists in trading 3 the accuracy of correct signals exceeds 80% 4 performed well in trading during news releases Trading rules 1 buy signal - the ap
Blahtech Market Profile MT5
Blahtech Limited
5 (10)
Was: $249  Now: $99   Market Profile defines a number of day types that can help the trader to determine market behaviour. A key feature is the Value Area, representing the range of price action where 70% of trading took place. Understanding the Value Area can give traders valuable insight into market direction and establish the higher odds trade. It is an excellent addition to any system you may be using. Inspired by Jim Dalton’s book “Mind Over Markets”, this indicator is designed to suit the
Cycles Forecast
Pooriya Alirezaee
This indicator is based on a mathematical formula and an ANN combined, designed to make a model(using previous prices) of the most recent market condition (any chart*) in order to use the model as a forecasting tool. *This indicator can operate on any chart/timeframe, but it's suggested you use multiple timeframes for each trade because this method relies solely on the time factor, you can not use this indicator to predict price volatility, but if it's fit correctly it will show you when the nex
Volume Profile Trading System is NOT just another volume indicator. It's a   complete trading ecosystem   that combines professional volume profile visualization with an intelligent automated trading strategy.  While other indicators show you   WHERE   volume is concentrated, Volume Profile Trading System  shows you   WHERE ,   WHEN , and   HOW   to trade it! displaying real volume distribution by price instead of time. It helps traders identify fair value zones, institutional activity, and high
VolumeDeltaWaves
Stanislav Korotky
This indicator is an extended implementation of Weis waves. It builds Weis waves on absolute volumes (which is the classical approach) or delta of volumes (unique feature) using different methods of wave formation and visualization. It works with real volumes, if available, or with tick volumes otherwise, but also provides an option to use so called "true volume surrogates", as an artificial substitution for missing real volumes (for example, for Forex symbols), which was introduced in correspo
Pan PrizMA CD Phase
Aleksey Panfilov
The Expert Advisor and the video are attached in the Discussion tab . The robot applies only one order and strictly follows the signals to evaluate the indicator efficiency. Pan PrizMA CD Phase is an option based on the Pan PrizMA indicator. Details (in Russian). Averaging by a quadric-quartic polynomial increases the smoothness of lines, adds momentum and rhythm. Extrapolation by the sinusoid function near a constant allows adjusting the delay or lead of signals. The value of the phase - wave s
Adjustable Consecutive Fractals  looks for 2 or more fractals in one direction and sends out a on screen alert, sound alert and push notification, for strong reversal points . Adjustable Consecutive Fractals, shows the fractals on chart along with a color changing text for buy and sell signals when one or more fractals appear on one side of price. Adjustable Consecutive Fractals is based Bill Williams Fractals . The standard Bill Williams fractals are set at a non adjustable 5 bars, BUT withe th
Ugenesys AI MT5
Odaine Ramon Mcmillan
uGenesys AI - 90% Accurate Daytrading Indicator Introducing the ultimate forex trading indicator system, uGenesys AI, powered by cutting-edge AI technology and advanced analytical techniques, including Time-Series Analysis and Genetic Algorithms. Our AI-powered trading system leverages the power of time-series analysis to identify trends and patterns in historical price data, allowing traders to make informed predictions about future market movements. By analyzing vast amounts of data, our syst
MarketMagnet
Kelly Adediran Raymond
Are you ready to take your trading journey to new heights? Look no further than MarketMagnet, this groundbreaking indicator designed to propel your trading success with excitement and accuracy. Powered by the convergence of Momentum and CCI (Commodity Channel Index), MarketMagnet equips traders with the ultimate tool to determine direction and entry prices for a wide range of recommended currency pairs and instruments. It is designed for traders seeking to scalp for a few pips on lower timeframe
Based on the trading model/strategy/system of gold double-position hedging and arbitrage launched by Goodtrade Brokers, problems encountered in daily operations: 1. Account B immediately places an order immediately following account A. 2: After account A places an order, account B will automatically copy the stop loss and take profit. 3: Account A closes the position of Account B and closes the position at the same time. 4: When account B closes the position, account A also closes the position.
Frontier Pivots
Nestor Jose Mendez Boza
FRONTIER PIVOTS - Geometric Levels Indicator This indicator plots support and resistance levels/ranges on the chart using mathematical calculations. It helps traders identify potential price reaction zones based on geometric patterns. Main Features: Automatically calculates and displays key price levels Plots both support and resistance lines Uses daily price data for level calculation Clean visual presentation with different colors for different level types No repainting - levels remain static
Epic Sails PRO is a clean, session-anchored VWAP indicator designed to provide a clear institutional price framework — not trade signals. It plots a stable VWAP with non-overlapping volatility bands and a real-time VWAP angle (in degrees) to help traders assess directional bias, slope strength, and market state. This tool is ideal for traders who prefer structure, context, and mechanical confirmation over subjective indicators. Key Features Session-anchored VWAP (resets at user-defined session s
Rocket Trend
Andriy Sydoruk
The Rocket Trend indicator is trending. The indicator draws two-color points connected by lines along the chart. This is a trend indicator, it is an algorithmic indicator. It is easy to work and understand when a blue circle appears, you need to buy, when a red one appears, sell. The indicator is used for scalping and pipsing, and has proven itself well. Rocket Trend is available for analyzing the direction of the trend for a specific period of time. Ideal for novice traders learning the laws o
M & W Pattern Pro is an advanced scanner for M and W patters , it uses extra filters to ensure scanned patterns are profitable. The indicator can be used with all symbols and time frames. The indicator is a non repaint indicator with accurate statistics calculations. To use , simply scan the most profitable pair using the statistics dashboard accuracy , then enter trades on signal arrow and exit at the TP and SL levels. STATISTICS : Accuracy 1 : This is the percentage of the times price hits TP
Color Histogram Volume Set
Ricardo Almeida Branco
Do you use volume in your reading of the market? Certainly many traders use it, and do not imagine operating without it. The Color Histogram Volume Set indicator allows the user to choose the value that he considers interesting to monitor. When you pass this you will have visual confirmation and if you want you will also have the audible alert that is given by the indicator. Of course, there are other ways to try to find a high volume, such as assessing whether the volume is above av
place a vwap line starting from the line placed on the chart parameters: tick_mode: enable to use ticks instead of bars. this uses a lot more cpu processing power prefix: prefix to add for line created by indicator line_color: set the color of the line created line_style: set the line style of the line created applied_price: set the price of bar to use of the bar std_dev_ratio: set the multiplier for the std dev channel
Fixed Range Volume Profile MT5
Abdelkhabir Yassine Alaoui
MT5에 대한 경고가 있는 자동 고정 범위 볼륨 프로필 이 지표는 가격이 더 많은 시간을 소비한 위치를 보여주고 거래에 사용할 수 있는 중요한 수준을 강조합니다. 그리고 주어진 거래 세션의 가장 중요한 가격 수준, 가치 영역 및 제어 가치를 요약하여 시간 경과에 따른 가격 밀도를 보여줄 수 있습니다. 이 표시기는 M1과 D1 사이의 기간에 첨부할 수 있으며 일일, 주간, 월간 또는 일중 세션에 대한 시장 프로필을 표시합니다. 더 낮은 기간은 더 높은 정밀도를 제공합니다. 더 나은 가시성을 위해 더 높은 기간이 권장됩니다. 프리 드로우 사각형 세션을 사용하여 임의의 시간대에 맞춤형 시장 프로필을 생성하는 것도 가능합니다. 프로필의 블록을 그리는 데 6가지 색 구성표를 사용할 수 있습니다. 일반 색상 히스토그램으로 프로필을 그리는 것도 가능합니다. 또는 강세/약세 막대를 기반으로 프로필 색상을 선택할 수 있습니다. 이 지표는 베어 프라이스 액션을 기반으로 하며 표준 지표를 사용하지
BoxProfile MT5
Evgeny Shevtsov
4.6 (10)
The indicator displays volume profiles based on the nesting principle. Profiles periods are pre-set so that each subsequent profile has a length twice as long as the length of the previous profile. In addition to profiles, the indicator displays volume clusters sorted by color, depending on the volume they contain. Indicator operation features The indicator works on typical timeframes from M5 to MN, but for calculations uses historical data from smaller timeframes: M1 - for timeframes from M5
FREE
SMC Venom Model BPR 지표는 Smart Money(SMC) 개념 내에서 일하는 트레이더를 위한 전문 도구입니다. 가격 차트에서 두 가지 주요 패턴을 자동으로 식별합니다. FVG (공정 가치 갭)는 3개의 캔들의 조합으로, 첫 번째와 세 번째 캔들 사이에 갭이 있습니다. 이는 볼륨 지원이 없는 레벨 사이에 구역을 형성하여 종종 가격 수정으로 이어집니다. BPR (균형 가격 범위)은 두 개의 FVG 패턴의 조합으로, "브리지"를 형성합니다. 이는 가격이 낮은 볼륨 활동으로 움직일 때 브레이크아웃과 레벨로의 복귀 구역으로, 캔들 사이에 갭을 생성합니다. 이러한 패턴은 거래자가 차트에서 거래량과 가격 역학을 분석하여 주요 지지/저항 수준, 돌파 구역 및 진입 지점을 식별하는 데 도움이 되며, 여기서 대형 시장 참여자와 일반 참여자 간의 상호 작용이 발생합니다. 이 지표는 사각형과 화살표 형태로 패턴을 시각화하며 유연한 경고 설정도 지원합니다. 주요 특징: 패턴 표시 모드
Manus Pro
Itumeleng Mohlouwa Kgotso Tladi
MANUS PRO EA The Trading Revolution You've Been Waiting For Are you TIRED of watching other traders make consistent profits while your account bleeds red?   The financial markets don't wait for anyone – and neither should you. MANUS PRO isn't just another Expert Advisor... it's your   TICKET TO FINANCIAL FREEDOM . Why MANUS PRO is Different (And Why Everyone's Talking About It) FOR BEGINNERS: Your Trading Mentor That Never Sleeps Zero Learning Curve   – Install, activate, and watch it wo
Trend and Signals MT5  indicator scans  30 trading Instruments (Forex, Metals and Indices).     It uses special algorithm on the  current market   based on   Pure Price Action   and display the overall trend and signal on the dashboard. When signals are produced the indicator sends alert and notification. Strategy for Signals This indicator uses the daily timeframe to determine the direction of the trend. The hourly timeframe is used to identify possible entries. Main trend and is determined by
Gioteen Volatility Index (GVI) - your ultimate solution to overcoming market unpredictability and maximizing trading opportunities. This revolutionary indicator helps you in lowering your losing trades due to choppy market movements. The GVI is designed to measure market volatility, providing you with valuable insights to identify the most favorable trading prospects. Its intuitive interface consists of a dynamic red line representing the volatility index, accompanied by blue line that indicate
Hurst buy and sell
Victor Alfonso Molina Botello
Hurst Buy and Sell This innovative indicator, inspired by xAI Grok intelligence, uses the Hurst exponent to identify the nature of the market and generate buy/sell signals. The EA for this indicator (Hurst Razer PRO EA MT5) is now available, you can see it by clicking here!  https://www.mql5.com/es/market/product/153441?source=Site+Profile+Seller  If you want more signals from the indicator, change the minimum number of bars between consecutive signals. The lower the value, the more signals it
11 Modules Description & Final Analyzer Trading Guide 1. Reaction Engine 2.0 Purpose : Measures market pressure by analyzing tick movements, volume, and speed within a time window.   How it works : Calculates weighted price changes, considers tick velocity and volatility, and applies EMA smoothing.   Trading use : Strong positive values indicate buying pressure Strong negative values indicate selling pressure Use as confirmation for entry/exit signals 2. Flow Pattern Detector Purpose : Identifie
Market Session Visual
Kambiz Shahriarynasab
The  Market Sessions Indicator for MT5 helps you  predict market turnarounds  by detecting major supply and demand areas. These pivot points tend to occur after a new session has started and the previous one is still open. It is also used to gauge how many points or pips the market moves on average during a session. This helps us to place better our take profits and stop losses. The indicator works on all forex pairs, gold, silver, commodities, stocks, indices and any other instrument that you
이 제품의 구매자들이 또한 구매함
Azimuth Pro
Ottaviano De Cicco
5 (1)
LAUNCH PROMO Azimuth Pro price is initially set at 299$ for the first 100 buyers. Final price will be 499$ . THE DIFFERENCE BETWEEN RETAIL AND INSTITUTIONAL ENTRIES ISN'T THE INDICATOR — IT'S THE LOCATION. Most traders enter at arbitrary price levels, chasing momentum or reacting to lagging signals. Institutions wait for price to reach structured levels where supply and demand actually shift. Azimuth Pro maps these levels automatically: swing-anchored VWAP, multi-timeframe structure lines, an
ARICoins
Temirlan Kdyrkhan
ARICoin is a powerful trading companion designed to generate high-probability entry signals with dynamic TP/SL/DP levels based on volatility. Built-in performance tracking shows win/loss stats, PP1/PP2 hits, and success rates all updated live. Key Features: Buy/Sell signals with adaptive volatility bands Real-time TP/SL/DP levels based on ATR Built-in MA Filter with optional ATR/StdDev volatility Performance stats panel (Success, Profit/Loss, PP1/PP2) Alerts via popup, sound, push, or email Cust
AriX
Temirlan Kdyrkhan
1 (4)
AriX Indicator for MT5 A powerful trend-following and signal-evaluation tool AriX is a custom MT5 indicator that combines Moving Averages and ATR-based risk/reward logic to generate clear buy/sell signals. It visualizes dynamic SL/TP levels, evaluates past trade outcomes, and displays win/loss statistics in a clean on-chart panel. Key features include: Buy/Sell signals based on MA crossovers ATR-based SL/TP1/TP2/TP3 levels with visual lines and labels Signal outcome tracking with real-time stat
ARIScalping
Temirlan Kdyrkhan
ARIScalp is a powerful trading companion designed to generate high-probability entry signals with dynamic TP/SL/DP levels based on volatility. Built-in performance tracking shows win/loss stats, PP1/PP2 hits, and success rates all updated live. Key Features: Buy/Sell signals with adaptive volatility bands Real-time TP/SL/DP levels based on ATR Built-in MA Filter with optional ATR/StdDev volatility Performance stats panel (Success, Profit/Loss, PP1/PP2) Alerts via popup, sound, push, or email Cus
Trend Screener Pro MT5
STE S.S.COMPANY
4.84 (99)
트렌드 표시기, 트렌드 트레이딩 및 필터링을 위한 획기적인 고유 솔루션, 하나의 도구 안에 내장된 모든 중요한 트렌드 기능! Forex, 상품, 암호 화폐, 지수 및 주식과 같은 모든 기호/도구에 사용할 수 있는 100% 다시 칠하지 않는 다중 시간 프레임 및 다중 통화 표시기입니다. Trend Screener는 차트에 점이 있는 화살표 추세 신호를 제공하는 효율적인 지표 추세 추종 지표입니다. 추세 분석기 표시기에서 사용할 수 있는 기능: 1. 트렌드 스캐너. 2. 최대 이익 분석이 있는 추세선. 3. 추세 통화 강도 측정기. 4. 경고가 있는 추세 반전 점. 5. 경고가 있는 강력한 추세 점. 6. 추세 화살표 Trend Screener Indicator가 있는 일일 분석 예, 일일 신호 성능...등은 여기에서 찾을 수 있습니다. 여기를 클릭하십시오. LIMITED TIME OFFER : Trend Screener Indicator는 50$ 및 평생 동안만 사용할 수 있습니다.
Rtc ML Ai Predictor
Muhammad Faisal Sagala
Rtc ML Ai | Predictor CORE MACHINE LEARNING ENGINE Adaptive ML Market Predictor – Multi-Bar Trend & Candle Forecast What This Indicator Does This indicator is a  real-time market prediction engine  designed to analyze price behavior and estimate  future market tendencies . Unlike conventional indicators, this system  does not rely on static parameters or historical curve-fitting , but adapts its internal state dynamically during live market operation. Instead of using static rules, the indic
우선적으로, 이 거래 도구는 전문적인 거래에 이상적인 비-다시 그리기 및 지연되지 않는 지표입니다.  온라인 강좌, 사용자 매뉴얼 및 데모. 스마트 가격 액션 컨셉트 인디케이터는 신규 및 경험 많은 트레이더 모두에게 매우 강력한 도구입니다. Inner Circle Trader Analysis 및 Smart Money Concepts Trading Strategies와 같은 고급 거래 아이디어를 결합하여 20가지 이상의 유용한 지표를 하나로 결합합니다. 이 인디케이터는 스마트 머니 컨셉트에 중점을 두어 대형 기관의 거래 방식을 제공하고 이동을 예측하는 데 도움을 줍니다.  특히 유동성 분석에 뛰어나 기관이 어떻게 거래하는지 이해하는 데 도움을 줍니다. 시장 트렌드를 예측하고 가격 변동을 신중하게 분석하는 데 탁월합니다. 귀하의 거래를 기관 전략에 맞추어 시장의 동향에 대해 더 정확한 예측을 할 수 있습니다. 이 인디케이터는 시장 구조를 분석하고 중요한 주문 블록을 식별하고 다양
Weis Wave with Alert MT5
Trade The Volume Waves Single Member P.C.
4.94 (17)
Rental/Lifetime Package Options and Privileges  Rent Monthly Six Months   Yearly/Lifetime Weis Wave with Speed with Alert+Speed Index x x x Manual  x x x Quick Set up Video x x x Blog x x x Lifetime Updates x x x Setup and Training Material x x Discord Access Channel "The SI traders"          x Rectangle Break Alert Tool      x How to trade with it:    http://www.tradethevolumewaves.com   ** If you purchase please contact me to setup your  : Training Room and  complete manual access.  Wei
Berma Bands
Muhammad Elbermawi
5 (7)
Berma Bands(BBs) 지표는 시장 동향을 파악하고 이를 활용하려는 트레이더에게 귀중한 도구입니다. 가격과 BBs 간의 관계를 분석함으로써 트레이더는 시장이 추세 단계인지 범위 단계인지를 분별할 수 있습니다. 자세한 내용을 알아보려면 [ Berma Home Blog ]를 방문하세요. 버마 밴드는 세 개의 뚜렷한 선으로 구성되어 있습니다. 어퍼 버마 밴드, 미들 버마 밴드, 로어 버마 밴드입니다. 이 선들은 가격 주위에 그려져 전체 추세에 대한 가격 움직임을 시각적으로 표현합니다. 이 밴드들 사이의 거리는 변동성과 잠재적인 추세 반전에 대한 통찰력을 제공할 수 있습니다. 버마 밴드 라인이 각각에서 분리될 때, 그것은 종종 시장이 횡보 또는 범위 이동 기간에 접어들고 있음을 시사합니다. 이는 명확한 방향 편향이 없음을 나타냅니다. 트레이더는 이러한 기간 동안 추세를 파악하기 어려울 수 있으며 더 명확한 추세가 나타날 때까지 기다릴 수 있습니다. 버마 밴드 라인이 단일 라인으로
MetaForecast M5
Vahidreza Heidar Gholami
5 (3)
MetaForecast는 가격 데이터의 조화를 기반으로 모든 시장의 미래를 예측하고 시각화합니다. 시장이 항상 예측 가능한 것은 아니지만 가격에 패턴이 있다면 MetaForecast는 가능한 정확하게 미래를 예측할 수 있습니다. 다른 유사한 제품과 비교했을 때, MetaForecast는 시장 동향을 분석하여 더 정확한 결과를 생성할 수 있습니다. 입력 매개변수 Past size (과거 크기) MetaForecast가 미래 예측을 생성하기 위한 모델을 만드는 데 사용하는 막대의 수를 지정합니다. 모델은 선택한 막대 위에 그려진 노란색 선으로 표시됩니다. Future size (미래 크기) 예측해야 할 미래 막대의 수를 지정합니다. 예측된 미래는 핑크색 선으로 표시되며 그 위에 파란색 회귀선이 그려집니다. Degree (차수) 이 입력은 MetaForecast가 시장에서 수행할 분석 수준을 결정합니다. Degree 설명  0 차수 0의 경우, "Past size" 입력에 모든 봉우리와
ARIPoint
Temirlan Kdyrkhan
1 (1)
ARIPoint is a powerful trading companion designed to generate high-probability entry signals with dynamic TP/SL/DP levels based on volatility. Built-in performance tracking shows win/loss stats, PP1/PP2 hits, and success rates all updated live. Key Features: Buy/Sell signals with adaptive volatility bands Real-time TP/SL/DP levels based on ATR Built-in MA Filter with optional ATR/StdDev volatility Performance stats panel (Success, Profit/Loss, PP1/PP2) Alerts via popup, sound, push, or email Cu
RelicusRoad Pro MT5
Relicus LLC
5 (24)
훌륭한 백테스트, 환상적인 숫자로 입증된 실제 계정 성능, 그리고 모든 곳에 퍼져 있는 통계를 자랑하는 트레이딩 지표를 얼마나 자주 구매하셨습니까? 하지만 사용 후에는 결국 계좌를 날려버리셨나요? 신호 자체만으로는 신뢰할 수 없습니다. 신호가 왜 처음 나타났는지 알아야 하며, 그것이 바로 RelicusRoad Pro가 가장 잘하는 일입니다! 사용자 매뉴얼 + 전략 + 교육 비디오 + VIP 액세스 전용 그룹 + 모바일 버전 사용 가능 시장을 보는 새로운 방법 RelicusRoad는 외환, 선물, 암호화폐, 주식 및 지수를 위한 세계에서 가장 강력하고 최고의 트레이딩 지표 로서, 트레이더가 계좌를 성장시키는 데 필요한 모든 정보와 도구를 제공합니다. 우리는 기술 분석 및 트레이딩 계획 을 제공하여 초보자 부터 고급 트레이더 까지 모든 트레이더가 성공할 수 있도록 돕습니다. 이것은 미래 시장을 예측 하는 데 충분한 정보를 제공하는 핵심 트레이딩 지표 입니다. 우리는 차트에서 의미 없
Elliott Wave Trend MT5
Young Ho Seo
4 (4)
Elliott Wave Trend was designed for the scientific wave counting. This tool focuses to get rid of the vagueness of the classic Elliott Wave Counting using the guideline from the template and pattern approach. In doing so, firstly Elliott Wave Trend offers the template for your wave counting. Secondly, it offers Wave Structural Score to assist to identify accurate wave formation. It offers both impulse wave Structural Score and corrective wave Structure Score. Structural Score is the rating to sh
Max Ribbon Mt5
Stefano Frisetti
WARNING: This indicator is distributed EXCLUSIVELY on MQL5.com MT4 version:   https://www.mql5.com/it/market/product/160363 MT5 version:   https://www.mql5.com/it/market/product/160410 ============================================================================================= MAX RIBBON ver 1.00 The indicator that shows you the TREND clearly and unambiguously! ============================================================================================= DESCRIPTION MAX RIBBON is an advanced tre
SynaptixQuant Dominance Matrix
Devie Arevalo Montemayor
5 (1)
SynaptixQuant Dominance Matrix: Institutional-Grade Market State Extraction Engineered for traders who require a data-driven view of market behaviour beyond surface-level indicators. The Synaptix Quant (SQ) Dominance Matrix is not a conventional currency strength display. Behind its intentionally streamlined interface runs a sophisticated analytical architecture designed to quantify market conditions with precision. Every output is generated through layered signal processing built to identify d
FootprintOrderflow
Jingfeng Luo
5 (3)
FOOTPRINTORDERFLOW: The Authoritative Guide ( This indicator is also compatible with economic providers that do not offer DOM data and BID/ASK data, It also supports various foreign exchange transactions ) 1. Overview FOOTPRINTORDERFLOW  is an advanced Order Flow analysis tool designed for MetaTrader 5 (MT5). Unlike traditional candlestick charts that only show OHLC (Open, High, Low, Close), this indicator parses real-time Tick data to visualize the microstructure inside every candle. It helps y
+++++++++++++++++++++++++++++++++++++++++++++++++++++++++++++++++++++++++++++++++++++++++++++++++ +++ Link to EURUSD Only Free Version -->  https://www.mql5.com/en/market/product/156904?source=Unknown +++++++++++++++++++++++++++++++++++++++++++++++++++++++++++++++++++++++++++++++++++++++++++++++++ Hallo Trader, This is a traditional GANN & FIBONACCI strategy based on detection of an impulsive move in the opposite direction. This is called a Breakout. At the moment of Breakout, the indicator draw
Hyperbolic
Konstantin Gruzdev
The indicator is stable on noise fluctuations in price and quickly reacts to the trend. It is based on an algorithm from a system of hyperbolic functions that allows you to aggressively smooth the flat with minimal lag on the trend. It can be applied directly to the price chart, to itself, or to other indicators in order to eliminate false signals. The main purpose of the indicator is to smooth out small sawtooth price movements as much as possible. The higher the Hyperbolic parameter, the stron
Prices move for many reasons and these can vary from one operator to another: software, private and institutional traders simultaneously contribute to the formation of the price, making predictive art very difficult. However, there are measurable factors that bind the price to an underlying trend in line with the physical reality that the financial asset represents: these are the macroeconomic indicators. Large investors use this information wisely to set their strategies. Understanding these m
Matreshka
Dimitr Trifonov
5 (2)
Matreshka self-testing and self-optimizing indicator: 1. Is an interpretation of the Elliott Wave Analysis Theory. 2. Based on the principle of the indicator type ZigZag, and the waves are based on the principle of interpretation of the theory of DeMark. 3. Filters waves in length and height. 4. Draws up to six levels of ZigZag at the same time, tracking waves of different orders. 5. Marks Pulsed and Recoil Waves. 6. Draws arrows to open positions 7. Draws three channels. 8. Notes support and re
Stop calculating lot sizes manually. Stop guessing your Risk/Reward ratio. The Risk Reward Tool brings the intuitive, visual trading style of TradingView directly to your MetaTrader 5 charts. It is designed for traders who value speed, precision, and visual clarity. Whether you trade Forex, Indices (DAX, US30), or Commodities (Gold, Oil), this tool handles the math for you. Simply click "Long" or "Short," drag the lines to your levels, and the tool instantly tells you exactly how many lots to t
Bill Williams Advanced
Siarhei Vashchylka
5 (10)
Bill Williams Advanced is designed for automatic chart analysis using Bill Williams' "Profitunity" system. The indicator analyzes four timeframes at once. Manual (Be sure to read before purchasing) Advantages 1. Analyzes the chart using Bill Williams' "Profitunity" system. Signals are displayed in a table in the corner of the screen and on the price chart. 2. Finds all known AO and AC signals, as well as zone signals. Equipped with a trend filter based on the Alligator. 3. Finds "Divergence Bar
TrendMaestro5
Stefano Frisetti
note: this indicator is for METATRADER4, if you want the version for METATRADER5 this is the link:  https://www.mql5.com/it/market/product/108106 TRENDMAESTRO ver 2.5 TRENDMAESTRO recognizes a new TREND from the start, he never makes mistakes. The certainty of identifying a new TREND is priceless. DESCRIPTION TRENDMAESTRO identifies a new TREND in the bud, this indicator examines the volatility, volumes and momentum to identify the moment in which there is an explosion of one or more of these da
VTrende Pro
Andrii Diachenko
5 (1)
VTrende Pro - MTF indicator for trend trading with a display panel for MT5 *** Videos can be translated into any language using subtitles (video language - Russian) Although the signals of the VTrende Pro indicator can be used as signals of a full-fledged trading system, it is recommended to use them in conjunction with the Bill Williams TS. VTrende Pro is an extended version of the VTrende indicator. Difference between Pro version and VTrende: - Time zones - Signal V - signal 1-2 waves -    S
Step into the world of Forex trading with confidence, clarity, and precision using Gold Indicator a next-generation tool engineered to take your trading performance to the next level. Whether you’re a seasoned professional or just beginning your journey in the currency markets, Gold Indicator equips you with powerful insights and help you trade smarter, not harder. Built on the proven synergy of three advanced indicators, Gold Indicator focuses exclusively on medium and long-term trends elimina
무료 AUX 인디케이터와 EA 지원을 받으세요 직접 다운로드 — 여기를 클릭 [ D.I.C.E ] The DICE Indicator  Divergence in Chaos Environment는 엘리엇 파동 이론과 트레이딩 카오스 기법을 함께 사용하는 트레이더를 위해 설계된 MT5 전문 도구입니다. 가격 움직임의 숨겨진 및 일반 다이버전스를 감지하며, 빌 윌리엄스가 설명한 혼돈 시장 환경과 동기화됩니다. 주요 특징 엘리엇 파동 정렬 다이버전스: 파동 구조에 조화된 강세 및 약세 다이버전스를 탐지하여 파동 카운팅 정확도를 높입니다. 카오스 기법 통합: AO(오썸 오실레이터) 및 시장 구조 원칙과 일치하도록 설계되었습니다. 다중 타임프레임 스캐닝: 다양한 시간 프레임에서 다이버전스를 분석하여 모멘텀 변화와 추세 소진을 확인합니다. 시각적 알림 및 객체: 명확한 화살표, 선, 표시로 빠른 인식 가능. 적응형 시장 판독: 혼돈 시장 조건에 자동으로 조정되어 노이즈를 필터링하고 유효한 셋업만
Orderflow Scalp Pro v2.4   delivers institutional-grade trading intelligence through advanced volume analysis, dynamic VWAP calculations, real-time aggressive score monitoring, and precision arrow signals. This complete trading system transforms complex market data into clear, actionable signals for consistent profitability on 3-4 minute timeframes. Full Documentation: [Download PDF] Four Powerful Components in One System Volume Profile HeatMap with POC/VAH/VAL Transform your charts into inst
MR Reversal Patterns 5
Sergey Khramchenkov
5 (2)
In the "Masters of Risk" trading system, one of the main concepts is related to places where markets change direction. In fact, this is a change in priority and a violation of the trend structure at the extremes of the market, where supposedly there are or would be stop-losses of "smart" participants who are outside the boundaries of the accumulation of volume. For this reason, we call them "Reversal Patterns" - places with a lot of weight for the start of a new and strong trend. Some of the imp
MonsterDash Harmonics Indicator is a harmonic pattern dashboard. It recognizes all major patterns. MonsterDash is a dashboard that displays all detected patterns for all symbols and (almost) all timeframes in sortable and scrollable format. Users can add their own user defined patterns . MonsterDash can open and update charts with the pattern found. Settings MonsterDash's default settings are good enough most of the time. Feel free to fine tune them to your needs. The color settings are for tho
The Volume Spread Analysis indicator is based on the original Volume Spread Analysis method. It was designed for quick and easy recognition of VSA patterns. Even though this indicator looks very simple, it is the most sophisticated tool we've ever made. It is a really powerful analytical tool that generates very reliable trading signals. Because it is very user-friendly and understandable, it is suitable for every type of trader, regardless of his experience. What is VSA? VSA - Volume Spread A
제작자의 제품 더 보기
Meravith Auto는 Meravith 거래 시스템의 자동화 버전입니다. 이 지표는 색상이 변하는 추세선으로 구성되어 있습니다. 상승 추세일 때는 녹색, 하락 추세일 때는 빨간색입니다. 이것이 추세 지지선입니다. 상승 거래량과 하락 거래량이 같은 유동성 라인. 세 배 상승 편차 라인. 세 배 하락 편차 라인. 높은 거래량을 나타내는 보라색 및 파란색 점. 보라색 점은 평균 거래량보다 2편차 큰 거래량을 나타내며, 파란색 점은 2편차를 나타냅니다. 사용 방법은? 상승 추세선과 추세선 위의 유동성은 상승 추세를 나타냅니다. 시장이 상승할 것으로 예상됩니다. 롱 포지션을 엽니다. 하락 추세선과 추세선 아래의 유동성은 하락 추세를 나타냅니다. 시장이 하락할 것으로 예상됩니다. 숏 포지션을 엽니다. 다른 지표와 자유롭게 조합하여 사용할 수 있습니다. 모든 통화쌍과 모든 시간대에서 사용할 수 있습니다. 브로커마다 표시하는 거래량이 다르기 때문에 결과가 다를 수 있습니다. 거래량이 많은 대
Meravith AUTO
Ivan Stefanov
5 (1)
Meravith Auto는 Meravith 거래 시스템의 자동화 버전입니다. 이 지표는 색상이 변하는 추세선으로 구성되어 있습니다. 상승 추세일 때는 녹색, 하락 추세일 때는 빨간색입니다. 이것이 추세 지지선입니다. 상승 거래량과 하락 거래량이 같은 유동성 라인. 세 배 상승 편차 라인. 세 배 하락 편차 라인. 높은 거래량을 나타내는 보라색 및 파란색 점. 보라색 점은 평균 거래량보다 2편차 큰 거래량을 나타내며, 파란색 점은 2편차를 나타냅니다. 사용 방법은? 상승 추세선과 추세선 위의 유동성은 상승 추세를 나타냅니다. 시장이 상승할 것으로 예상됩니다. 롱 포지션을 엽니다. 하락 추세선과 추세선 아래의 유동성은 하락 추세를 나타냅니다. 시장이 하락할 것으로 예상됩니다. 숏 포지션을 엽니다. 다른 지표와 자유롭게 조합하여 사용할 수 있습니다. 모든 통화쌍과 모든 시간대에서 사용할 수 있습니다. 브로커마다 표시하는 거래량이 다르기 때문에 결과가 다를 수 있습니다. 거래량이 많은 대형
Meravith
Ivan Stefanov
5 (1)
이 인디케이터는 각 지점에서 볼륨을 분석하고 해당 볼륨에 대한 시장의 피로 레벨을 계산합니다. 이 인디케이터는 세 개의 라인으로 구성됩니다: 강세 볼륨 피로 라인 약세 볼륨 피로 라인 시장 추세를 나타내는 라인. 이 라인은 시장이 강세인지 약세인지에 따라 색이 변합니다. 원하는 시작 지점에서 시장을 분석할 수 있습니다. 볼륨 피로 라인에 도달하면 다음 분석을 시작할 새 지점을 식별하세요. 트렌드와 수정 모두 분석할 수 있습니다. 좋은 접근 방법은 트렌드 라인에 도달하거나 고점 또는 저점에 도달할 때마다 인디케이터를 이동시키는 것입니다. 트렌드 라인과 볼륨 피로 라인 간의 거리가 클수록 해당 방향의 볼륨이 더 큽니다. 트렌드 라인은 주문을 열기 위한 장소로 사용할 수 있으며, 피로 라인은 수익을 얻는 데 사용됩니다. 이 시스템은 정말 독특하지만 매우 직관적입니다. 시장에는 비슷한 제품이 없습니다. 사용에 제한이 없습니다. 모든 시장과 모든 시간 프레임에서 적용할 수 있습니다. 중요:
MACD divergency
Ivan Stefanov
5 (4)
이 지표는 지수이동평균(EMA) 기간을 5(빠름)와 34(느림), 신호선 기간을 5로 설정하여 가격 움직임과 MACD 히스토그램 간의 강세 및 약세 다이버전스를 정확하게 식별합니다. 지표는 모멘텀이 약화되는 지점을 강조 표시하여 잠재적 추세 반전을 알립니다. 올바른 다이버전스 식별 규칙: 강세 다이버전스는 가격이 더 낮은 저점을 형성하면서 MACD 히스토그램이 동시에 0선 위에서 더 높은 저점을 형성할 때 유효합니다. 약세 다이버전스는 가격이 더 높은 고점을 형성하면서 MACD 히스토그램이 동시에 0선 아래에서 더 낮은 고점을 형성할 때 유효합니다. 히스토그램의 극값과 가격의 극값이 0선의 같은 쪽에 있지 않으면 다이버전스 신호는 무효로 간주되며, 이는 잘못된 신호를 초래할 수 있습니다. 이 접근법은 MACD 다이버전스 분석을 적용하는 가장 정확하고 신뢰할 수 있는 방법을 제시합니다. 지표 특징: 확인된 강세 및 약세 다이버전스를 명확하게 표시합니다. 신뢰성을 높이기 위해 MACD
FREE
이 인디케이터는 MetaTrader 4 및 5용 인터랙티브 엘리엇 파동 라벨링 도구입니다. 차트에 표시된 메뉴에서 라벨 크기, 색상, 파동 유형(ABC 조정파, 5파동 임펄스 또는 WXY 구조)을 선택하여 차트에 직접 파동 라벨을 수동으로 배치할 수 있습니다. 차트를 한 번 클릭하면 선택한 가격과 시간 위치에 맞는 파동 라벨이 순차적으로 배치되어, 트레이더가 엘리엇 파동 구조를 시각적으로 표시하고 정리하는 데 도움을 줍니다. 마음에 드신다면 평가해 주세요! 이 인디케이터는 MetaTrader 4 및 5용 인터랙티브 엘리엇 파동 라벨링 도구입니다. 차트에 표시된 메뉴에서 라벨 크기, 색상, 파동 유형(ABC 조정파, 5파동 임펄스 또는 WXY 구조)을 선택하여 차트에 직접 파동 라벨을 수동으로 배치할 수 있습니다. 차트를 한 번 클릭하면 선택한 가격과 시간 위치에 맞는 파동 라벨이 순차적으로 배치되어, 트레이더가 엘리엇 파동 구조를 시각적으로 표시하고 정리하는 데 도움을 줍니다. 마음
FREE
Imbalance Pro
Ivan Stefanov
5 (4)
이 인디케이터는 선택한 기간 동안 상승과 하락 사이의 불균형을 측정하고 두 지점 사이의 직선을 표시합니다. 상승세가 하락세보다 거래량이 많으면 선이 녹색으로 바뀝니다.  하락세가 더 많으면 빨간색으로 표시됩니다. 이 선은 거래량의 백분율 차이도 표시합니다. 표시기는 별도의 창에 동일한 데이터를 표시합니다. 분할된 볼륨도 볼 수 있습니다. 표시기에는 두 가지 모드가 있습니다. 이를 위해 왼쪽 상단에 버튼이 있습니다,  - 누르지 않으면 시장의 임의의 지점과 현재 가격 사이의 불균형을 측정합니다.  - 버튼을 누르면 선택한 시장의 두 지점 사이의 잔액을 측정할 수 있습니다. 이 인디케이터는 선택한 기간 동안 상승과 하락 사이의 불균형을 측정하고 두 지점 사이의 직선을 표시합니다. 상승세가 하락세보다 거래량이 많으면 선이 녹색으로 바뀝니다.  하락세가 더 많으면 빨간색으로 표시됩니다. 이 선은 거래량의 백분율 차이도 표시합니다. 표시기는 별도의 창에 동일한 데이터를 표
Two Snakes
Ivan Stefanov
5 (1)
2 SNAKES  is a first class scalping system. As the entries are quite precise, you are likely to become addicted to this system very quickly.  You have 2 snakes. When you see a candle above or below them that does not touch them - that is your scalping signal. Then buy or sell at the green line or close. If you use a larger time frame, scalping can become trend following. The snakes are calculated precisely in relation to the current state of the market. They ARE NOT moving averages.  You decide
이 인디케이터는 MetaTrader 4 및 5용 인터랙티브 엘리엇 파동 라벨링 도구입니다. 차트에 표시된 메뉴에서 라벨 크기, 색상, 파동 유형(ABC 조정파, 5파동 임펄스 또는 WXY 구조)을 선택하여 차트에 직접 파동 라벨을 수동으로 배치할 수 있습니다. 차트를 한 번 클릭하면 선택한 가격과 시간 위치에 맞는 파동 라벨이 순차적으로 배치되어, 트레이더가 엘리엇 파동 구조를 시각적으로 표시하고 정리하는 데 도움을 줍니다. 마음에 드신다면 평가해 주세요! 이 인디케이터는 MetaTrader 4 및 5용 인터랙티브 엘리엇 파동 라벨링 도구입니다. 차트에 표시된 메뉴에서 라벨 크기, 색상, 파동 유형(ABC 조정파, 5파동 임펄스 또는 WXY 구조)을 선택하여 차트에 직접 파동 라벨을 수동으로 배치할 수 있습니다. 차트를 한 번 클릭하면 선택한 가격과 시간 위치에 맞는 파동 라벨이 순차적으로 배치되어, 트레이더가 엘리엇 파동 구조를 시각적으로 표시하고 정리하는 데 도움을 줍니다. 마음
FREE
Meravith MT5
Ivan Stefanov
이 인디케이터는 임의의 지점에서 거래량을 분석하고 해당 거래량의 시장 소진(exhaustion) 수준을 계산합니다. Meravith 주요 라인: 강세 거래량 소진선 – 목표로 사용됩니다. 약세 거래량 소진선 – 목표로 사용됩니다. 추세선 – 시장 추세를 나타냅니다. 시장이 강세인지 약세인지에 따라 색상이 변경되며, 추세 지지선 역할을 합니다. 사용 방법: 보라색 세로선을 더블 클릭한 후 원하는 위치로 이동시키십시오. 추세와 조정을 포함해 무엇이든 분석할 수 있습니다. 인디케이터를 시장의 상단, 하단 또는 중요하다고 생각되는 임의의 지점으로 이동시킬 수 있습니다. 좋은 방법은 시장이 소진선 사이에 머물도록 Meravith를 설정하는 것입니다. 이렇게 하면 추적할 수 있는 명확한 목표를 갖게 됩니다. 초기 소진선이 돌파되면 새로운 소진선이 나타나며, 추가로 거래 가능한 채널이 형성됩니다. 소진 수준에 도달하면 인디케이터의 위치를 다시 조정하거나 다른 시간 프레임으로 전환하여 새로운 소진
전설적인 윌리엄 갠(William Gann) 수준을 완전 자동화하여 표시하는 MT5 인디케이터. GANN Master는 일간, 주간, 월간 데이터를 바탕으로 가격이 전환하거나 추세를 이어갈 가능성이 높은 핵심 구역을 정확히 포착합니다. 주요 기능 원클릭 기간 선택 버튼 : Daily, Weekly, Monthly 버튼 클릭 한 번으로 해당 일, 주, 월의 구역을 즉시 표시 자동 및 수동 모드 자동 모드: GANN Master가 모든 레벨을 자동으로 계산, 수동 입력 불필요 수동 모드: 차트에서 Top 및 Bottom 라인을 드래그하여 스윙 포인트를 설정하면, 모든 Gann 레벨이 즉시 재계산 매수 및 매도 레벨 : 강세(매수)·약세(매도) 레벨을 모두 표시, 레벨이 모일수록 강력한 지지/저항 구역 표시 다양한 자산 지원 : Forex, 귀금속(Gold 등), 지수, 암호화폐 등 고가 자산 모두 지원 — 설정에서 자산 클래스를 변경하면 자동으로 스케일 및 승수 조정 직관적 인터페이스
Naturu
Ivan Stefanov
5 (1)
“Naturu”는 자연의 대칭성을 알고리즘으로 활용하는 수동 인디케이터입니다. 간단한 전략과 숨겨진 지혜로 시장을 제패하세요! 인디케이터를 로드하면 위(Top)와 아래(Bottom) 두 개의 라인이 표시됩니다. 라인을 한 번 클릭해 활성화한 후, 이동하고 싶은 캔들 위를 클릭하면 그 위치로 이동합니다. 사용자가 고점과 저점을 지정하면, 인디케이터가 자동으로 계산합니다: 마젠타 색 영역: 상승(불) 세력과 하락(곰) 세력의 관심이 가장 가까워져서 지지/저항이 될 가능성이 큰 구간 회색 영역: 다음 관심 구간 아쿠아 색 실선: 상승 세력의 목표가 골드 색 실선: 하락 세력의 목표가 수동 인디케이터는 실시간 시장 상황과 개인의 직관에 따라 레벨을 자유롭게 조정할 수 있는 완전한 제어력과 유연성을 제공합니다. 직접 가격 움직임을 분석함으로써 지지·저항과 패턴 형성을 본질적으로 이해할 수 있습니다. 인간의 판단을 통해 자동 시스템이 놓치거나 오해하기 쉬운 ‘노이즈’를 걸러내어 잘못된 신호를
Sense
Ivan Stefanov
5 (2)
SENSE는 선택된 GANN 방식과 프랙탈 계산을 결합한 자동화된 시스템입니다. 이 시스템은 거래를 개시하고 청산할 위치를 알려줍니다. 더 이상 복잡한 계산에 시간을 낭비할 필요가 없습니다. SENSE가 모든 것을 알아서 해줍니다. 인디케이터를 설치하기만 하면 됩니다. 기본 원칙: 가격이 흰색 선 위에 있으면 시장은 강세입니다. 흰색 선 위에서 매수, 아래에서 손절 녹색 선은 상승 목표 가격이 흰색 선 아래에 있으면 시장은 약세입니다. 흰색 선 아래에서 매도, 그 위에 스톱 빨간색 선은 하락 목표 녹색 또는 빨간색 이중선은 강세 구간을 나타냅니다. 왜 센스인가? 수익 목표: SENSE는 자동으로 이익 실현 목표를 설정하여 트레이딩 성공을 극대화할 수 있도록 도와줍니다. 자동 적응: 인디케이터는 모든 차트주기에 대해 자동으로 다시 계산하여 수동으로 조정할 필요 없이 정확하고 신뢰할 수 있는 신호를 제공합니다. 스캘핑에도 좋습니다. 데모를 확인해 보세요!
Balance Levels is an easy-to-use trading indicator that provides clear buy and sell signals along with dynamic price levels, helping traders plan their entries and exits with more confidence. The tool is highly flexible – it can be used as a standalone strategy or integrated into any existing trading system. It works on all timeframes and across all markets: Forex, Gold, Indices, Crypto, or Stocks. Balance Levels suits every trading style – from scalping and intraday, to swing trading and even l
Balance Levels
Ivan Stefanov
Balance Levels는 명확한 매수 및 매도 신호와 동적인 가격 레벨을 제공하는 사용하기 쉬운 트레이딩 인디케이터로, 트레이더가 보다 자신 있게 진입과 청산을 계획할 수 있도록 도와줍니다. 이 도구는 매우 유연하여 독립적인 전략 으로 사용할 수도 있고 기존의 트레이딩 시스템에 통합할 수도 있습니다. 모든 시간 프레임과 모든 시장 에서 작동합니다: 외환, 금, 지수, 암호화폐, 주식 등. Balance Levels는 스캘핑 , 단타 매매 , 스윙 트레이딩 , 장기 투자까지 모든 트레이딩 스타일에 적합합니다. 시각적 신호와 밸런스 존을 통해 차트를 더욱 명확하게 하고 불필요한 “노이즈”를 제거합니다. 구매 후에는 이 도구를 최대한 활용하고 자신의 트레이딩 스타일에 성공적으로 통합할 수 있도록 가이드와 추가 자료 를 받을 수 있습니다. 초보자든 경험 많은 트레이더든, Balance Levels는 시장에서의 의사결정을 개선할 수 있는 실용적이고 저렴한 솔루션입니다. 구매 전에 무료 데
Most visited level PRO
Ivan Stefanov
5 (2)
이 지표는 실제 경험을 바탕으로 합니다.  최고/최저의 날짜/시간을 입력합니다. 고점/저점부터 현재 시점까지 가장 많이 방문한 레벨을 계산합니다. 새로운 캔들이 생길 때마다 자동으로 업데이트됩니다. 다양한 추세와 기간에 대해 여러 지표를 동시에 사용할 수 있습니다. 기간은 항상 생리 시작부터 현재까지의 기간으로 표시됩니다. 유용한 프로 도구. 이 지표는 실제 경험을 바탕으로 합니다.  최고/최저의 날짜/시간을 입력합니다. 고점/저점부터 현재 시점까지 가장 많이 방문한 레벨을 계산합니다. 새로운 캔들이 생길 때마다 자동으로 업데이트됩니다. 다양한 추세와 기간에 대해 여러 지표를 동시에 사용할 수 있습니다. 기간은 항상 생리 시작부터 현재까지의 기간으로 표시됩니다. 유용한 프로 도구. 이 지표는 실제 경험을 바탕으로 합니다.  최고/최저의 날짜/시간을 입력합니다. 고점/저점부터 현재 시점까지 가장 많이 방문한 레벨을 계산합니다. 새로운 캔들이 생길 때마다
FREE
Separated Volume
Ivan Stefanov
5 (1)
이 지표는 외환 시장의 틱 거래량을 강세와 약세 카테고리로 효과적으로 구분합니다. 또한 선택한 기간 동안 강세 및 약세 틱 거래량의 합계를 계산하여 표시하는 기능도 제공합니다. 차트에서 파란색 선 두 개를 움직여 기간을 쉽게 조정할 수 있으므로 거래 요구에 맞는 맞춤형 거래량 분석을 할 수 있습니다. 유용하게 사용하셨다면 리뷰를 남겨주시면 감사하겠습니다! 행복한 거래 되세요! 이 지표는 외환 시장의 틱 거래량을 강세와 약세 카테고리로 효과적으로 구분합니다. 또한 선택한 기간 동안 강세 및 약세 틱 거래량의 합계를 계산하여 표시하는 기능도 제공합니다. 차트에서 파란색 선 두 개를 움직여 기간을 쉽게 조정할 수 있으므로 거래 요구에 맞는 맞춤형 거래량 분석을 할 수 있습니다. 유용하게 사용하셨다면 리뷰를 남겨주시면 감사하겠습니다! 행복한 거래 되세요!
FREE
Enigmera
Ivan Stefanov
5 (8)
ENIGMERA: 시장의 핵심 중요: MQL5.com의 데모는 Strategy Tester에서 실행되며 Enigmera의 기능을 완전히 반영하지 못할 수 있습니다. 설명, 스크린샷 및 비디오를 확인하여 자세한 내용을 확인하십시오. 질문이 있으면 언제든지 메시지를 보내주세요! 인디케이터의 코드는 완전히 다시 작성되었습니다. 버전 3.0은 새로운 기능을 추가하고 인디케이터가 처음 출시된 이후 누적된 버그를 수정했습니다. 소개 이 인디케이터 및 거래 시스템은 금융 시장에 대한 주목할 만한 접근 방식입니다. ENIGMERA는 프랙탈 주기를 사용하여 정확하게 지원 및 저항 수준을 계산합니다. 실제 축적 단계를 보여주고 방향과 목표를 제공합니다. 트렌드와 수정 모두에서 작동하는 시스템입니다. 작동 방식 인디케이터의 대부분의 기능은 차트 왼쪽에 있는 버튼을 통해 제어되며, 이를 통해 다양한 시장 상황에 빠르게 대응할 수 있습니다. 버튼 ON/OFF – 인디케이터 전체를 표시하거나 숨깁니다.
Levelss
Ivan Stefanov
5 (1)
레벨스 지표가 표시됩니다: - 일일 강세 및 약세 영역. 매일 00:00~23:59에 표시됩니다.  - 주간 강세 및 약세 영역. 매주 월요일 0:00부터 금요일 23:59까지 표시됩니다. - 특정 시간대에서 특별히 계산된 채널로 다른 모든 시간대에 표시됩니다. 기본적으로 4시간 주기로 표시되며 거래하고자 하는 다른 주기로 변경할 수 있습니다. 논스톱으로 계산됩니다. 화면 왼쪽 상단에는 강세, 약세 또는 중립 영역과 채널이 표시됩니다. 세 가지가 모두 강세인 경우 현재 캔들에 녹색 점이 나타납니다. 세 개가 모두 약세인 경우 분홍색 점이 나타납니다. 인디케이터에는 제한이 없습니다. 레벨스 지표가 표시됩니다: - 일일 강세 및 약세 영역. 매일 00:00~23:59에 표시됩니다.  - 주간 강세 및 약세 영역. 매주 월요일 0:00부터 금요일 23:59까지 표시됩니다. - 특정 시간대에서 특별히 계산된 채널로 다른 모든 시간대에 표시됩니다. 기본적으로 4시간 주기로 표시되며
GANN Master
Ivan Stefanov
5 (1)
GANN의 정확한 목표는 그의 오랜 방법론에 따라 계산되어 눈앞에 제시됩니다. 이 도구는 거래를 더욱 쉽고 직관적으로 만들어줍니다. 흰 선을 위로 또는 녹색 선을 아래로 움직이면 GANN의 기법이 여전히 거래 세계에서 영향력 있는 이유를 즉시 알 수 있습니다. GANN의 전략은 시장 움직임을 높은 정확도로 예측하는 데 중점을 두며, 이 도구는 그 힘을 여러분의 손끝에 전달합니다. 숙련된 트레이더든 초보자든, 선을 조작하면 그의 접근 방식이 왜 오랜 세월 동안 신뢰받았는지 깊이 이해할 수 있게 될 것입니다. GANN의 정확한 목표는 그의 오랜 방법론에 따라 계산되어 눈앞에 제시됩니다. 이 도구는 거래를 더욱 쉽고 직관적으로 만들어줍니다. 흰 선을 위로 또는 녹색 선을 아래로 움직이면 GANN의 기법이 여전히 거래 세계에서 영향력 있는 이유를 즉시 알 수 있습니다. GANN의 전략은 시장 움직임을 높은 정확도로 예측하는 데 중점을 두며, 이 도구는 그 힘을 여러분의 손끝에 전달합니다.
Stefanov
Ivan Stefanov
The indicator displays support and resistance zones defined logically using the MACD. The entire concept is explained in the video, with specific examples shown. The indicator works on any instruments and timeframes. It does not repaint. After placing it on the chart, please go through all the timeframes sequentially, from monthly to 1-minute, so that all lines load correctly. After that, you can start using it. The concept is unique and has not been seen in other systems or indicators.
Fifty Pro
Ivan Stefanov
5 (1)
FIFTY 인디케이터는 이제 자동화된 버전으로 제공되어 수동으로 레벨을 그릴 필요가 없습니다. 이 버전은 일간, 주간, 월간 및 연간 레벨을 자동으로 차트에 표시하여 정확성을 보장하고 시간을 절약합니다. 또한, 이러한 레벨의 표시 여부를 전환할 수 있는 버튼이 제공되어 완전한 사용자 맞춤 설정이 가능합니다. 수동 조작을 선호하는 사용자들을 위해 무료 버전도 계속 제공되며, 완전한 기능을 갖추고 있습니다. 트레이더는 자신의 거래 스타일에 맞춰 수동 또는 자동 도구를 선택할 수 있습니다. 가장 논리적인 인디케이터 중 하나. 높은 신뢰성. FIFTY 인디케이터는 이제 자동화된 버전으로 제공되어 수동으로 레벨을 그릴 필요가 없습니다. 이 버전은 일간, 주간, 월간 및 연간 레벨을 자동으로 차트에 표시하여 정확성을 보장하고 시간을 절약합니다. 또한, 이러한 레벨의 표시 여부를 전환할 수 있는 버튼이 제공되어 완전한 사용자 맞춤 설정이 가능합니다. 수동 조작을 선호하는 사용자들을 위해 무료 버
Naturu MT4
Ivan Stefanov
“Naturu”는 자연의 대칭성을 알고리즘으로 활용하는 수동 인디케이터입니다. 간단한 전략과 숨겨진 지혜로 시장을 제패하세요! 인디케이터를 로드하면 위(Top)와 아래(Bottom) 두 개의 라인이 표시됩니다. 라인을 한 번 클릭해 활성화한 후, 이동하고 싶은 캔들 위를 클릭하면 그 위치로 이동합니다. 사용자가 고점과 저점을 지정하면, 인디케이터가 자동으로 계산합니다: 마젠타 색 영역: 상승(불) 세력과 하락(곰) 세력의 관심이 가장 가까워져서 지지/저항이 될 가능성이 큰 구간 회색 영역: 다음 관심 구간 아쿠아 색 실선: 상승 세력의 목표가 골드 색 실선: 하락 세력의 목표가 수동 인디케이터는 실시간 시장 상황과 개인의 직관에 따라 레벨을 자유롭게 조정할 수 있는 완전한 제어력과 유연성을 제공합니다. 직접 가격 움직임을 분석함으로써 지지·저항과 패턴 형성을 본질적으로 이해할 수 있습니다. 인간의 판단을 통해 자동 시스템이 놓치거나 오해하기 쉬운 ‘노이즈’를 걸러내어 잘못된 신호를
Horizont
Ivan Stefanov
Horizont는 진입 지점, 목표 1, 목표 2, 손절가를 포함한 완전한 트레이딩 세트업을 제공하는 트레이딩 시스템입니다. 모든 값은 자동으로 계산됩니다. 시스템은 시장의 고점과 저점을 자동으로 감지하고 이를 연결하여 현재 추세를 정의합니다. 사용자는 거래할 추세를 선택하며, Horizont는 이에 따른 진입, 목표 및 손절 수준을 생성합니다. 시스템에는 자동 리스크 관리 기능이 포함되어 있습니다. 계좌 잔액을 확인하고 리스크를 계산한 뒤, 적절한 포지션 크기를 제안합니다. 리스크 대비 보상 비율(R:R)은 첫 번째 목표에 대해서만 표시됩니다. 모든 계산은 즉시 수행됩니다. 다른 기회를 탐색하고 싶다면 통화 패널을 클릭하여 종목을 전환하고 더 나은 R:R 비율을 찾을 수 있습니다. 이 시스템은 주로 외환(Forex)에 초점을 맞추고 있지만, 금속, 지수, 암호화폐 거래도 지원합니다(현재 베타 단계로, 모든 브로커에서 지원되지 않을 수 있습니다). 시스템은 각 세트업에 대해 등급이
Enigmera MT5
Ivan Stefanov
3.67 (3)
ENIGMERA: 시장의 핵심 (이 지표는 수동형 인디케이터이며, 현재 MetaTrader 테스트 환경에서 일부 기능이 지원되지 않을 수 있습니다) 소개 이 인디케이터와 트레이딩 시스템은 금융시장을 다루는 독창적인 접근 방식을 제시합니다. ENIGMERA는 프랙탈 사이클을 이용하여 지지선과 저항선을 정밀하게 계산합니다. 실제 매집 구간을 표시하며, 시장의 방향성과 목표를 제시합니다. 추세장이든 조정장이든 관계없이 작동하는 시스템입니다. 작동 방식 대부분의 기능은 차트 왼쪽에 있는 버튼을 통해 제어되며, 다양한 시장 상황에 빠르게 대응할 수 있습니다. 버튼 설명 ON/OFF – 전체 인디케이터를 표시하거나 숨깁니다. Support – 주요 추세 지지선입니다. Ch – 지지 채널을 활성화하여 허용 가능한 편차 범위를 표시합니다. Dev1 (1차 편차) – 지지선 내 가격 움직임을 표시하며, 시장의 조정 또는 에너지 축적을 시사합니다. Dev2 (2차 편차) – 편차 사이의 가격 움직임을
Transaction Speed MT5
Ivan Stefanov
5 (2)
이 지표는 시장에서 관심이 나타나는 영역 을 강조 표시한 후, 주문이 누적되는 영역 을 보여줍니다. 이는 **대규모 오더북(호가창)**처럼 작동합니다. 이것은 거대한 자금 을 위한 인디케이터입니다. 성능은 탁월하며, 시장에서 어떤 관심이 있든 반드시 포착할 수 있습니다 . (이것은 완전히 새로 작성되고 자동화된 버전 입니다 – 이제 수동 분석은 필요하지 않습니다.) **거래 속도(Transaction Speed)**는 새로운 개념의 인디케이터로, 시장에 대규모 주문이 언제, 어디에 쌓이는지를 보여주며 , 그 이점을 분석합니다. 매우 초기 단계에서 트렌드 전환 을 감지할 수 있습니다. FX 시장에서 흔히 사용하는 "거래량(volume)"은 오해입니다. 실제로는 시간당 가격 변화량 이므로, 올바른 용어는 거래 속도 입니다. 우리가 어떻게 사고하고, 행동하며, 분석하느냐 가 가장 중요합니다. 분석 패러다임의 전환 은 필수적입니다. 이 인디케이터는 외환 시장에서의 볼륨 개념을 논리적으로
Fifty Pro MT5
Ivan Stefanov
가격만을 기준으로 레벨을 계산하는 몇 안 되는 인디케이터 중 하나입니다. 이 인디케이터는 시간 프레임, 추세 또는 시장 사이클의 영향을 받지 않습니다. 지금까지 만들어진 것 중 가장 논리적인 인디케이터 중 하나입니다. FIFTY 인디케이터는 이제 자동화 버전으로 제공되어 수동으로 레벨을 그릴 필요가 없습니다. 이 버전은 일간, 주간, 월간, 연간 레벨을 자동으로 차트에 표시하여 정확성을 높이고 시간을 절약해 줍니다. 또한, 이러한 레벨의 표시 여부를 전환할 수 있는 버튼이 제공되어 완전한 사용자 맞춤 설정이 가능합니다. 수동 방식을 선호하는 분들을 위해 무료 버전도 여전히 제공되며, 완전히 작동합니다. 사용자들은 자신의 트레이딩 스타일에 따라 수동 또는 자동 도구를 선택할 수 있습니다. 매우 신뢰할 수 있으며 강력히 추천드립니다! 수동 버전의 FIFTY 인디케이터를 지금 요청해 보세요!
Speculator MT5
Ivan Stefanov
SPEKULATOR는 주요 지원 영역과 시장 방향을 식별하는 데 도움이 되는 수동 거래 시스템 및 지표입니다. 간단한 전략과 숨겨진 지혜로 시장을 마스터하세요. 차트에서 원하는 최고점(TOP)과 최저점(BOTTOM)을 선택하면 지표는 다음을 그립니다: 당신의 트렌드를 위한 지원 영역. 상승 추세에서는 녹색 영역이, 하락 추세에서는 빨간색 영역이 나타납니다. 지원 영역의 민감도는 지표 설정에서 조정할 수 있습니다. 이 영역은 선택한 추세를 기반으로 지원이 나타날 가능성이 있는 위치를 나타냅니다. 높은 편차선과 낮은 편차선 W.D. Gann의 9의 제곱에 따라 계산된 각도선 거래에 진입할 때: 높은 편차선이 위로 돌파되면 롱 포지션을 취합니다. 낮은 편차선이 아래로 돌파되면 숏 포지션을 취합니다. 시장이 편차선 사이에 있을 경우, 해당 구간 내에서 매수와 매도를 하며 지원 영역을 존중합니다. Gann의 각도선은 이익 실현 구간으로 가이드를 제공합니다. 핵심 수준은 360도 선입니다: 가
Time Zones 50
Ivan Stefanov
Time Zones Fifty 이 지표는 기본적인 문제를 해결합니다. 시간을 어떻게 세야 하는가? 어떤 구역을 사용해야 하는가? 어떻게, 그리고 왜? 이 모든 것은 논리에 기반합니다. 시간대 적용 시간대를 적용하려면 시작점이 필요합니다. 이 시작점은 임의로 선택되는 것이 아니라 논리적으로 정의되어야 합니다. 일부 사람들은 다음과 같은 시점을 시작으로 선택합니다: 한 해의 첫날 한 달의 첫날 분기 또는 주의 시작 그러나 이것은 시장 활동이 매년 같은 날짜에 정확히 반복된다는 것을 의미합니다. 예를 들어, 2025년 3월 12일에 일어난 일이 2026년 3월 12일에도 반복되어야 한다는 것입니다. 분명히 그렇지 않습니다. 사이클은 반복될 수 있지만 반드시 같은 시작점에서 시작되는 것은 아닙니다. 간(Gann) 사이클을 사용할 때도 시작점을 정해야 의미가 있습니다. 그렇다면 시작은 어디일까요? 선택 1 일반적으로 지금은 2025년이라고 받아들여지며, 시작은 서기 0년 1월 1일, 즉 그리
필터:
리뷰 없음
리뷰 답변