Meravith
- Indicatori
- Versione: 5.14
- Aggiornato: 8 giugno 2026
- Attivazioni: 20

Strumento per market maker.
Meravith:
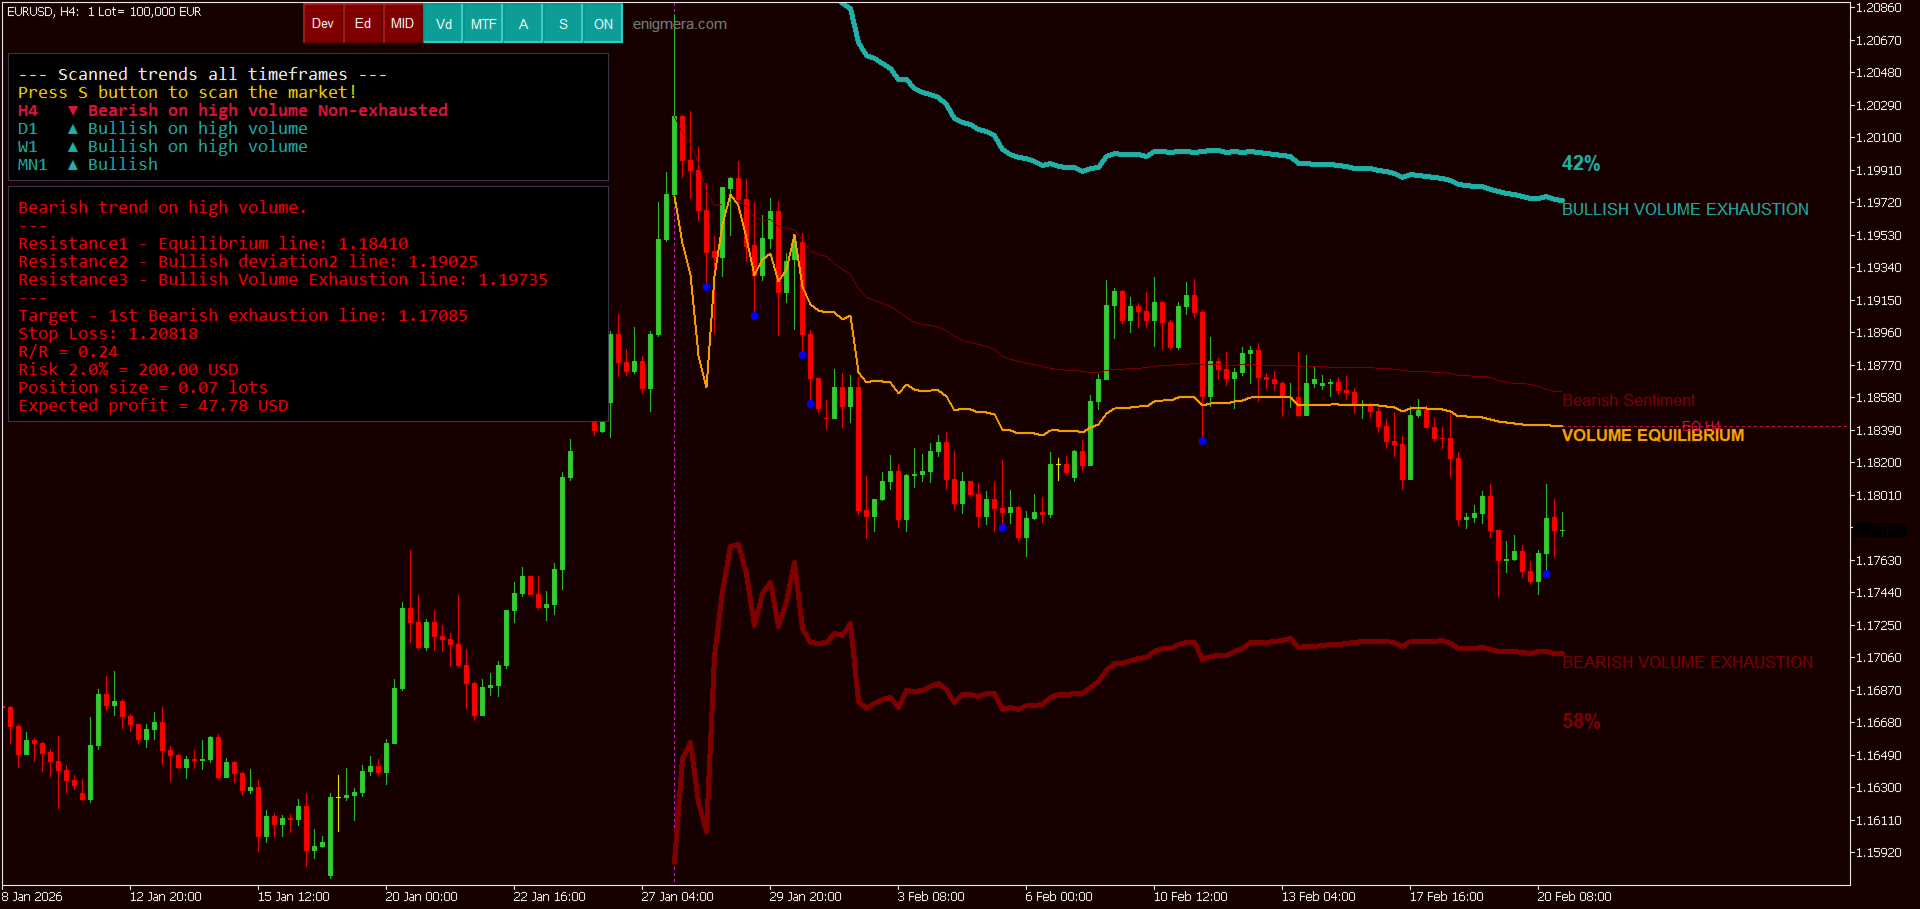
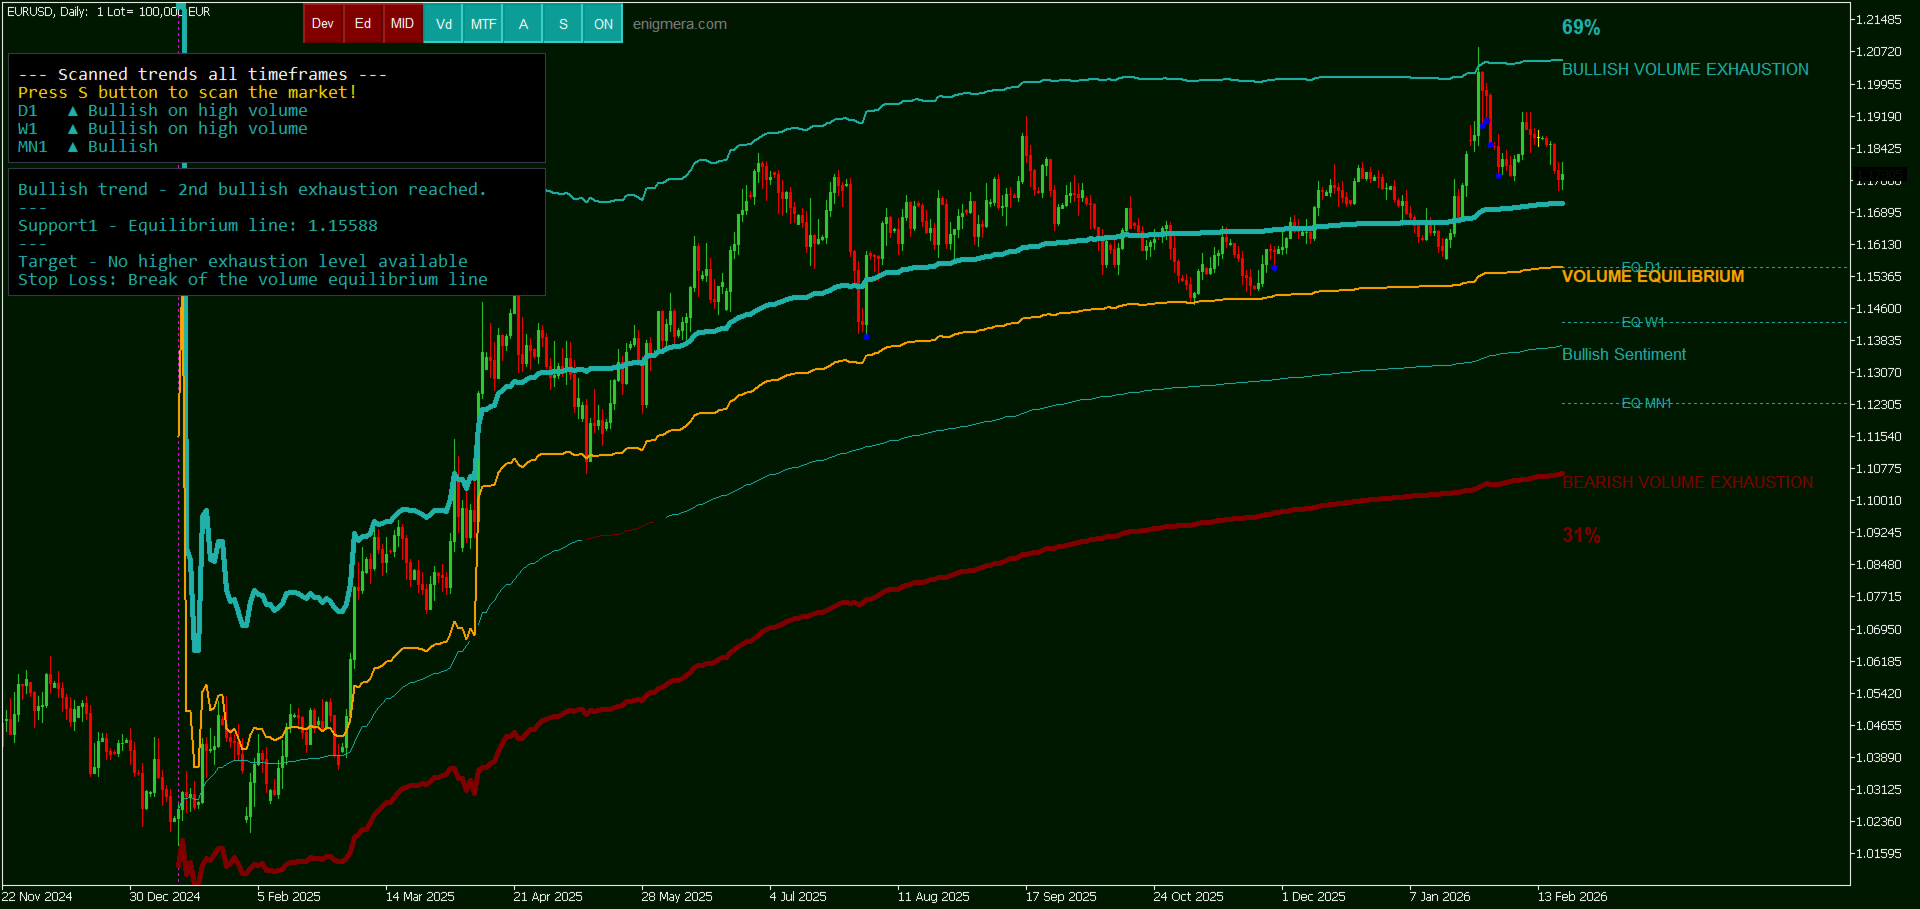
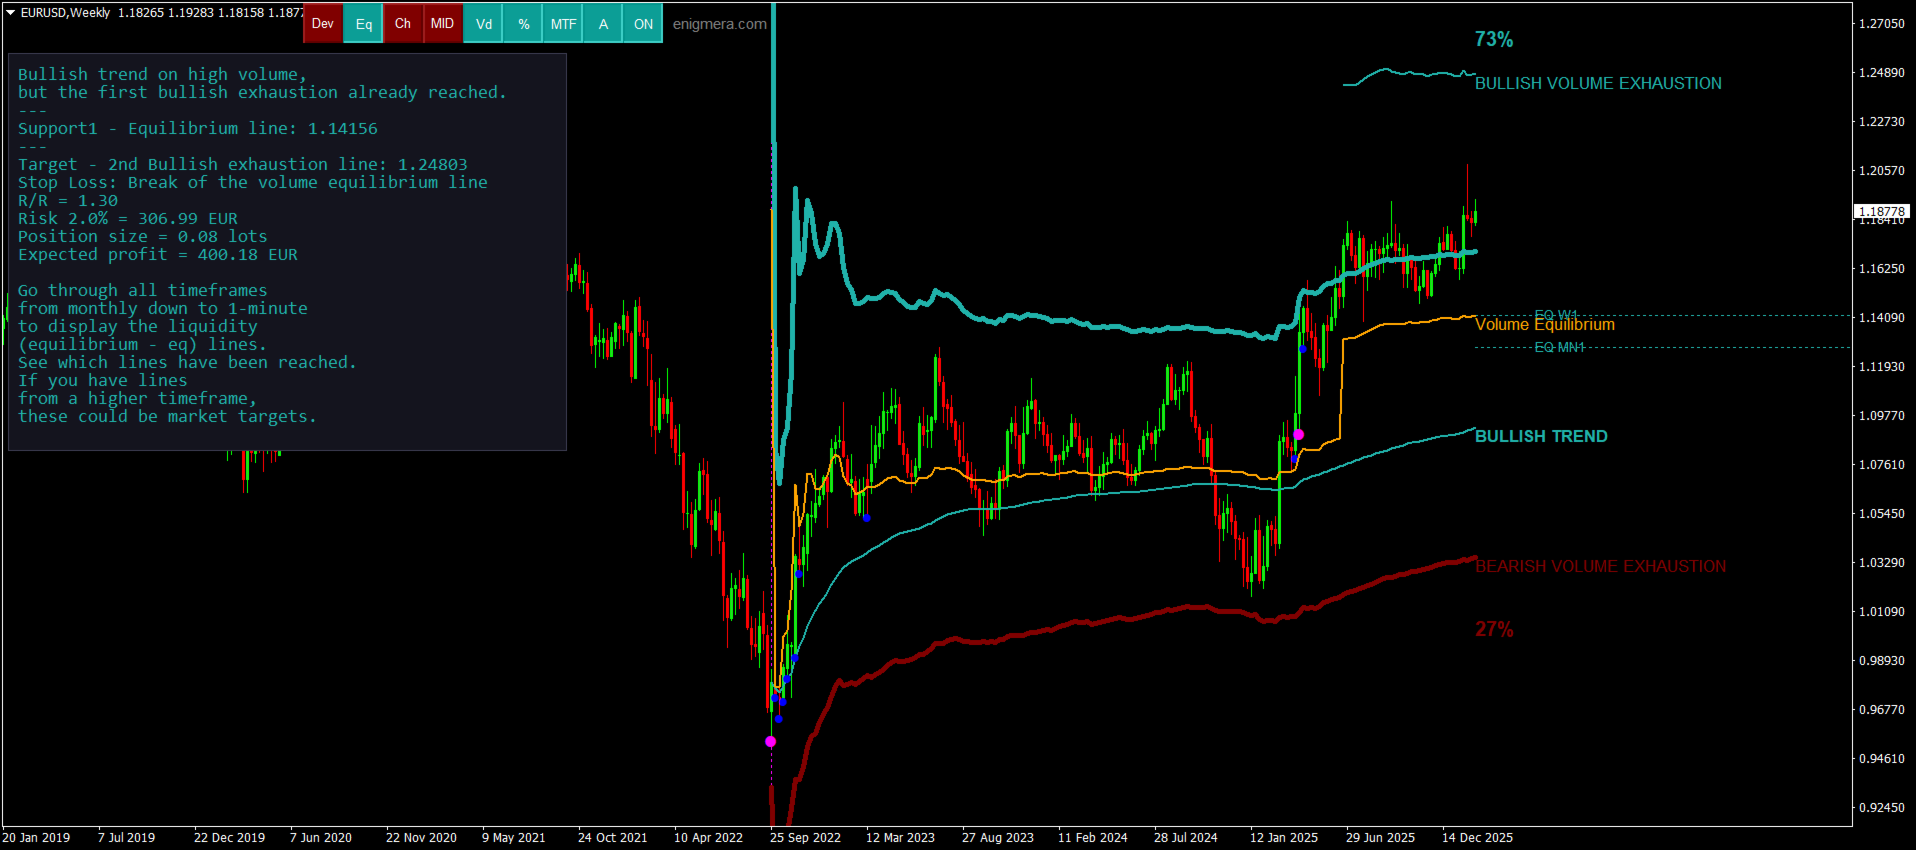
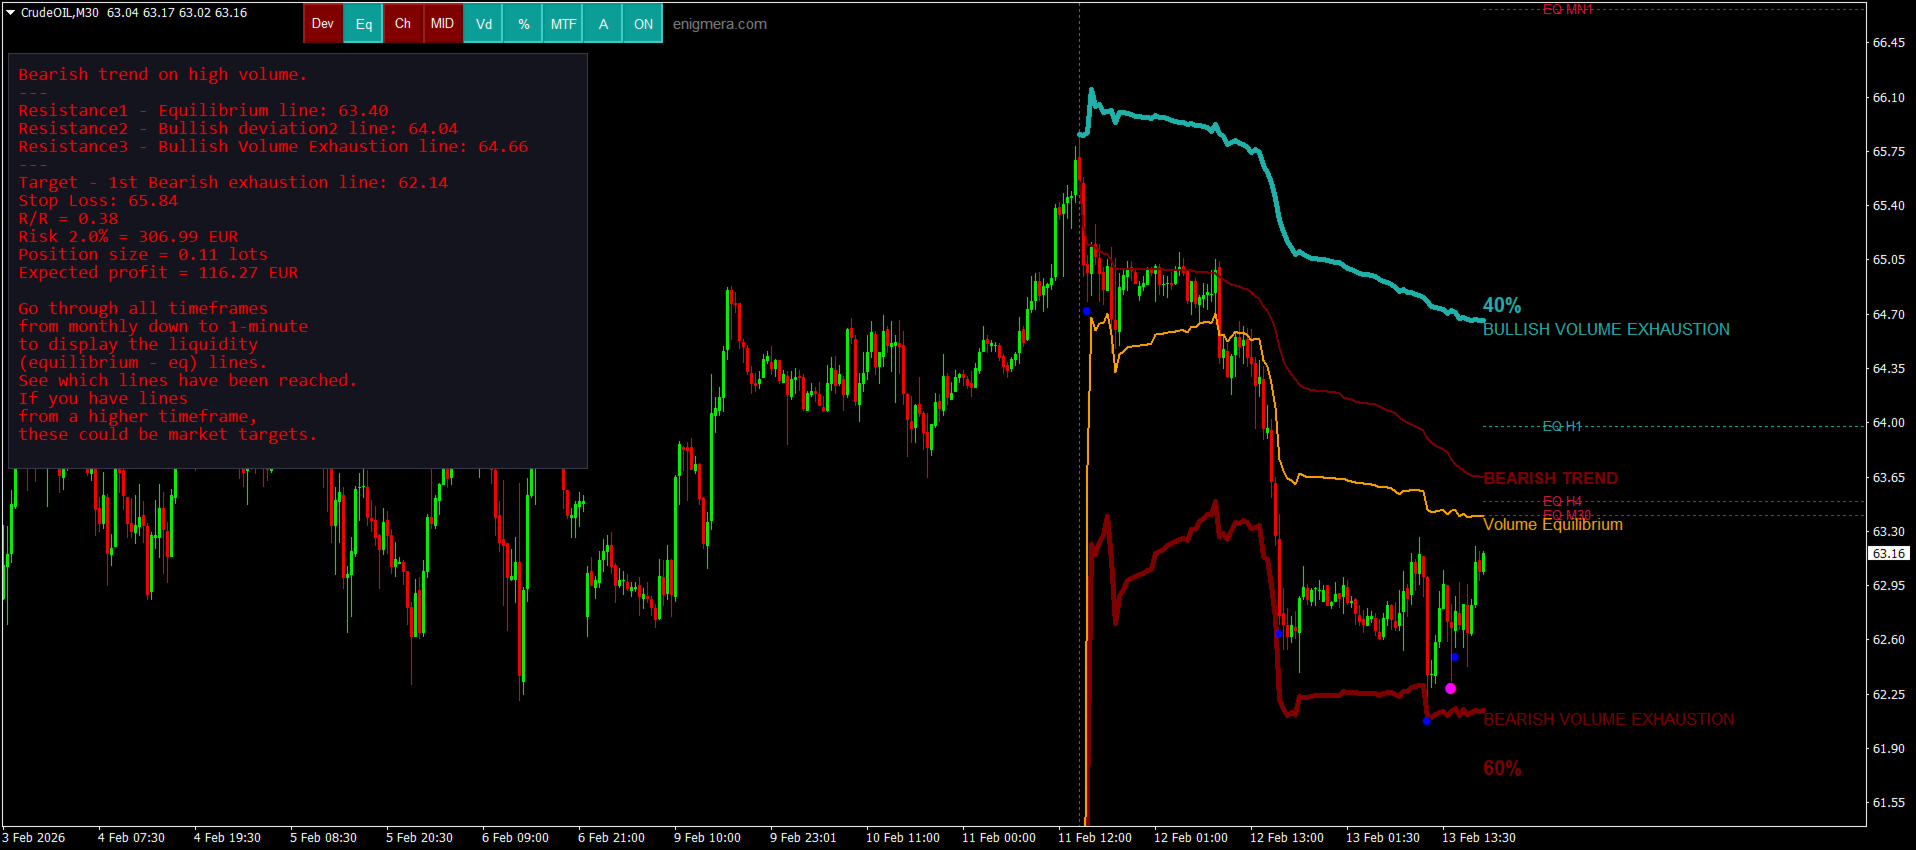
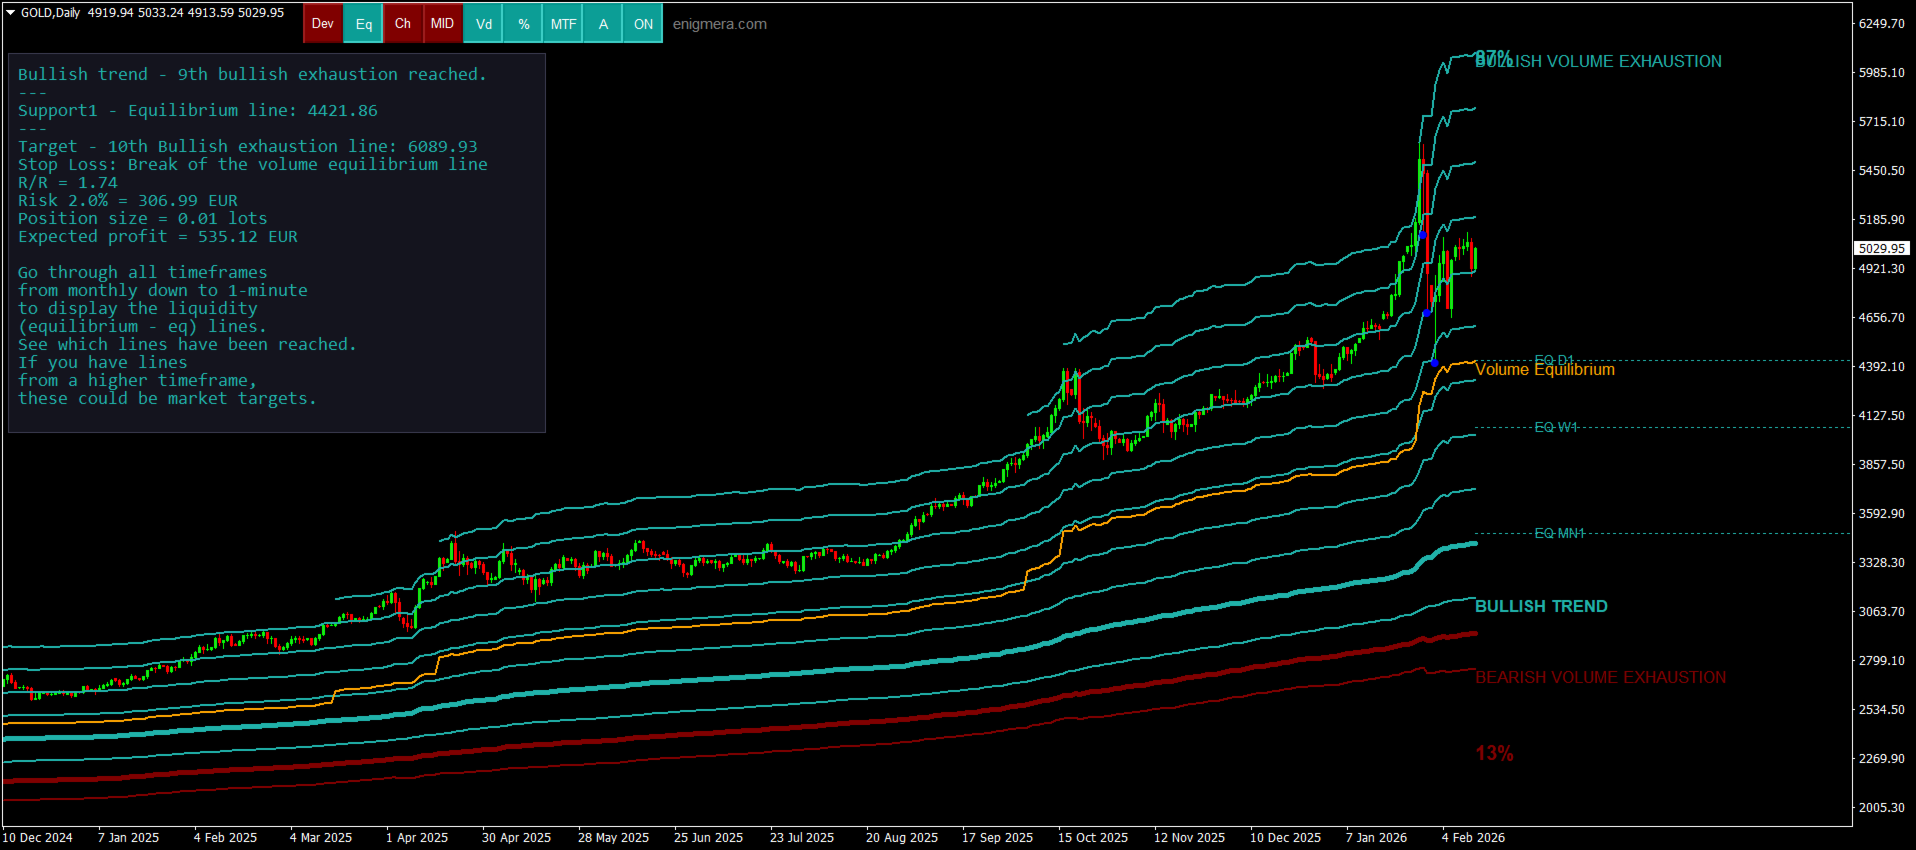
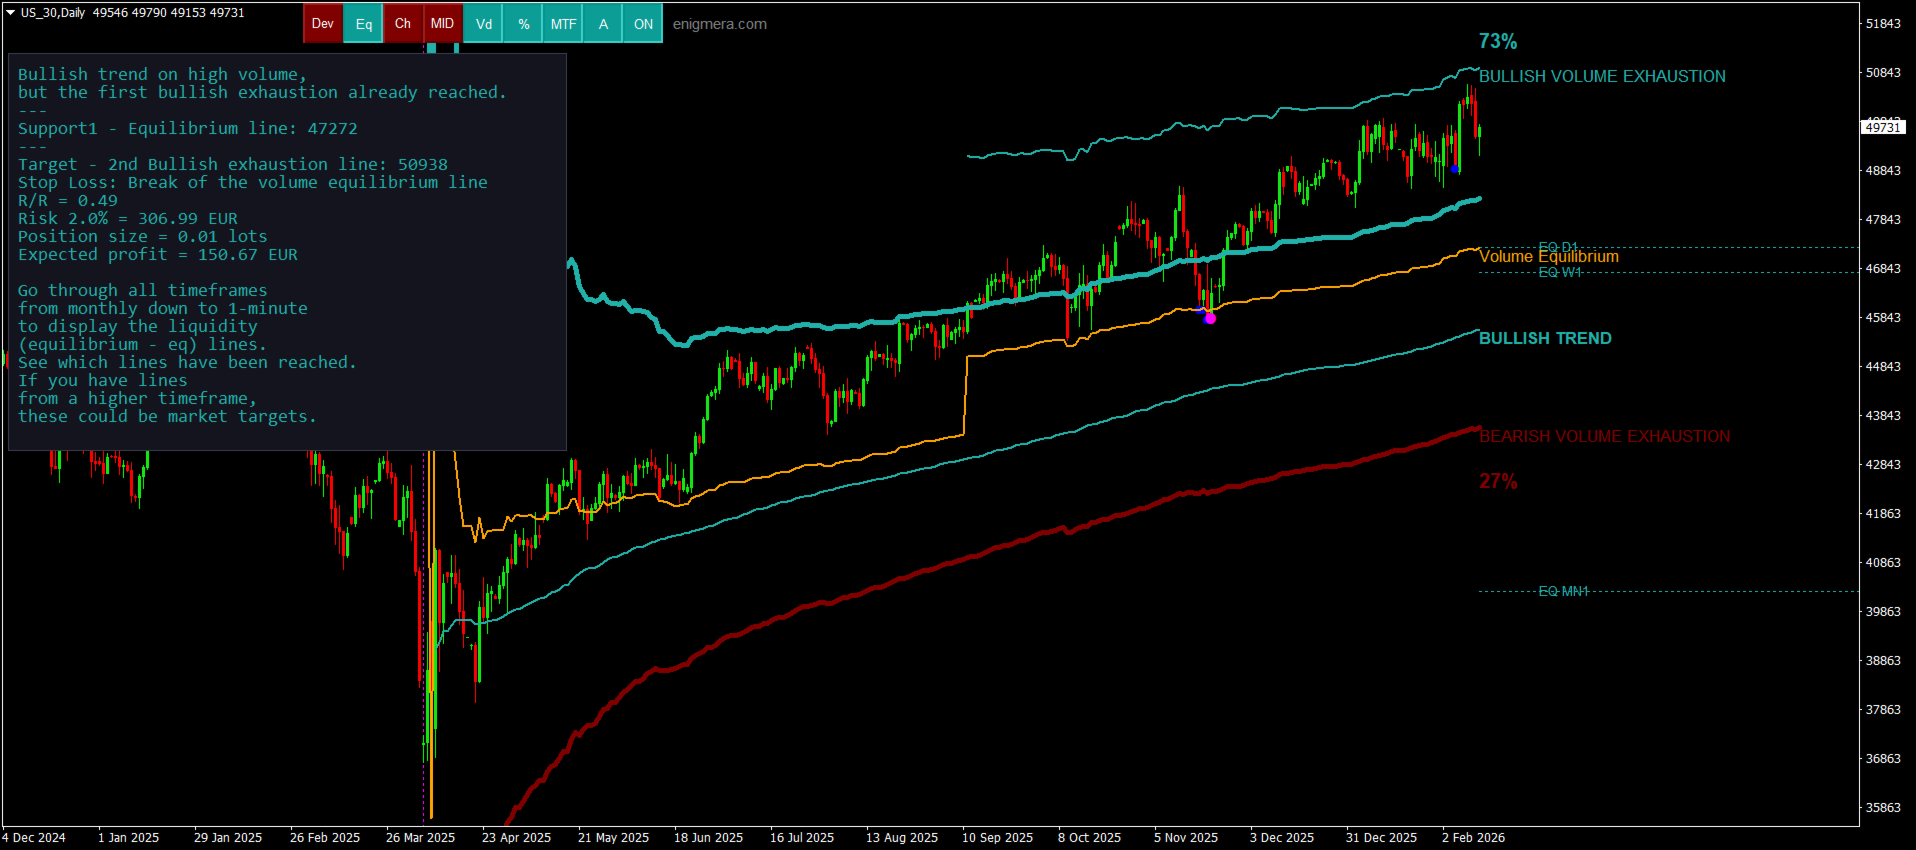
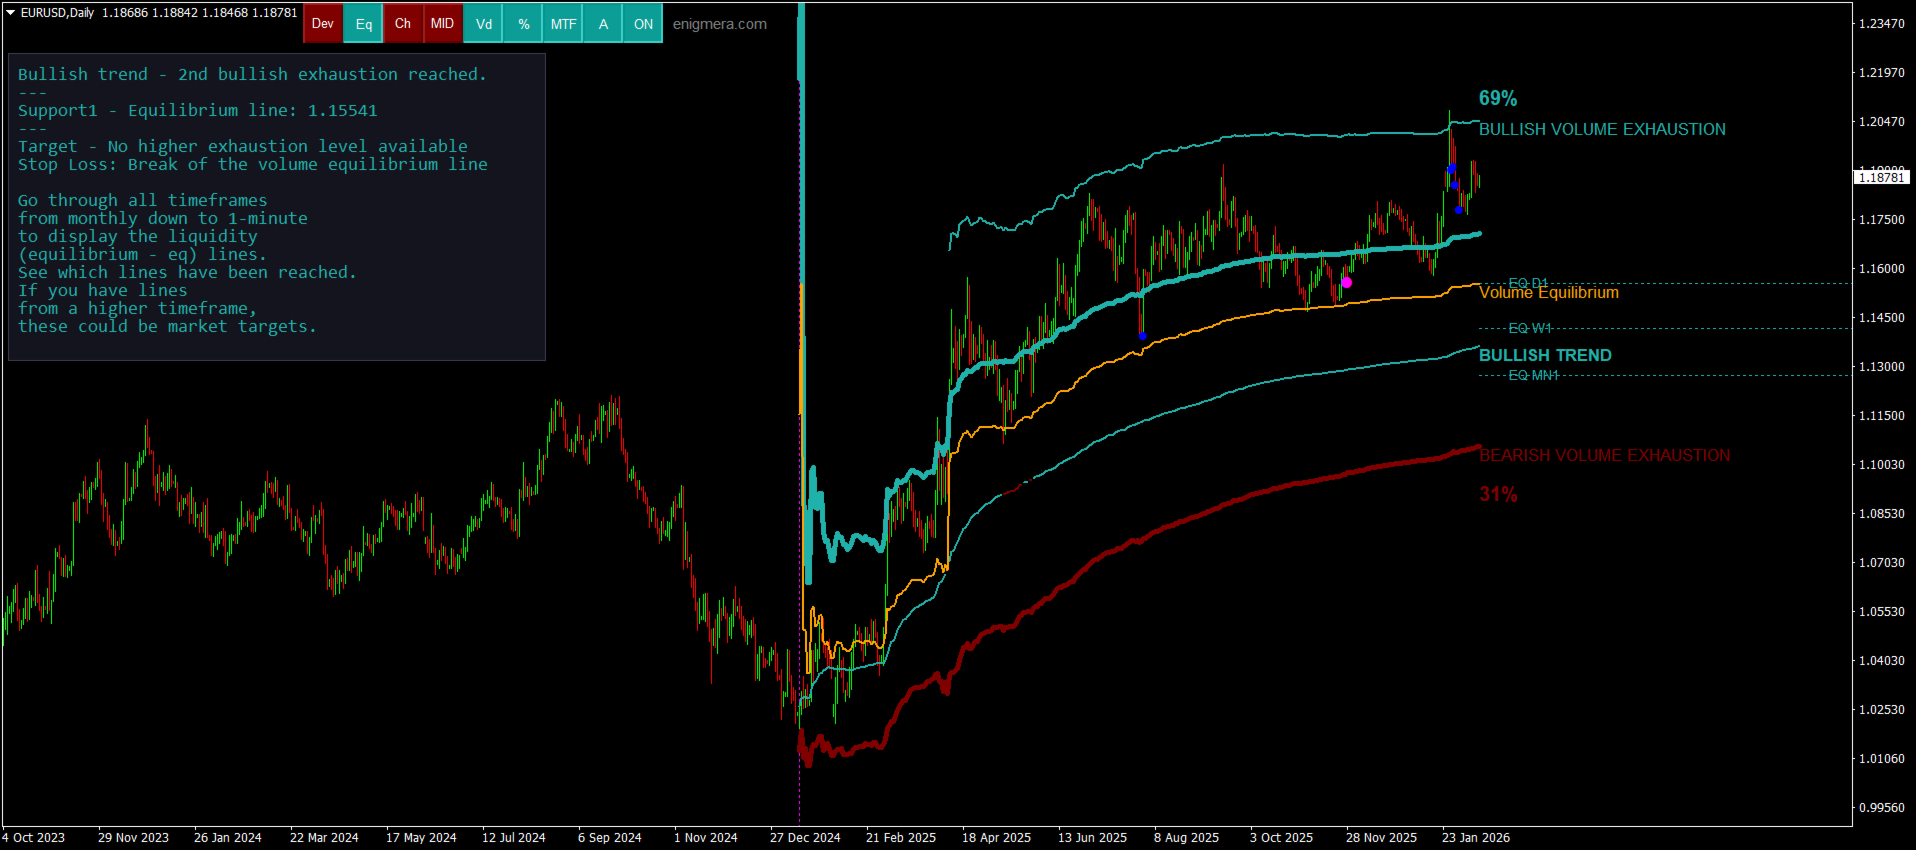
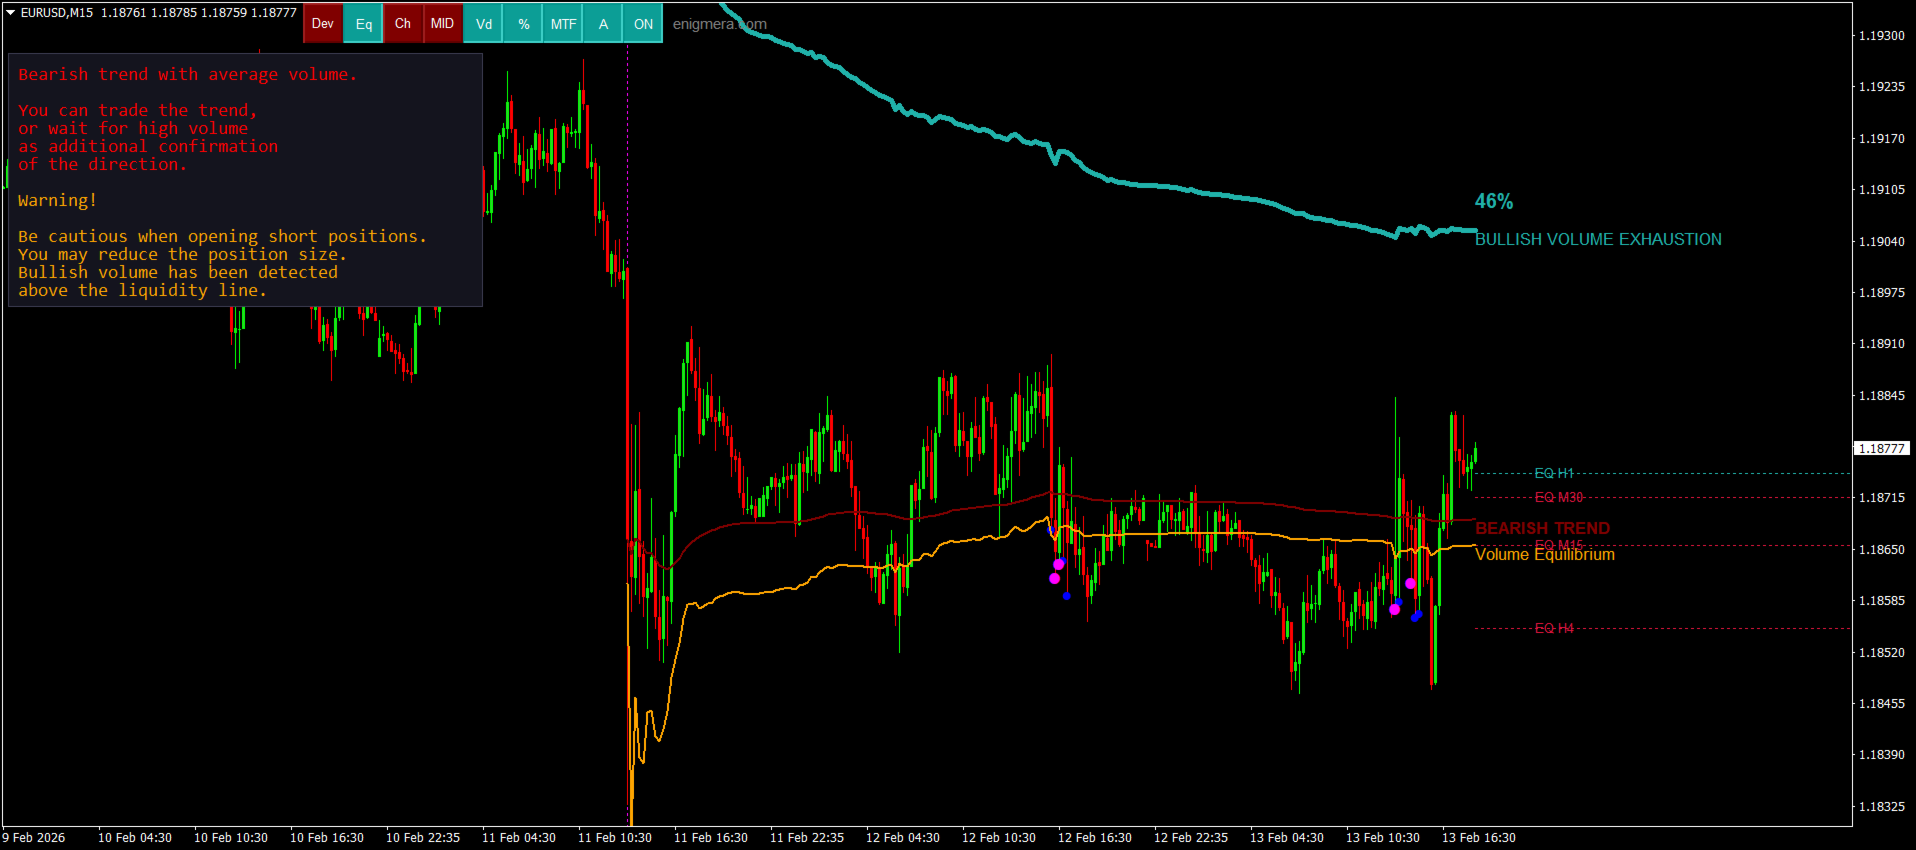
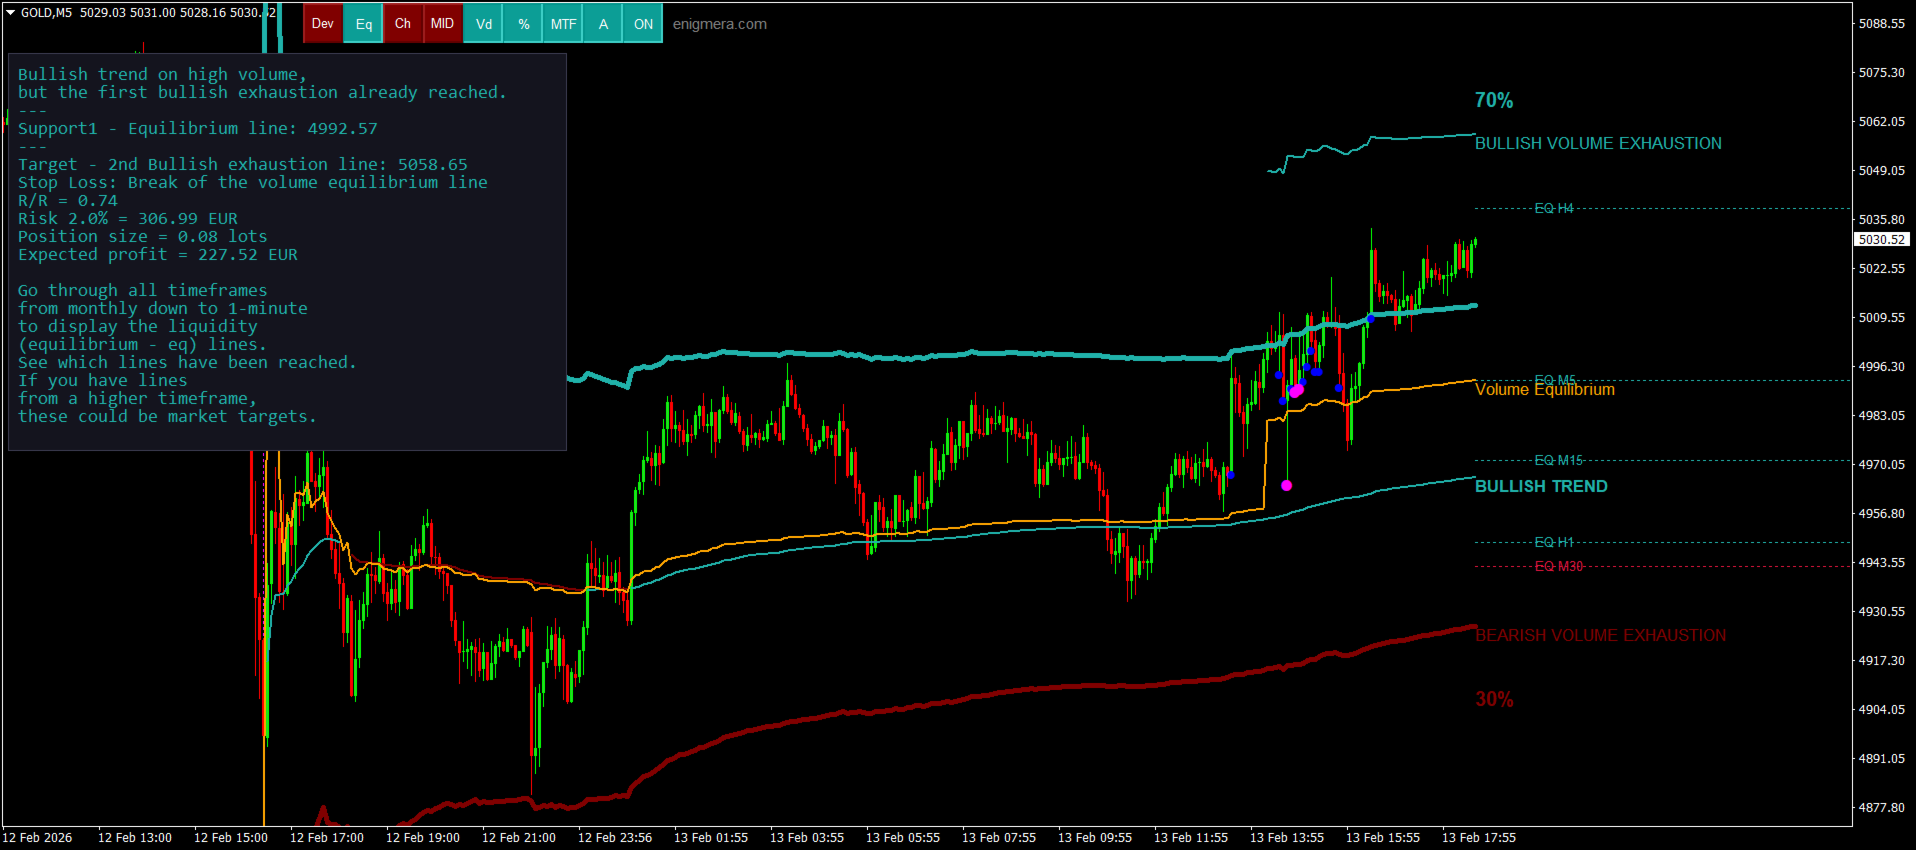
Analizzerà tutti i timeframe e mostrerà il trend attualmente in corso.
Evidenzierà le zone di liquidità (equilibrio dei volumi) dove i volumi rialzisti e ribassisti sono uguali.
Mostrerà tutti i livelli di liquidità dei diversi timeframe direttamente sul grafico.
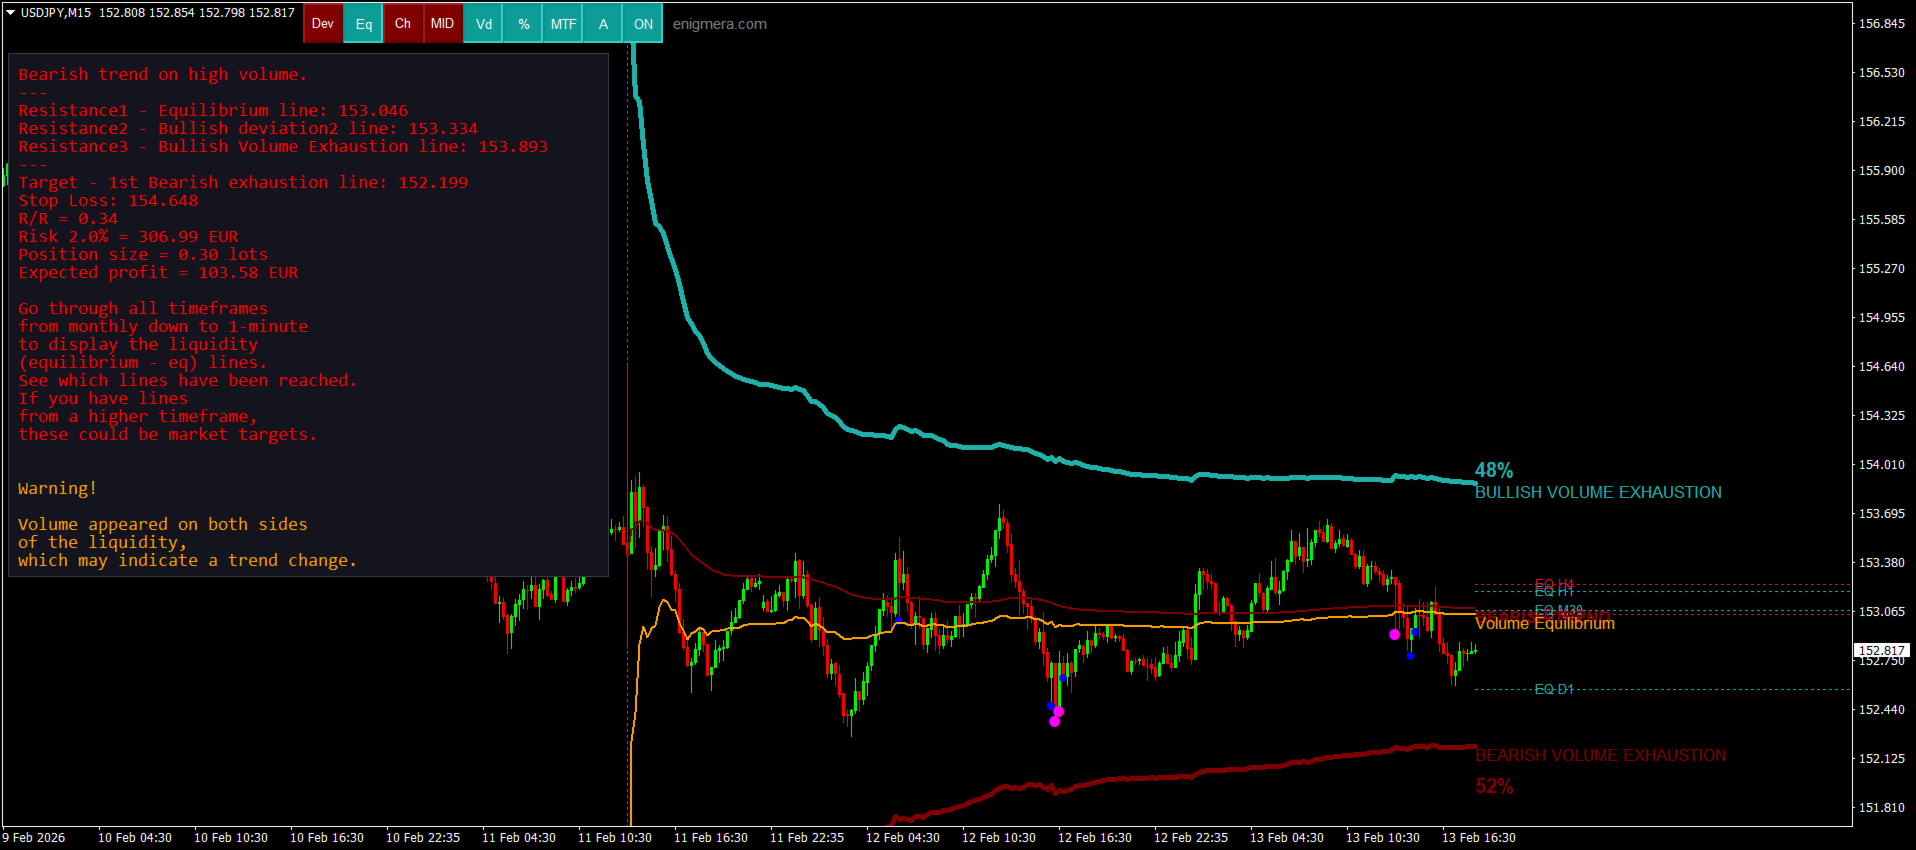
Genererà e presenterà un’analisi di mercato testuale a scopo di riferimento.
Calcolerà obiettivi, livelli di supporto e punti di stop-loss in base al trend attuale.
Calcolerà il rapporto rischio/rendimento delle tue operazioni.
Determinerà la dimensione della posizione in base al saldo del tuo conto e stimerà il profitto potenziale.
Meravith fornirà anche avvisi in caso di cambiamenti significativi sul mercato.
Linee principali dell’indicatore:
Linee di esaurimento del volume rialzista/ribassista — servono come obiettivi.
Linea che indica il trend di mercato. Cambia colore a seconda che il mercato sia rialzista o ribassista e funge da supporto del trend. Il colore indica principalmente il sentiment del mercato.
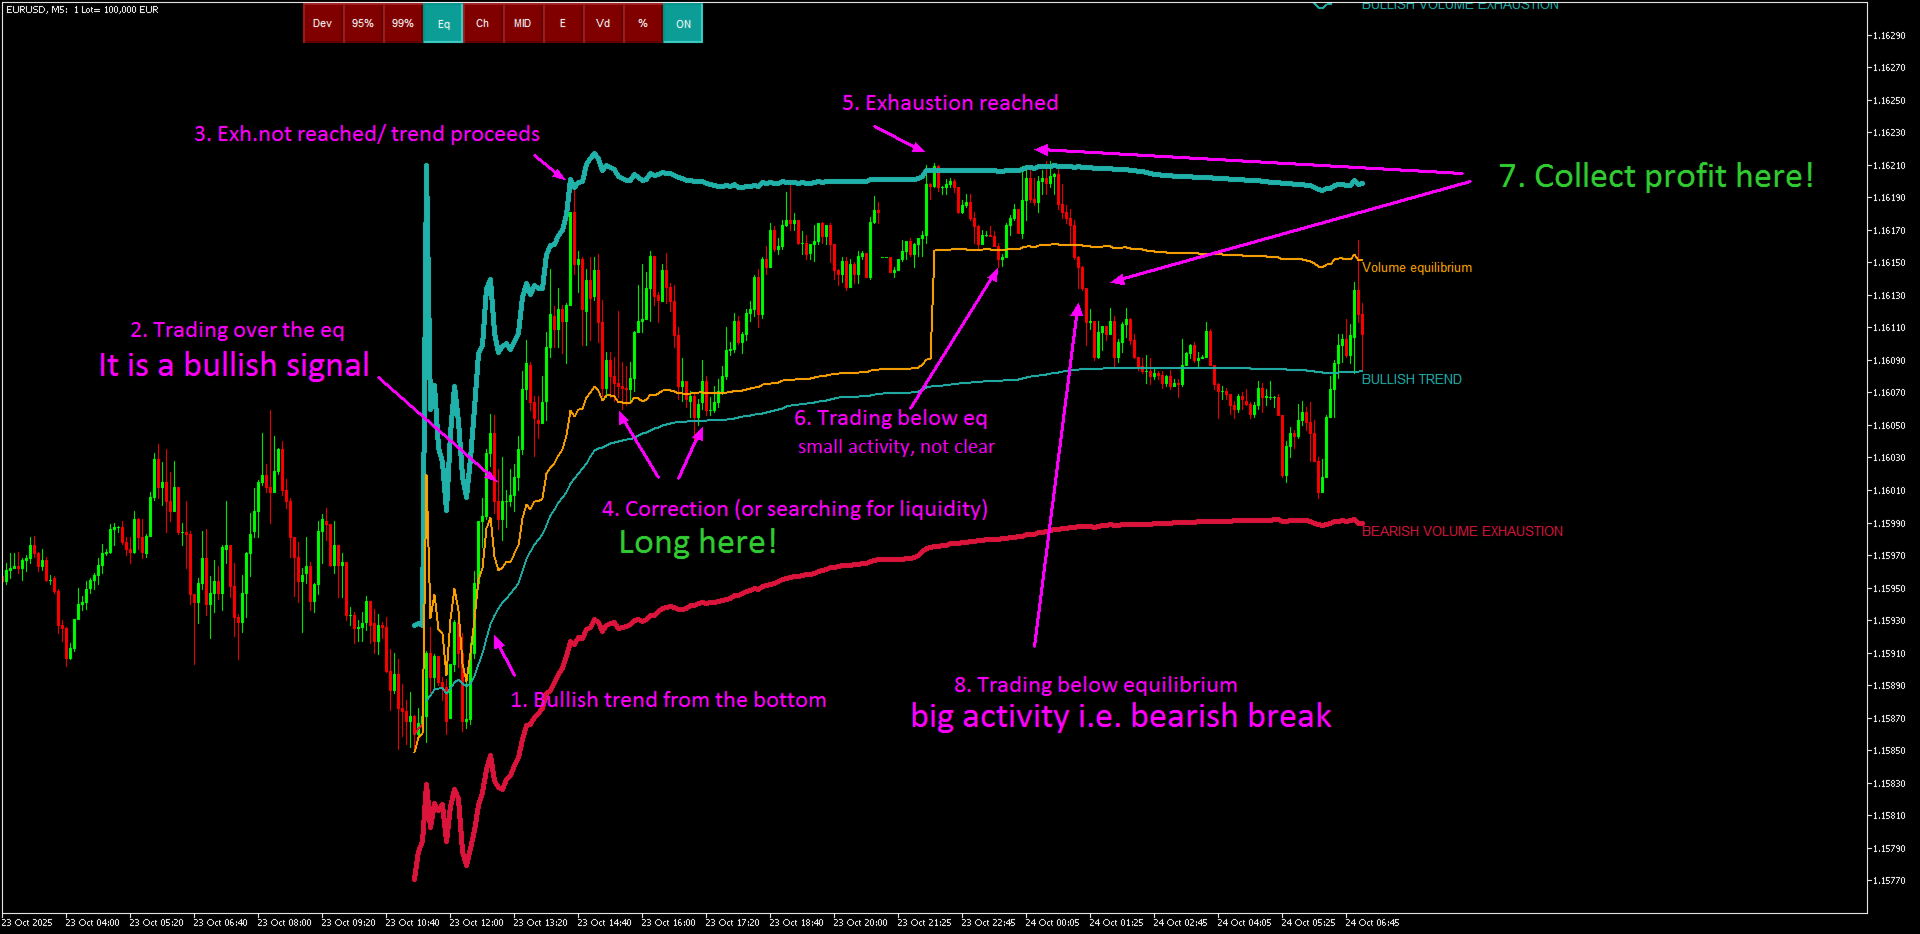
Linea di Equilibrio dei Volumi (Eq). La linea Eq (Volume Equilibrium) è il cuore del sistema. Rappresenta il punto di equilibrio dei volumi tra compratori e venditori. È la liquidità del mercato. Una rottura al di sopra di Eq segnala un bias rialzista, una rottura al di sotto di Eq segnala un bias ribassista. Dopo la rottura, attendere una correzione — quando il prezzo torna verso una delle deviazioni o linee di esaurimento del trend opposto.
Come usarlo: basta inserirlo sul grafico.
Meravith analizza tutto — trend e correzioni.
Maggiore è la distanza tra la linea del trend e una delle linee di esaurimento del volume, maggiore è il volume in quella direzione.
La linea del trend può essere usata come punto di apertura degli ordini, mentre le linee di esaurimento servono per prendere profitto.
Meravith include pulsanti direttamente sul grafico, rendendo il lavoro molto più semplice e veloce — tutte le funzionalità principali possono essere attivate o disattivate direttamente dal grafico. Ecco cosa fa ciascun pulsante:
DEV – Mostra una doppia deviazione dalla linea di supporto, che può fungere da livello di supporto aggiuntivo se il trend ha un alto volume interno.
Eq – Linea di equilibrio dei volumi. Questa è la linea di liquidità del mercato. Il volume rialzista è uguale a quello ribassista.
CH – Mostra il canale di supporto completo per una migliore visualizzazione della struttura.
MID – Segna il punto medio (50%) dell’intero movimento, insieme ai livelli 0% e 100%.
Vd – Evidenzia le candele con deviazioni di volume insolitamente elevate rispetto alla media.
% – Confronta i canali rialzista e ribassista in percentuale (%).
MFT – Premere questo pulsante (Multi Time Frame) e scorrere tutti i timeframe. L’indicatore calcolerà automaticamente tutti i livelli di liquidità e li mostrerà sul timeframe selezionato. Ogni timeframe mostra il proprio livello di liquidità e i livelli dei timeframe superiori. I livelli dei timeframe inferiori non vengono mostrati. Il pulsante permette di mostrare o nascondere questi livelli.
A – Analysis. Questo pulsante mostra o nasconde l’analisi testuale che l’indicatore genera sul mercato.
ON / OFF – Attiva o disattiva completamente l’indicatore.
Disponibile per MT4, MT5 e TradingView.
Raccomandazioni:
Coppie di valute: Tutte le coppie, tutti i mercati
Timeframe: Tutti i timeframe
Deposito minimo: Nessun deposito minimo
Tipo di conto: Nessuna limitazione
Broker: Nessuna limitazione
Prima di acquistare:
Testare prima nel tester di MetaTrader. Se hai domande, puoi inviarmi un messaggio tramite il mio profilo MQL5.
Supporto completo e materiali bonus disponibili dopo l’acquisto.


A deep understanding of forex, the philosophy of forex and life, translated into an understandable, easily applicable, profitable, and underpriced Meravith indicator (in fact, a complete system). On top of that, you get a dedicated, friendly, knowledgeable, and always available author ready to help.