Smart Market structure concept MT4 version
- Indicators
-
Minh Truong Pham
 Hello, my name is Pham and I am a programmer and trader! At here, I create amazing forex indicators and expert advisors for Metatrader.
I will try:
+ Provide best tools base on my 5 years experience as a trader and 10 years as a programmer. - Version: 4.7
- Updated: 3 April 2023
- Activations: 5
All about Smart Money Concepts Strategy: Market struture: internal or swing BOS, CHoCH; Orderblock; Liquity equal; Fair Value Gap with Consequent encroachment, Balanced price range; Level with Previous month, week, day level or in day level (PMH, PWH, PDH, HOD); BuySell Stops Liquidity (BSL, SSL); Liquidity Void Long Wicks; Premium and Discount; Candle pattern ...
"Smart Money Concepts" ( SMC ) is a fairly new yet widely used term amongst price action traders looking to more accurately navigate liquidity & find more optimal points of interest in the market. Trying to determine where institutional market participants have orders placed (buy or sell side liquidity) can be a very reasonable approach to finding more practical entries & exits based on price action. The indicator includes alerts for the presence of swing structures and many other relevant conditions. User can choose notification method include: MT terminal, MT mobile app, Telegram channel.
Update version 4.0 by add more function and perfomace increase.
New version SMC_3 is released with enhanced performance; smart OB scan, add volume of 1st, 2nd candle in OB; Alert when price inside previous OB, swing S/R level or internal S/R level
*** For customer who already puchased this indicator, I upgrade to version 2.0 because of adding new feature include:
• Add Order block. Setting for display in default is false.
• Add Fair value gap. Setting for display in default is false.
Settings:
//--------Genneral Settings---------
Max bars back for calculate: Bar number should calculate when init indicator. Default is 1000
//--------Internal Structure---------
Internal Break of structure will show as horizontal dotted line from HH (or LL) point to breakout point. There are some config of iBOS as follow:
+Show Internal BOS: Config to show internal BOS (iBOS) or not
+Show Internal BOS text: Config to show text of iBOS or not
+Internal BOS bearish color: Config color of brearish iBOS color
+Internal BOS bullish color: Config color of bullish iBOS color
+Internal BOS font size: Config text "iBOS" size (color as line color)
+Alert when Internal BOS found: Config notificate when iBOS found
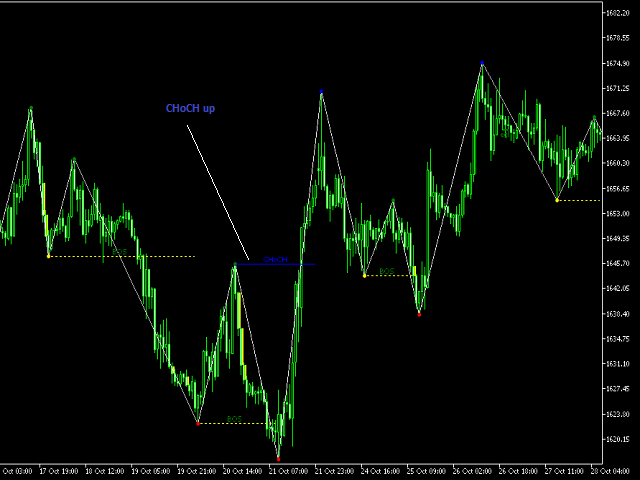
Internal Change of character (iCHoCH) will show as horizontal dotted line from HL (or LH) point to breakout point. There are some config of iCHoCH as follow:
+Show Internal CHoCH
+Show Internal CHoCH text
+Internal CHoCH bearish color
+Internal CHoCH bullish color
+Internal CHoCH font size
+Alert when Internal CHoCh found
//--------Swing Structure---------
Swing Break of structure will show as horizontal dotted line from HH (or LL) point to breakout point. Swing mode will longer than Internal mode. It depend on pivot point length (can config at pivot point config section). There are some config of sBOS as follow:
+Show Swing BOS
+Show Swing BOS text
+Swing BOS bearish color
+Swing BOS bullish color
+Swing BOS font size
+Alert when Swing BOS found
Swing Change of character (iCHoCH) will show as horizontal dotted line from HL (or LH) point to breakout point. There are some config of sCHoCH as follow:
+Show Swing CHoCH
+Show Swing CHoCH text
+Swing CHoCH bearish color
+Swing CHoCH bullish color
+Swing CHoCH font size
+Alert when Swing CHoCh found
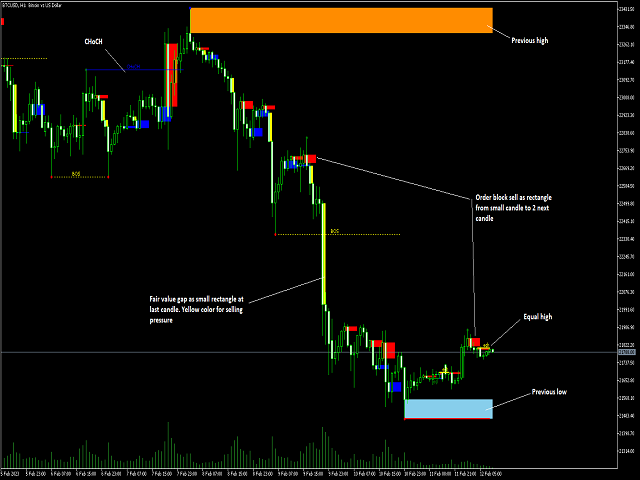
//--------Order block---------
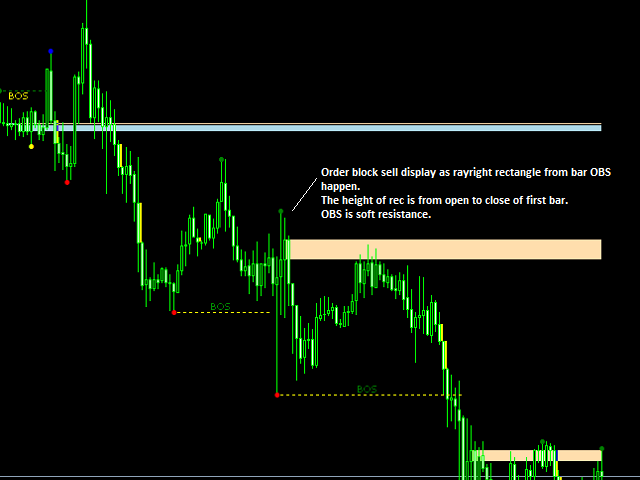
Order block is to composite candle. This indicator support 3 type of OB as follow:
+ Ob should close after BOS, CHoCH (1)
+ Ob should close before BOS, CHoCH (2)
+ Ob should close after Pivot point (3)
+ None above (4)
For (1),(2),(3): The "Distance from pivot BOS, CHoCH to OB" config will determine the maximum distance between OB and confirm condition point
Other config are:
+Show Internal Order block (iOB)
+OB type
+OB buy have to close valley, sell have to close peak: if OB type in (1),(2),(3) and this option = true, valid OB buy have to close to valley, valid OB sell have to close to peak
+Number of iOB to display on chart: limit the number of OBs displayed on the chart
+iOB up color
+iOB down color
+iOB font size
+Alert when Order Blocks appear
+Alert when after price inside ob: when turn on, iOB appear affter price go inside iOB, indicator will notificate.
--------Equal High,Low---------
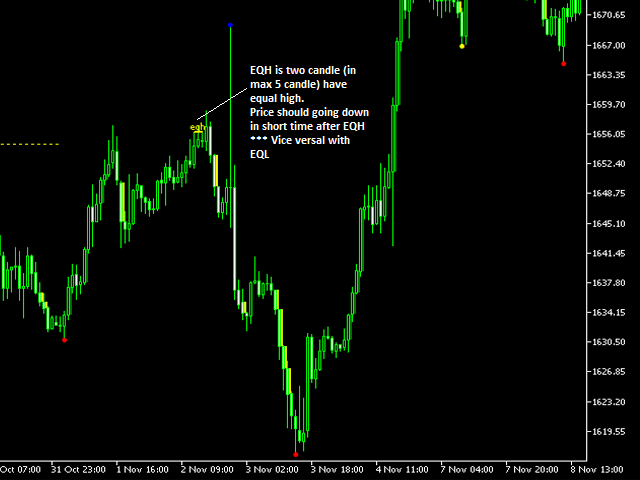
Equal high or low is 2 close candle have equal high or low. This will display on chart as solid line connect to equal point. There are some config as follow:
+Show EQ or not
+Bar Confirmation Length (min value 1): limit the maximum distance of 2 equal candles
+Equal font size
+Equal high font color
+Equal low font color
+Alert when equal high or low
//--------Fair Value Gap---------
Fair Value Gaps are created within a three-candle sequence and are commonly visualized on the chart as a large candle whose neighboring candles’ upper and lower wicks do not fully overlap the large candle.
The area between neighboring candles’ upper and lower is imbalance area. The indicator will display imbalance area as filled small rectangle close to main candle.
We have a new concept "Balanced price range" - BPR: when FVG created and after that filled, the imbalance area become support or resistance level. This indicator display BPR as rectangle with no fill from imbalance to next 10 bar (config at "Balanced price range length in bar")
Consequent encroachment is when a fair value gap is filled by 50%, this is what is referred to as the mean threshold of fvg. Traders should keep in mind that price might not completely fill the fvg. therefore targeting the mean threshold is ideal not to miss trades.
Some config of FVG are:
+Show Fair value gap
+Color of FairValueGap created due to large buying pressure
+Color of FairValueGap created due to large selling pressure
+Show Consequent encroachment: indicator will show consequent encroachment as small line inside imbalance area at level=50%
+Consequent encroachment line color
+Show Balanced price range
+Max bar BPR should fill gap: max distance imbalance should be filled
+Balanced price range length in bar: BPR rectangle length
+Balanced price range length color
+Alert when Fair Value Gap Detection
+Alert when BPR detection
//--------Swing, internal high, low---------
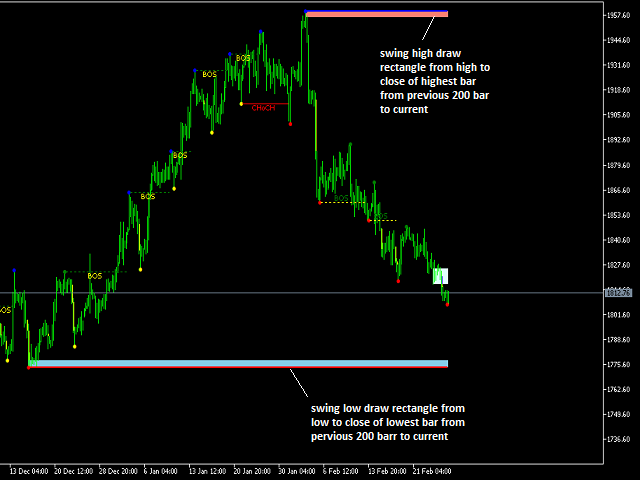
The swing, internal high or low level should display as rectangle with no fill and extend to right edge of chart. For ease of viewing, the chart should be set to mode "Shift end of chart from right border". Inside the rectangle have some note about time, and price.
The config are:
+Swing Maxbar: this is number of bar from current that find highest or lowest level for swing period.
+Internal Maxbar: this is number of bar from current that find highest or lowest level for internal period.
+Show Previous Highs & Lows
+Alert if Highs & Lows appear
+Alert if price inside Previous Highs & Lows: when turn on, Level appear affter price go inside level, indicator will notificate.
+Swing support color
+Swing resistance color
+Internal support color
+Internal resistance color
//--------Level: PMH, PWH, PML, PWL...---------
This indicator show many type of level on chart:
-PMH, PML: Previous month high, low
-PWH, PML: Previous week high, low
-PDH, PDL: Previous day high, low
-HOD, HOL: High, low of day
There are some config as follow:
+Show Previous Month High, Low
+Previous Month High color
+Previous Month Low color
+Alert when price breakout Previous Month
//---
+Show Previous Week High, Low
+Previous Week High color
+Previous Week Low color
+Alert when price breakout Previous Week
//---
+Show Previous Day High, Low
+Previous Day High color
+Previous Day Low color
+Alert when price breakout Previous Day
//---
+Show High Of Day, Low of Day
+High Of Day color
+Low Of Day color
+Alert when price breakout High, low of day
//--------BuySell Stops Liquidity (BSL, SSL)
BuySell Stops Liquidity can be understood simply as the situation false to breakout. This is when price go higher than resistance and quickly go down to lower than resistance (opposite with support).
This indicator
+ Level is PMH, PML, PWH, PML, PDH, PDL, HOD, HOL (type1)
+ Level is pivot point: when pivot_5 = pivot_3 and pivot_1>pivot_3 (for resistance), current price < pivot_3 (type2)
//-------- type1---------
+Show BSL for Previous Month High
+Previous Month BSL bar: max distance of false breakout
//--
+Show BSL for Previous Week High
+Previous Week BSL bar
//--
+Show BSL for Previous Day High
+Previous Day BSL bar
//--
+Show BSL for High Of Day
+High Of Day BSL bar
//--
+Alert when BSL appear
+BSL line color
//--
+BSL font size
//--
+Show SSL for Previous Month Low
+Previous Month BSL bar
//--
+Show SSL for Previous Week Low
+Previous Week BSL bar
//--
+Show SSL for Previous Day Low
+Previous Day BSL bar
//--
+Show SSL for High Of Day
+Low Of Day BSL bar
//-- display and alert
+Alert when SSL appear
+SSL line color
+SSL font size
//--------BSL, SSL by pivot point - type2---------
+BSL by pivot point
+BSL Equal level threshold: tolence of pivot_3 and pivot_5
+BSL by pivot point line color
+BSL by pivot point font size
//--
+SSL by pivot point
+SSL Equal level threshold
+SSL by pivot point line color
+SSL by pivot point font size
//--------Liquidity Void--------
Liquidity voids occur when price moves sharply in one direction. This is portrayed by large candles that have little trading activity as price moves in one direction. Eventually, the price will return to close the liquidity void later.
Liquidity voids will display as small filled rectangle
There are some config as:
+Display Liquidity Voids
+Alert when Liquidity Voids detection
+Liquidity Voids color
+Liquidity Void when filled
+Alert when Liquidity Void filled
//--------Long Wicks--------
Long wick candles are type of candlestick that have a long wick attached to the candle body. The candle body can be positive or negative, making the long wick appropriate for any type of candlestick.
Long wick will display as "V" symbol at candle
Config are:
+Display long wicks candle pattern
+Alert when long wicks found
+Wick/Body rate
+Long wick buy color
+Long wick sell color
+Long wick font size
//--------Premium and Discount--------
Premium and Discount is best used in trading ranges where price is consolidating because this helps us avoid taking low probability trades in the middle of the range where price is likely to take us out as liquidity
Indicator show Premium and Discount as Equilibrium at 50% level of swing or internal range. A small line will display at right border of chart with note.
Config:
+Show Premium and Discount as Equilibrium
+Equilibrium line color
+Equilibrium internal or swing
//--------Candle pattern--------
This indicator add Japanese candle pattern into chart as small line upper (or lower) three-candle create pattern.
Config are:
+Show candle pattern
+Bull pattern line color
+Bear pattern line color
+Candle line weight
+Show candle text
+Candle text size
+Distance from price to text (point)
+Alert when candle pattern found
//--------Pivot Point Settings--------
Internal length
Internal diviation
Internal backstep
Swing length
Swing diviation
Swing backstep
Object prefix
//--------Notifications--------
Notification type: Alert, MT mobile app, Telegram channel or group
file.txt write msg(diffirent with other symbol): Should valid when alert to telegram channel or group
Telegram channel id: Should valid when alert to telegram channel or group
Telegram bot token: Should valid when alert to telegram channel or group
This is not repaint indicator. At first load, it shoul run throug all bar to scan signal. The display change correctly when change timeframe.
About image:
1: overview
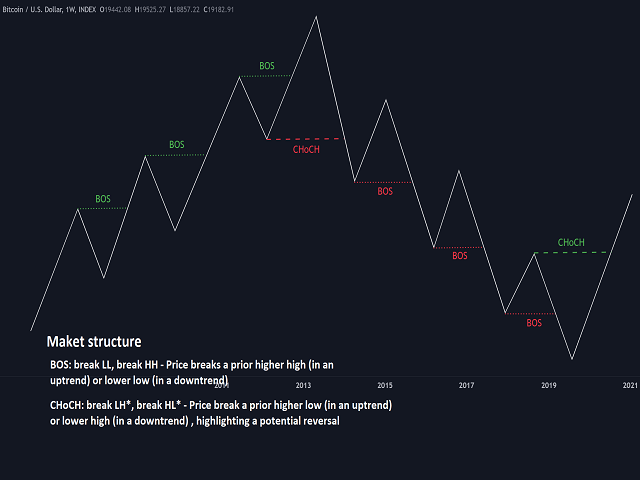
2: Description of BOS
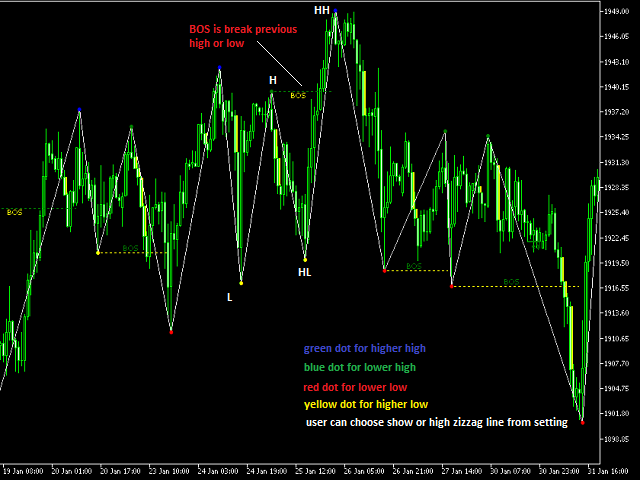
3: Example of BOS
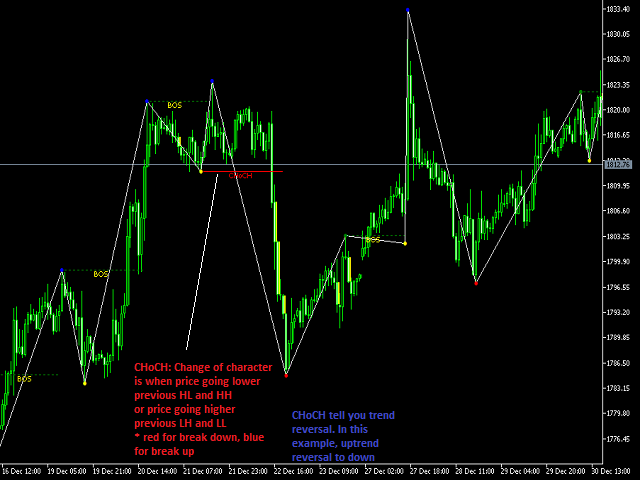
4: Example of CHoCH
5: Example of CHoCH up
6: Example of Equal high (low is vice versal)
8: Example of Fail value gap
9: Example of Swing high, low
9: Example of Order block
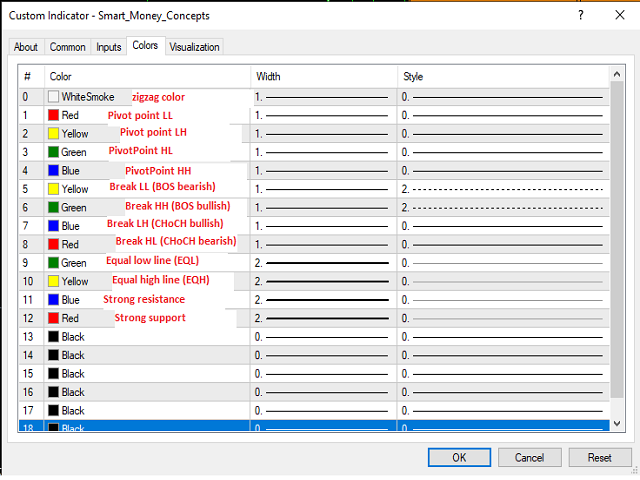
10: Setting