Smart Market structure concept MT4 version
- Indikatoren
-
Minh Truong Pham
 Hello, my name is Pham and I am a programmer and trader! At here, I create amazing forex indicators and expert advisors for Metatrader.
I will try:
+ Provide best tools base on my 5 years experience as a trader and 10 years as a programmer. - Version: 4.7
- Aktualisiert: 3 April 2023
- Aktivierungen: 5
Alles über Smart Money Concepts Strategie: Markt-Struture: Interner oder Swing BOS, CHoCH; Orderblock; Liquity gleich; Fair Value Gap mit folgendem Eingriff, Ausgeglichene Preisspanne; Level mit Vormonats-, Wochen-, Tageslevel oder im Tageslevel (PMH, PWH, PDH, HOD); BuySell Stops Liquidität (BSL, SSL); Liquiditätsleere Long Wicks; Premium und Discount; Kerzenmuster ...
"Smart Money Concepts" (SMC) ist ein relativ neuer, aber dennoch weit verbreiteter Begriff unter Price Action Traders, die versuchen, die Liquidität genauer zu navigieren und optimalere Punkte von Interesse im Markt zu finden. Der Versuch, festzustellen, wo institutionelle Marktteilnehmer Aufträge platziert haben (Liquidität auf der Kauf- oder Verkaufsseite), kann ein sehr vernünftiger Ansatz sein, um praktischere Ein- und Ausstiege auf der Grundlage der Preisentwicklung zu finden. Der Indikator enthält Warnungen für das Vorhandensein von Swing-Strukturen und viele andere relevante Bedingungen. Der Benutzer kann die Benachrichtigungsmethode wählen: MT-Terminal, MT-Mobil-App, Telegram-Kanal.
Update Version 4.0 durch Hinzufügen weiterer Funktionen und Leistungssteigerung.
Neue Version SMC_3 ist mit verbesserter Leistung veröffentlicht; intelligente OB-Scan, fügen Sie das Volumen der 1., 2. Kerze in OB; Alarm, wenn der Preis innerhalb der vorherigen OB, Swing S / R Ebene oder interne S / R Ebene
*** Für Kunden, die diesen Indikator bereits erworben haben, aktualisiere ich die Version 2.0, um neue Funktionen hinzuzufügen:
- Order-Block hinzufügen . Die Einstellung für die Anzeige in der Voreinstellung ist falsch.
- Fair value gap hinzufügen . Die Einstellung für die Anzeige ist standardmäßig falsch.
Einstellungen:
//--------Genneral Settings---------
Max bars back for calculate: Die Anzahl der Balken, die beim Start des Indikators berechnet werden sollen. Voreinstellung ist 1000
//--------Internal Structure---------
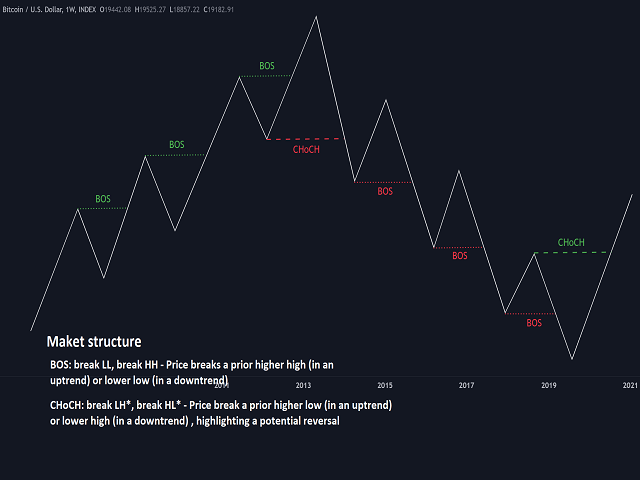
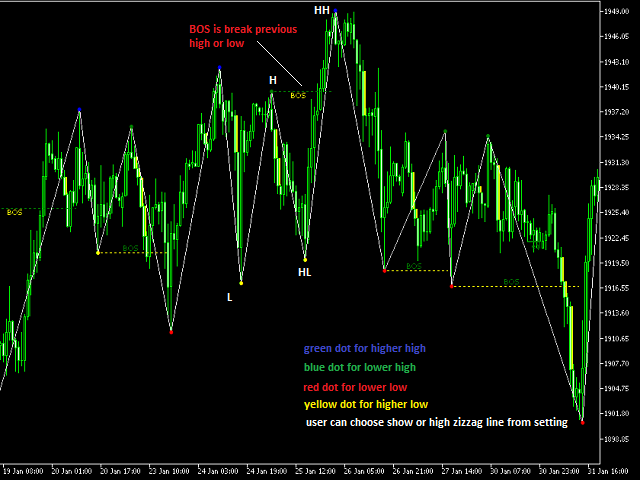
Der interne Break der Struktur wird als horizontale gepunktete Linie vom HH (oder LL) Punkt zum Breakout Punkt angezeigt. Es gibt einige Konfigurationen für iBOS wie folgt:
+Internes BOS anzeigen: Konfiguriert, ob das interne BOS (iBOS) angezeigt werden soll oder nicht.
+Internen BOS-Text anzeigen: Konfiguration, um den Text des iBOS anzuzeigen oder nicht
+Interne BOS bärische Farbe: Konfiguriert die Farbe der bärischen iBOS-Farbe
+Interne BOS bullish Farbe: Farbe der bullish iBOS Farbe konfigurieren
+Interne BOS Schriftgröße: Konfigurieren Sie die Größe des Textes "iBOS" (Farbe als Linienfarbe)
+Warnung, wenn internes BOS gefunden: Meldung konfigurieren, wenn iBOS gefunden wurde
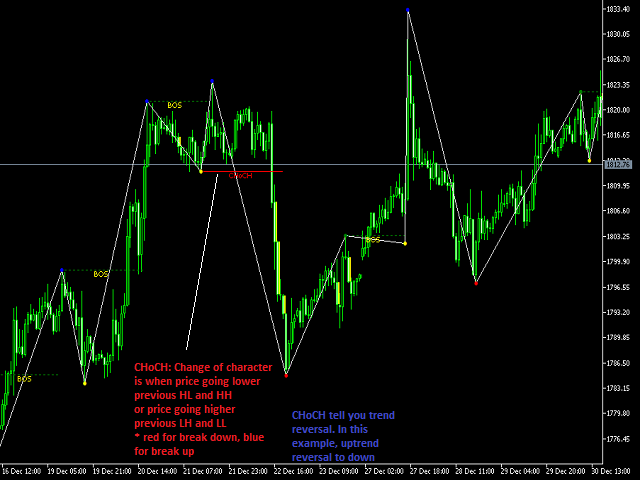
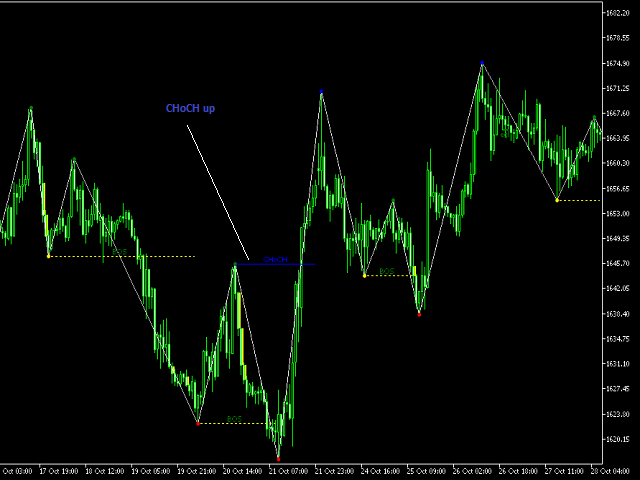
Interner Zeichenwechsel (iCHoCH) wird als horizontale gepunktete Linie vom HL (oder LH) Punkt zum Breakout Punkt angezeigt. Es gibt einige Konfigurationen für iCHoCH wie folgt:
+Interner CHoCH anzeigen
+Internen CHoCH-Text anzeigen
+Interne CHoCH bearish Farbe
+Interne CHoCH bullische Farbe
+Interne CHoCH Schriftgröße
+Alarm wenn Internal CHoCh gefunden
//--------Swing Structure---------
Swing Break der Struktur wird als horizontale gepunktete Linie vom HH (oder LL) Punkt zum Breakout Punkt angezeigt. Der Schwingungsmodus ist länger als der interne Modus. Dies hängt von der Länge des Drehpunktes ab (kann im Abschnitt Drehpunktkonfiguration konfiguriert werden). Es gibt einige Konfigurationen für sBOS wie folgt:
+Schwung BOS anzeigen
+Schwung BOS Text anzeigen
+Schwung BOS bearish Farbe
+Schwung BOS bullish Farbe
+Schriftgröße des Swing BOS
+Warnung, wenn Swing BOS gefunden wurde
Swing Change of character (iCHoCH) wird als horizontale gepunktete Linie vom HL (oder LH) Punkt zum Breakout Punkt angezeigt. Es gibt einige Konfigurationen von sCHoCH wie folgt:
+Schwung CHoCH anzeigen
+Schwung CHoCH Text anzeigen
+Schwung CHoCH bearish Farbe
+Swing CHoCH bullish Farbe
+Schriftgröße von Swing CHoCH
+Alarm, wenn Swing CHoCh gefunden wurde
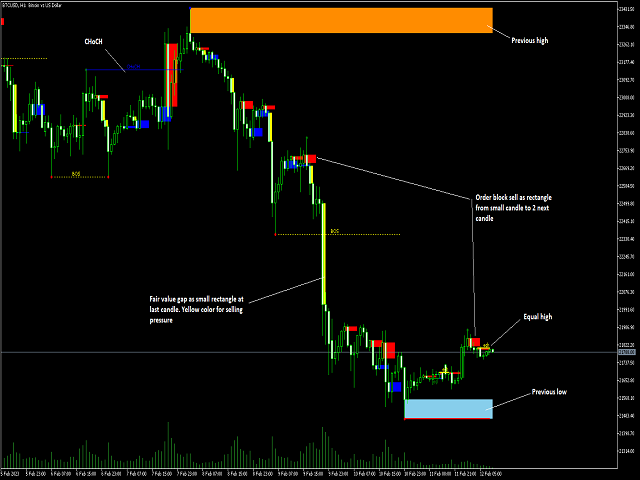
//--------Orderblock---------
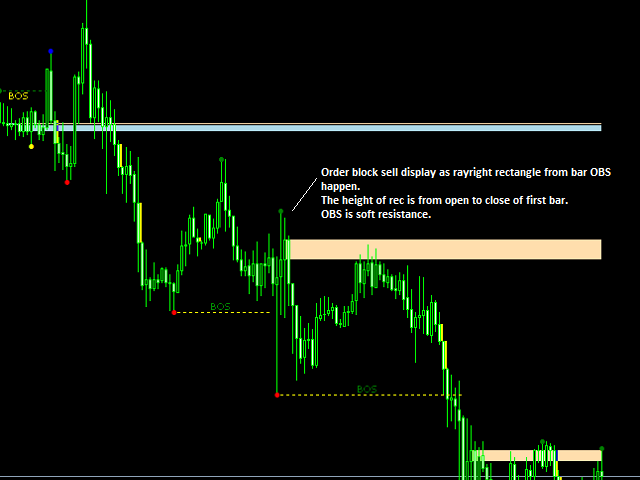
Orderblock ist eine zusammengesetzte Kerze. Dieser Indikator unterstützt 3 Arten von OB wie folgt:
+ Ob sollte nach BOS schließen, CHoCH (1)
+ Ob sollte vor BOS, CHoCH (2) schließen
+ Ob sollte nach dem Pivot-Punkt schließen (3)
+ Keine der oben genannten (4)
Für (1),(2),(3): Die Konfiguration "Abstand vom Drehpunkt BOS, CHoCH zum OB" bestimmt den maximalen Abstand zwischen OB und dem Bestätigungspunkt der Bedingung.
Andere Konfigurationen sind:
+Internen Auftragsblock anzeigen (iOB)
+OB-Typ
+OB buy have to close valley, sell have to close peak: wenn OB type in (1),(2),(3) und diese Option = true, muss ein gültiger OB buy im Tal schließen, ein gültiger OB sell muss im Hoch schließen
+Anzahl der auf dem Chart anzuzeigenden OBs: Begrenzt die Anzahl der auf dem Chart angezeigten OBs
+iOB up Farbe
+iOB down Farbe
+iOB Schriftgröße
+Alarm, wenn Order-Blöcke erscheinen
+Warnung, wenn der Preis innerhalb des OBs ist: wenn eingeschaltet, erscheint der iOB, wenn der Preis innerhalb des iOBs ist, wird der Indikator eine Meldung anzeigen.
--------Equal High,Low---------
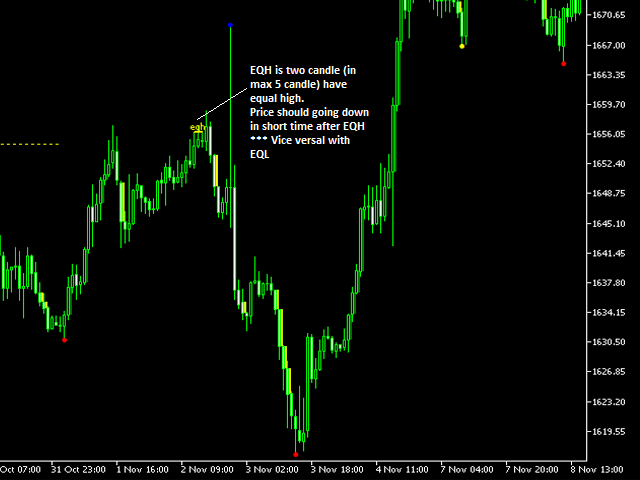
Gleiches Hoch oder Tief bedeutet, dass 2 geschlossene Kerzen das gleiche Hoch oder Tief haben. Dies wird auf dem Chart als durchgezogene Linie angezeigt, die mit dem gleichen Punkt verbunden ist. Es gibt einige Konfigurationsmöglichkeiten wie folgt:
+EQ anzeigen oder nicht
+Balkenbestätigungslänge (Mindestwert 1): begrenzt den maximalen Abstand von 2 gleichen Kerzen
+Gleiche Schriftgröße
+Gleiche hohe Schriftfarbe
+Schriftfarbe für gleiches Tief
+Alarm bei gleichem Hoch oder Tief
//--------Fair Value Gap---------
Fair Value Gaps entstehen innerhalb einer Drei-Kerzen-Sequenz und werden im Chart üblicherweise als eine große Kerze dargestellt, deren obere und untere Dochte der benachbarten Kerzen die große Kerze nicht vollständig überlappen.
Der Bereich zwischen den oberen und unteren Dochten der benachbarten Kerzen ist der Ungleichgewichtsbereich. Der Indikator zeigt den Ungleichgewichtsbereich als ausgefülltes kleines Rechteck in der Nähe der Hauptkerze an.
Wir haben ein neues Konzept "Balanced price range" - BPR: Wenn FVG erstellt und danach gefüllt wird, wird der Ungleichgewichtsbereich zu einem Unterstützungs- oder Widerstandsniveau. Dieser Indikator zeigt BPR als Rechteck ohne Füllung vom Ungleichgewicht bis zu den nächsten 10 Balken an (Konfiguration unter "Balanced price range length in bar").
Ein konsequenter Eingriff liegt vor, wenn eine Fair-Value-Lücke zu 50 % gefüllt ist; dies wird als mittlerer Schwellenwert des FVG bezeichnet. Händler sollten bedenken, dass der Preis den FVG möglicherweise nicht vollständig füllt; daher ist die Ausrichtung auf den mittleren Schwellenwert ideal, um keine Trades zu verpassen.
Einige Konfigurationen des FVG sind:
+Fair Value Gap anzeigen
+Farbe der FairValueGap, die durch großen Kaufdruck entstanden ist
+Farbe der FairValueGap, die durch großen Verkaufsdruck entstanden ist
+Konsequentes Eingreifen: Der Indikator zeigt das konsequente Eingreifen als schmale Linie innerhalb der Ungleichgewichtszone bei Level=50% an.
+Farbe der Linie für den konsequenten Einbruch
+Balanced price range anzeigen
+Max bar BPR should fill gap: maximaler Abstand, den das Ungleichgewicht gefüllt werden sollte
+Länge der ausgeglichenen Preisspanne in Balken: BPR Rechtecklänge
+Farbe der Länge der ausgeglichenen Preisspanne
+Alarm bei Fair Value Gap-Erkennung
+Alarm bei BPR-Erkennung
//--------Ausschlag, internes Hoch, Tief---------
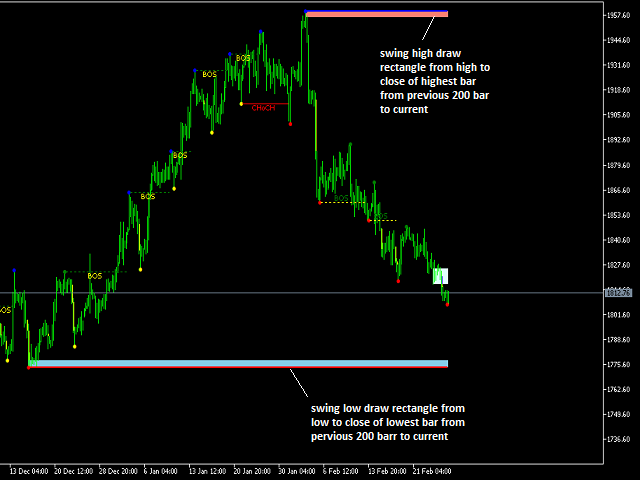
Der Swing, das interne Hoch oder Tief sollte als Rechteck ohne Füllung angezeigt werden und bis zum rechten Rand des Charts reichen. Um die Darstellung zu erleichtern, sollte das Diagramm auf den Modus "Ende des Diagramms vom rechten Rand verschieben" eingestellt werden. Innerhalb des Rechtecks sollte ein Hinweis auf die Zeit und den Preis stehen.
Die Einstellungen sind:
+Swing Maxbar: dies ist die Anzahl der Balken ab dem aktuellen, die das höchste oder niedrigste Niveau für die Swing-Periode finden.
+Interner Maxbar: dies ist die Anzahl der Balken ab dem aktuellen, die den höchsten oder niedrigsten Stand für die interne Periode finden.
+Vorherige Hochs und Tiefs anzeigen
+Warnung, wenn Highs & Lows erscheinen
+Warnung, wenn der Preis innerhalb der vorherigen Hochs und Tiefs liegt: Wenn diese Funktion aktiviert ist, wird das Niveau angezeigt, wenn der Preis innerhalb des Niveaus liegt, wird der Indikator eine Meldung ausgeben.
+Schwingung Unterstützungsfarbe
+Farbe des Schwankungswiderstands
+Interne Unterstützungsfarbe
+Interne Widerstandsfarbe
//--------Level: PMH, PWH, PML, PWL...---------
Dieser Indikator zeigt viele Arten von Levels auf dem Chart an:
-PMH, PML: Hoch und Tief des Vormonats
-PWH, PML: Vorwochenhoch, -tief
PDH, PDL: Höchst- und Tiefststand des Vortages
-HOD, HOL: Höchst- und Tiefstwert des Tages
Es gibt einige Konfigurationen wie folgt:
+Vormonatshoch, -tief anzeigen
+Vormonat Hoch Farbe
+Farbe des Vormonatstiefs
+Alarm, wenn Preisausbruch Vormonat
//---
+Vorwoche Hoch, Tief anzeigen
+Vorwoche Hoch Farbe
+Farbe des Vorwochentiefstkurses
+Alarm bei Preisdurchbruch Vorwoche
//---
+Anzeige Vortag Hoch, Tief
+Vortag Hoch Farbe
+Farbe Vortagstief
+Alarm bei Preisdurchbruch Vortag
//---
+Hoch des Tages, Tief des Tages anzeigen
+Farbe des Tageshochs
+Farbe des Tagestiefstkurses
+Alarm bei Preisdurchbruch Hoch, Tief des Tages
//--------BuySell Stops Liquidität (BSL, SSL)
BuySell Stops Liquidität kann einfach als die Situation falsch zu Breakout verstanden werden. Dies ist der Fall, wenn der Preis über den Widerstand steigt und schnell wieder unter den Widerstand sinkt (im Gegensatz zur Unterstützung).
Dieser Indikator
+ Level ist PMH, PML, PWH, PML, PDH, PDL, HOD, HOL (Typ1)
+ Level ist Pivot-Punkt: wenn Pivot_5 = Pivot_3 und Pivot_1>Pivot_3 (für Widerstand), aktueller Preis < Pivot_3 (Typ2)
//-------- typ1---------
+BSL für Vormonatshoch anzeigen
+Vormonats-BSL-Balken: maximaler Abstand des falschen Ausbruchs
//--
+BSL für Hoch der Vorwoche anzeigen
+Vorige Woche BSL-Balken
//--
+BSL für Vortagshoch anzeigen
+Vortages-BSL-Balken
//--
+Anzeige BSL für Tageshöchststand
+Tageshöchstwert-BSL-Leiste
//--
+Alarm wenn BSL erscheint
+BSL-Linienfarbe
//--
+BSL-Schriftgröße
//--
+SSL für Vormonatstief anzeigen
+Vormonats-BSL-Balken
//--
+Anzeige SSL für Vorwoche Tief
+Vorige Woche BSL-Balken
//--
+Zeige SSL für Vortagstief
+Vortages-BSL-Balken
//--
+SSL für Tageshoch anzeigen
+Tagestiefstwert BSL-Balken
//-- Anzeige und Warnung
+Warnung, wenn SSL erscheint
+SSL Linienfarbe
+SSL Schriftgröße
//--------BSL, SSL nach Drehpunkt - Typ2---------
+BSL nach Pivot-Punkt
+BSL Gleicher Schwellenwert: Gleichheit von pivot_3 und pivot_5
+BSL nach Pivotpunkt Linienfarbe
+BSL nach Pivot-Punkt Schriftgröße
//--
+SSL nach Pivot-Punkt
+SSL Gleicher Schwellenwert
+SSL durch Pivot-Punkt Linienfarbe
+SSL nach Pivot-Punkt Schriftgröße
//--------Liquidity Void--------
Liquiditätslücken treten auf, wenn sich der Preis stark in eine Richtung bewegt. Dies wird durch große Kerzen dargestellt, die wenig Handelsaktivität aufweisen, während sich der Kurs in eine Richtung bewegt. Schließlich kehrt der Preis zurück, um die Liquiditätslücke später zu schließen.
Liquiditätslücken werden als kleine gefüllte Rechtecke angezeigt.
Es gibt einige Konfigurationsmöglichkeiten wie:
+Liquiditätslücken anzeigen
+Warnung bei Erkennung von Liquiditätslücken
+Farbe der Liquiditätslücken
+Flüssigkeitsleere wenn gefüllt
+Alarm, wenn Liquidity Void gefüllt
//--------Langdochte--------
Langdochtkerzen sind Kerzen, die einen langen Docht am Kerzenkörper haben. Der Kerzenkörper kann positiv oder negativ sein, wodurch der lange Docht für jede Art von Kerze geeignet ist.
Der lange Docht wird als "V"-Symbol an der Kerze angezeigt.
Die Konfigurationen sind:
+Anzeige langer Dochte Kerzenmuster
+Warnung, wenn lange Dochte gefunden werden
+Docht/Körper-Kurs
+Farbe des langen Dochts beim Kauf
+Langdocht-Verkaufsfarbe
+Schriftgröße für lange Dochte
//--------Premium und Discount--------
Premium und Discount werden am besten in Handelsbereichen verwendet, in denen sich der Preis konsolidiert, da dies uns hilft, Trades mit geringer Wahrscheinlichkeit in der Mitte des Bereichs zu vermeiden, in dem der Preis uns wahrscheinlich als Liquidität herausnehmen wird.
Der Indikator zeigt Premium und Discount als Gleichgewicht bei 50% der Swing- oder internen Handelsspanne an. Eine kleine Linie wird am rechten Rand des Charts mit einem Hinweis angezeigt.
Konfigurieren:
+Aufschlag und Abschlag als Gleichgewicht anzeigen
+Farbe der Gleichgewichtslinie
+Gleichgewicht intern oder Swing
//--------Candle pattern--------
Dieser Indikator fügt ein japanisches Kerzenmuster in den Chart ein, indem er eine kleine Linie über (oder unter) drei Kerzen erzeugt.
Die Konfigurationen sind:
+Kerzenmuster anzeigen
+Farbe der Bullenmusterlinie
+Bärenmuster Linienfarbe
+Gewicht der Kerzenlinie
+Kerzentext anzeigen
+Kerzentextgröße
+Abstand vom Preis zum Text (Punkt)
+Alarm, wenn Kerzenmuster gefunden
//--------Pivotpunkt-Einstellungen--------
Interne Länge
Interne Teilung
Interner Rückschritt
Swing-Länge
Schwung-Teilung
Swing-Rückschritt
Objekt-Präfix
//--------Notifications--------
Art der Benachrichtigung: Alert, MT mobile app, Telegram Kanal oder Gruppe
file.txt write msg(unterschiedlich mit anderem Symbol): Sollte gültig sein, wenn die Benachrichtigung an einen Telegram-Kanal oder eine Gruppe geht
Telegram-Kanal-ID: Sollte gültig sein, wenn ein Telegram-Kanal oder eine Gruppe alarmiert wird
Telegram Bot Token: Sollte gültig sein, wenn ein Telegram-Kanal oder eine Telegram-Gruppe alarmiert wird.
Dies ist kein Wiederholungsindikator. Beim ersten Laden sollte er alle Balken durchlaufen, um das Signal zu scannen. Die Anzeige ändert sich korrekt, wenn der Zeitrahmen geändert wird.
Über Bild:
1: Übersicht
2: Beschreibung von BOS
3: Beispiel für BOS
4: Beispiel für CHoCH
5: Beispiel für CHoCH oben
6: Beispiel für Equal high (low ist umgekehrt)
8: Beispiel für Fail value gap
9: Beispiel für Swing high, low
9: Beispiel für Order block
10: Einstellung