Smart Market structure concept MT4 version
- Indicadores
-
Minh Truong Pham
 Hello, my name is Pham and I am a programmer and trader! At here, I create amazing forex indicators and expert advisors for Metatrader.
I will try:
+ Provide best tools base on my 5 years experience as a trader and 10 years as a programmer. - Versión: 4.7
- Actualizado: 3 abril 2023
- Activaciones: 5
Todo sobre la estrategia Smart Money Concepts: Estrutura de mercado: interno o swing BOS, CHoCH; Orderblock; Liquidez igual; Gap de Valor Justo con la consiguiente invasión, Rango de precios equilibrado; Nivel con el mes anterior, semana, nivel del día o en el nivel del día (PMH, PWH, PDH, HOD); BuySell Stops Liquidez (BSL, SSL); Liquidez vacío Mechas largas; Prima y Descuento; Patrón de velas ...
"Smart Money Concepts" ( SMC ) es un término bastante nuevo pero ampliamente utilizado entre los operadores de acción de precios que buscan navegar con mayor precisión la liquidez y encontrar puntos de interés más óptimos en el mercado. Tratar de determinar dónde han colocado órdenes los participantes institucionales del mercado (liquidez del lado comprador o vendedor) puede ser un enfoque muy razonable para encontrar entradas y salidas más prácticas basadas en la acción del precio. El indicador incluye alertas para la presencia de estructuras oscilantes y muchas otras condiciones relevantes. El usuario puede elegir el método de notificación incluyen: MT terminal, MT aplicación móvil, canal de Telegrama.
Actualización de la versión 4.0 añadiendo más funciones e incrementando el rendimiento.
Nueva versión SMC_3 se libera con un rendimiento mejorado, la exploración inteligente OB, añadir el volumen de 1 ª, 2 ª vela en OB, alerta cuando el precio dentro de OB anterior, swing S / R nivel o interno S / R nivel.
*** Para los clientes que ya compraron este indicador, actualizo a la versión 2.0 debido a la adición de nuevas características:
- Añadir bloque de órdenes. La configuración por defecto es falsa.
- Añadir valor justo brecha. El valor por defecto es falso.
Ajustes:
//--------Genneral Settings---------
Max barras atras para calcular: Numero de barras que deben ser calculadas cuando se inicia el indicador. Por defecto es 1000
//--------Internal Structure---------
La ruptura interna de la estructura se mostrará como una línea horizontal punteada desde el punto HH (o LL) hasta el punto de ruptura. Hay algunas configuraciones de iBOS como sigue:
+Show Internal BOS: Configurar para mostrar o no el BOS interno (iBOS)
+Show Internal BOS text: Configurar para mostrar texto de iBOS o no
+Internal BOS bearish color: Configurar el color del iBOS bajista
+Internal BOS bullish color: Configurar el color del iBOS alcista
+Tamaño fuente BOS interno: Configurar el tamaño del texto "iBOS" (color de la línea)
+Alerta cuando se encuentra un BOS interno: Configurar notificación cuando se encuentra iBOS
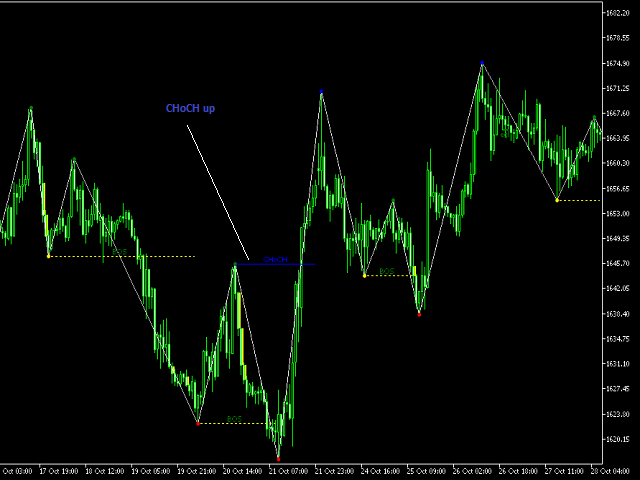
El cambio de carácter interno (iCHoCH) se mostrará como una línea de puntos horizontal desde el punto HL (o LH) hasta el punto de ruptura. Hay algunas configuraciones de iCHoCH como sigue:
+Mostrar CHoCH interno
+Mostrar texto de CHoCH interno
+CHoCH interno bajista
+Color alcista de la CHoCH interna
+Tamaño de letra de la CHoCH interna
+Alerta cuando se encuentra la CHoCH Interna
//--------Swing Structure---------
El Swing Break de la estructura se mostrará como una línea de puntos horizontal desde el punto HH (o LL) hasta el punto de ruptura. El modo Swing será más largo que el modo Internal. Depende de la longitud del punto de pivote (se puede configurar en la sección de configuración del punto de pivote). Hay algunas configuraciones de sBOS:
+Mostrar Swing BOS
+Mostrar texto Swing BOS
+Swing BOS color bajista
+Swing BOS color alcista
+Tamaño de la fuente
+Alerta cuando se encuentra Swing BOS
Swing Change of character (iCHoCH) se mostrará como una línea horizontal punteada desde el punto HL (o LH) hasta el punto de ruptura. Hay algunas configuraciones de sCHoCH como sigue:
+Show Swing CHoCH
+Mostrar Swing CHoCH texto
+Swing CHoCH color bajista
+Swing CHoCH color alcista
+Tamaño de la fuente
+Alerta cuando se encuentra Swing CHoCH
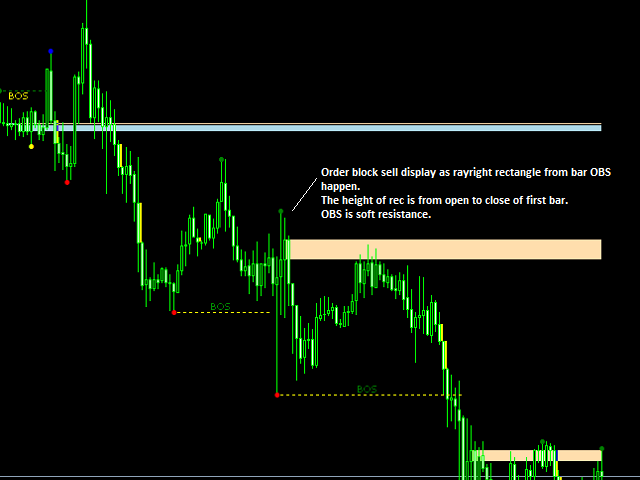
//--------Bloque de orden---------
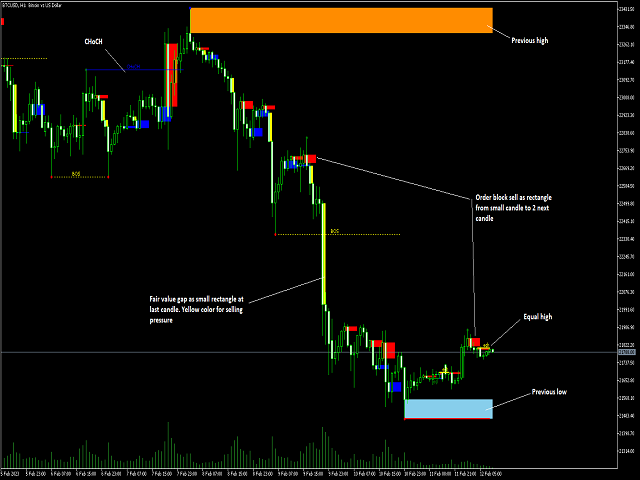
El bloque de orden es una vela compuesta. Este indicador soporta 3 tipos de OB como sigue:
+ Ob debe cerrar después de BOS, CHoCH (1)
+ Ob debe cerrar antes de BOS, CHoCH (2)
+ Ob debe cerrar después de Pivot point (3)
+ Ninguna de las anteriores (4)
Para (1),(2),(3): La configuración "Distancia del pivote BOS, CHoCH a OB" determinará la distancia máxima entre OB y el punto de condición de confirmación.
Otras configuraciones son:
+Mostrar bloque de orden interno (iOB)
+OB tipo
+Si el tipo de OB está en (1),(2),(3) y esta opción es = true, un OB válido de compra debe cerrar en el valle y un OB válido de venta debe cerrar en el pico.
+Número de iOB a mostrar en el gráfico: limita el número de OBs mostrados en el gráfico
+color de subida del iOB
+iOB abajo color
+Tamaño de la fuente
+Alerta cuando aparecen Bloques de Órdenes
+Alerta cuando el precio está dentro del OB: cuando se activa, el iOB aparece después de que el precio entre en el iOB, el indicador lo notificará.
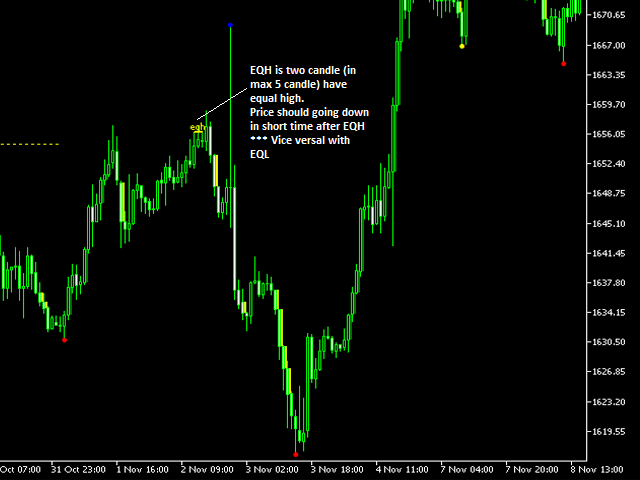
--------Equal High,Low---------
Igual alto o bajo es cuando 2 velas cercanas tienen igual alto o bajo. Esto se mostrara en el grafico como una linea solida conectada a un punto igual. Hay algunas configuraciones a seguir:
+Mostrar EQ o no
+Longitud de Confirmación de la Barra (valor mínimo 1): limita la distancia máxima de 2 velas iguales.
+Igual tamaño de letra
+Color de fuente igual alto
+Color de fuente igual a bajo
+Alerta cuando igual alto o bajo
//--------Gap de Valor Justo---------
Los Gaps de Valor Justo se crean dentro de una secuencia de tres velas y se visualizan comúnmente en el gráfico como una vela grande cuyas mechas superior e inferior de las velas vecinas no se solapan completamente con la vela grande.
El área entre la parte superior e inferior de las velas vecinas es el área de desequilibrio. El indicador mostrará el área de desequilibrio como un pequeño rectángulo relleno cerca de la vela principal.
Tenemos un nuevo concepto "Balanced price range" - BPR: cuando FVG creado y después de que llenó, el área de desequilibrio convertido en apoyo o nivel de resistencia. Este indicador muestra el BPR como un rectángulo sin relleno desde el desequilibrio hasta las siguientes 10 barras (configurado en "Balanced price range length in bar").
Los operadores deben tener en cuenta que el precio podría no llenar completamente el FVG, por lo tanto, apuntar al umbral medio es ideal para no perder operaciones.
Algunas configuraciones de FVG son:
+Show Fair value gap
+Color del FairValueGap creado debido a una gran presión de compra
+Color del FairValueGap creado debido a una gran presión vendedora
+Mostrar la invasión consecuente: el indicador mostrará la invasión consecuente como una pequeña línea dentro del área de desequilibrio a un nivel = 50%.
+Color de la línea de invasión consecuente
+Mostrar rango de precio equilibrado
+Max bar BPR should fill gap: distancia máxima que el desequilibrio debe ser llenado
+Longitud del rango de precio equilibrado en barra: Longitud del rectángulo BPR
+Color de la longitud del rango de precio equilibrado
+Alerta cuando se detecta la brecha de valor justo
+Alerta cuando se detecta BPR
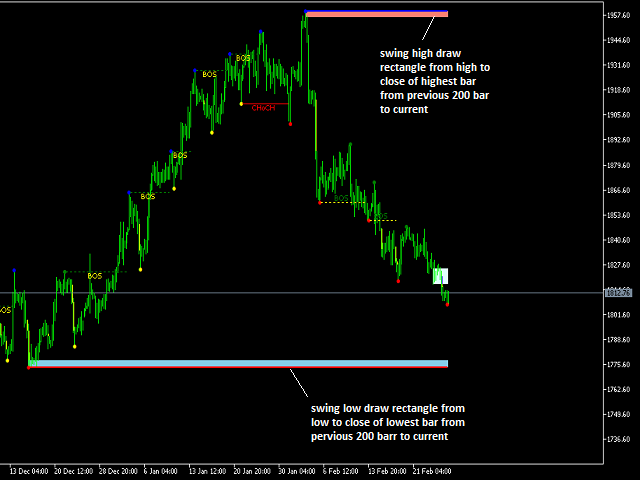
//--------Swing, máximo interno, mínimo---------
El swing, máximo interno o nivel bajo debe mostrarse como un rectángulo sin relleno y extenderse hasta el borde derecho del gráfico. Para facilitar la visualización, el gráfico debe ajustarse al modo "Desplazar el final del gráfico desde el borde derecho". Dentro del rectángulo debe haber alguna nota sobre el tiempo y el precio.
Las configuraciones son:
+Swing Maxbar: este es el número de barras desde la actual que encuentra el nivel más alto o más bajo para el periodo swing.
+Maxbar Interno: Este es el numero de barras desde la actual que encuentra el nivel mas alto o mas bajo para el periodo interno.
+Mostrar máximos y mínimos anteriores
+Alerta si aparecen Máximos y Mínimos
+Alerta si el precio esta dentro de los Máximos y Mínimos Previos: cuando se activa, el nivel aparece después de que el precio entra dentro del nivel, el indicador notificará.
+Color del soporte
+Color de la resistencia
+Color del soporte interno
+Color de resistencia interna
//--------Nivel: PMH, PWH, PML, PWL...---------
Este indicador muestra muchos tipos de nivel en el gráfico:
-PMH, PML: Máximo y mínimo del mes anterior
-PWH, PML: Máximo y mínimo de la semana anterior
-PDH, PDL: Máximo y mínimo del día anterior
-HOD, HOL: Máximo, mínimo del día
Hay algunas configuraciones como las siguientes:
+Mostrar máximo y mínimo del mes anterior
+Color del máximo del mes anterior
+Color del mínimo del mes anterior
+Alerta cuando el precio rompe el mes anterior
//---
+Mostrar máximo y mínimo de la semana anterior
+Color del máximo de la semana anterior
+Color del mínimo de la semana anterior
+Alerta cuando el precio rompe la semana anterior
//---
+Mostrar máximo y mínimo del día anterior
+Color del máximo del día anterior
+Color del mínimo del día anterior
+Alerta cuando el precio rompe el Día Anterior
//---
+Mostrar Máximo del Día, Mínimo del Día
+Color del máximo del día
+Color del mínimo del día
+Alerta cuando el precio rompe Máximo, mínimo del día
//--------BuySell Stops Liquidez (BSL, SSL)
BuySell Stops Liquidez se puede entender simplemente como la situación falsa a la ruptura. Esto es cuando el precio va más alto que la resistencia y rápidamente baja a más bajo que la resistencia (opuesto con el soporte).
Este indicador
+ Nivel es PMH, PML, PWH, PML, PDH, PDL, HOD, HOL (tipo1)
+ Nivel es punto pivote: cuando pivote_5 = pivote_3 y pivote_1>pivote_3 (para resistencia), precio actual < pivote_3 (tipo2)
//-------- tipo1---------
+Mostrar BSL para el máximo del mes anterior
+Barra BSL del mes anterior: distancia máxima de la falsa ruptura
//--
+Mostrar BSL para el máximo de la semana anterior
+Barra BSL de la semana anterior
//--
+Mostrar BSL para el máximo del día anterior
+Barra BSL del día anterior
//--
+Mostrar BSL para Máximo del Día
+Barra BSL de Máximo del Día
//--
+Alerta cuando aparece BSL
+Color de la línea BSL
//--
+Tamaño de letra BSL
//--
+Mostrar BSL para Mes Anterior Bajo
+Barra BSL del mes anterior
//--
+Mostrar SSL para la semana anterior
+Barra BSL de la semana anterior
//--
+Mostrar SSL para el mínimo del día anterior
+Barra BSL del día anterior
//--
+Mostrar SSL para Máximo del Día
+Bajo del día BSL bar
//-- visualización y alerta
+Alerta cuando aparece SSL
+SSL color de línea
+SSL tamaño de letra
//--------BSL, SSL por punto pivote - tipo2---------
+BSL por punto de pivote
+BSL Umbral de igual nivel: tolencia de pivot_3 y pivot_5
+BSL por punto pivote color de línea
+BSL por punto de pivote tamaño de letra
//--
+SSL por punto de pivote
+SSL Umbral de igual nivel
+SSL por color de línea de punto de pivote
+SSL por tamaño de fuente de punto de pivote
//--------Liquidity Void--------
Los vacíos de liquidez se producen cuando el precio se mueve bruscamente en una dirección. Esto se representa por grandes velas que tienen poca actividad comercial mientras el precio se mueve en una dirección. Eventualmente, el precio volverá a cerrar el vacío de liquidez más tarde.
Los vacíos de liquidez se mostrarán como pequeños rectángulos rellenos.
Hay algunas configuraciones como:
+Mostrar Vacíos de Liquidez
+Alerta cuando se detectan vacíos de liquidez
+Color de los Vacíos de Liquidez
+Vacío de liquidez cuando se llena
+Alerta cuando se llena el vacío de liquidez
//--------Mechas Largas--------
Las velas de mecha larga son un tipo de vela que tiene una mecha larga unida al cuerpo de la vela. El cuerpo de la vela puede ser positivo o negativo, haciendo que la mecha larga sea apropiada para cualquier tipo de vela.
La mecha larga se mostrará como una "V" en la vela.
Las configuraciones son:
+Mostrar patrón de velas de mechas largas
+Alerta cuando se encuentran mechas largas
+Tarifa Mecha/Cuerpo
+Color de compra de mecha larga
+Color de venta de mechas largas
+Tamaño de fuente de mecha larga
//--------Premio y Descuento--------
La Prima y el Descuento se utilizan mejor en rangos de negociación donde el precio se está consolidando, ya que esto nos ayuda a evitar tomar operaciones de baja probabilidad en el medio del rango donde el precio es probable que nos saque como liquidez.
El indicador muestra la Prima y el Descuento como Equilibrio al 50% del nivel de oscilación o rango interno. Una pequeña línea se mostrará en el borde derecho del gráfico con una nota.
Config:
+Mostrar Prima y Descuento como Equilibrio
+Color de la línea de equilibrio
+Equilibrio interno o swing
//--------Candle pattern--------
Este indicador añade un patrón de velas japonesas en el gráfico como una pequeña línea superior (o inferior) que crea un patrón de tres velas.
Config son:
+Mostrar patrón de velas
+Color de la línea del patrón
+Color de la línea del patrón
+Peso de la línea de la vela
+Mostrar texto de la vela
+Tamaño del texto de la vela
+Distancia del precio al texto (punto)
+Alerta cuando se encuentra un patrón de velas
//--------Configuración del punto de giro--------
Longitud interna
Diviación interna
Retroceso interno
Longitud de giro
Diviación de giro
Paso atrás
Prefijo del objeto
//--------Notifications--------
Tipo de notificación: Alerta, aplicación móvil MT, canal o grupo de Telegram
file.txt escribir msg(diffirent con otro símbolo): Debe ser válido cuando se alerta al canal o grupo de Telegram
Id de canal de Telegram: Debe ser válido cuando se alerta al canal o grupo de Telegram
Token de bot de Telegram: Debería ser válido cuando se alerta al canal o grupo de telegram.
Este indicador no se repinta. Cuando se carga por primera vez, debe recorrer todas las barras para escanear la señal. La pantalla cambia correctamente cuando se cambia el marco de tiempo.
Acerca de la imagen:
1: visión general
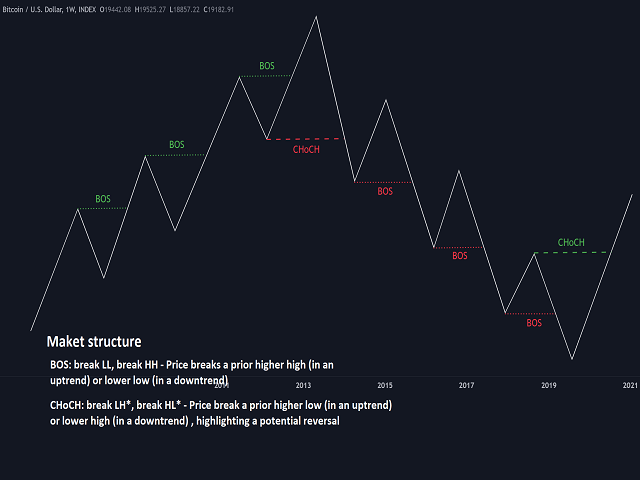
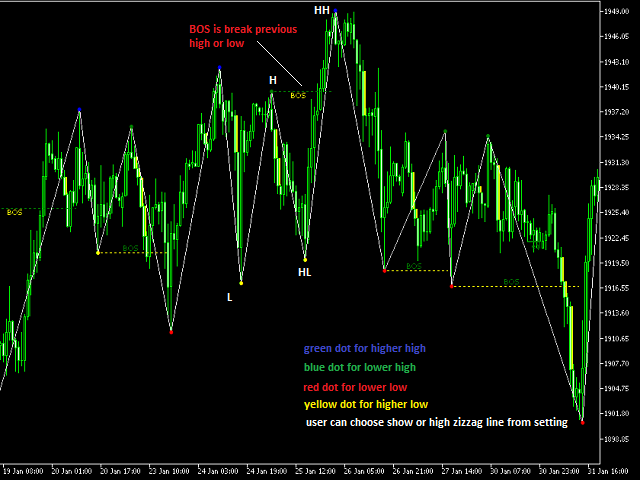
2: Descripción de BOS
3: Ejemplo de BOS
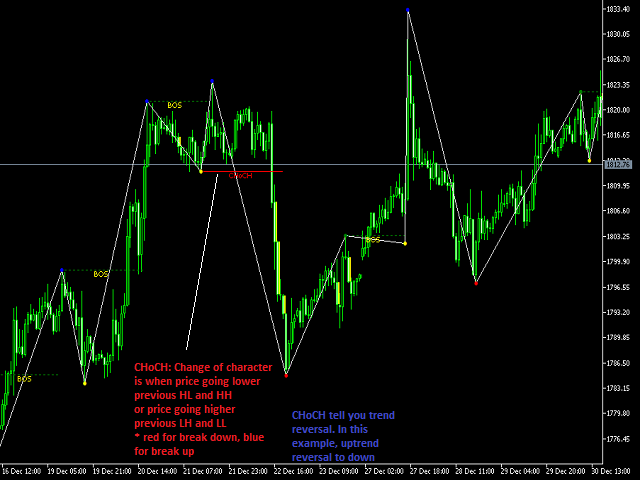
4: Ejemplo de CHoCH
5: Ejemplo de CHoCH arriba
6: Ejemplo de Equal high (low es viceversa)
8: Ejemplo de Fail value gap
9: Ejemplo de Swing high, low
9: Ejemplo de bloque de órdenes
10: Ajuste