Imagic05

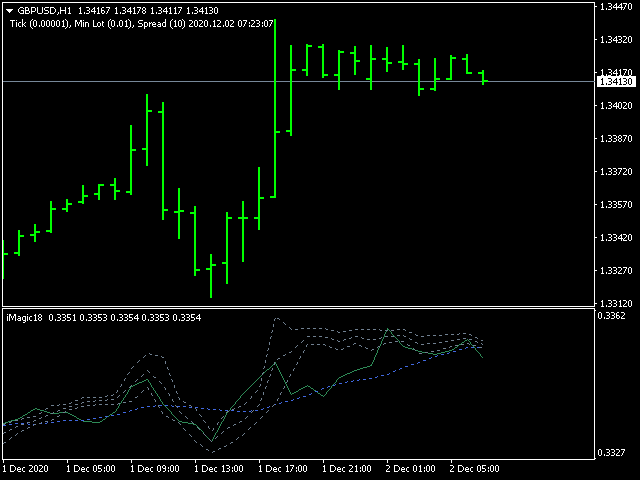
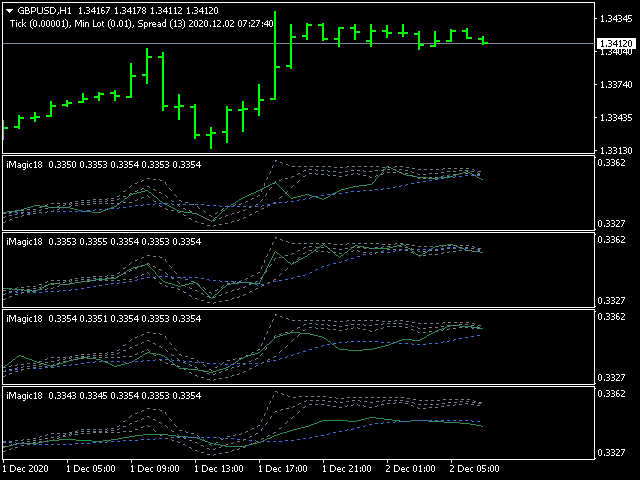
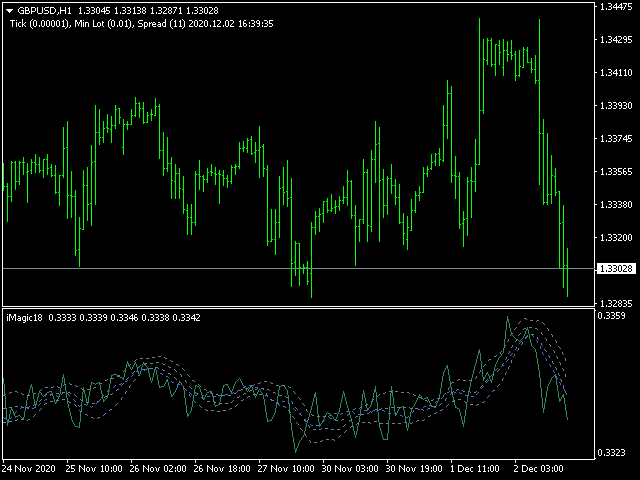
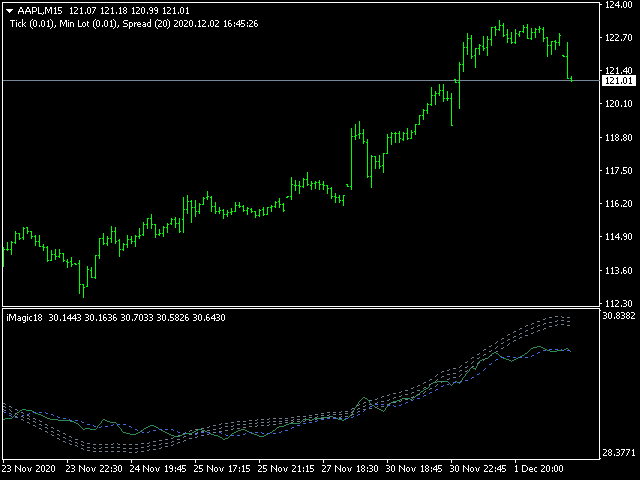
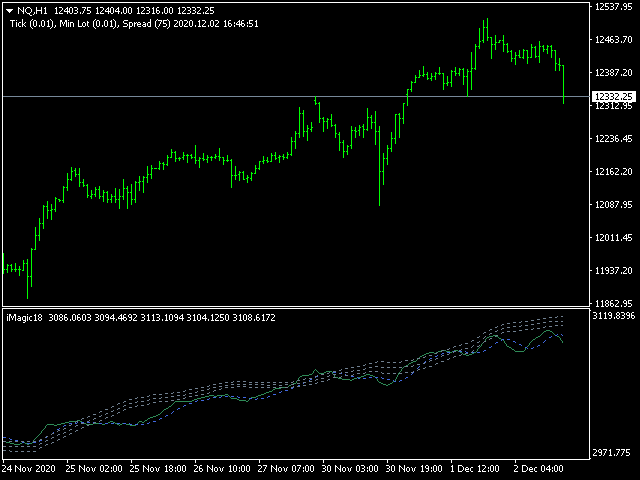
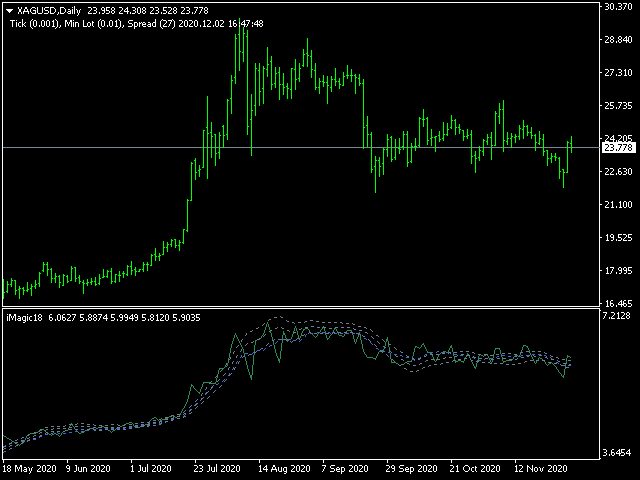
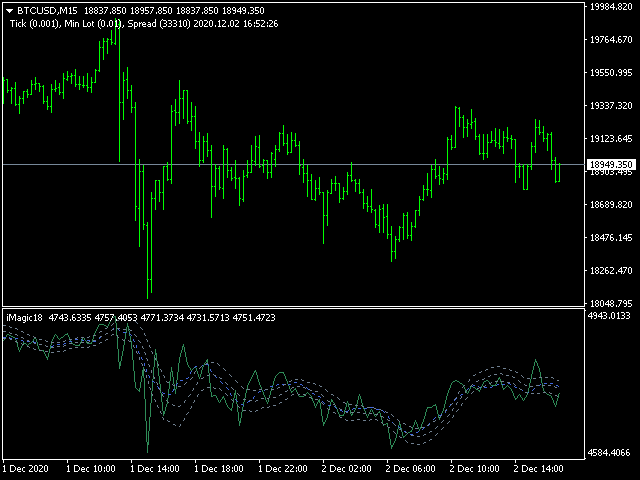
The indicator is a tough Moving Average, weighted by many parameters. Accordingly, you need to trade according to the volatility of the chart. For convenience, moving averages of High, Low, Median ((High-Low) / 2) periods have been added to the indicator.
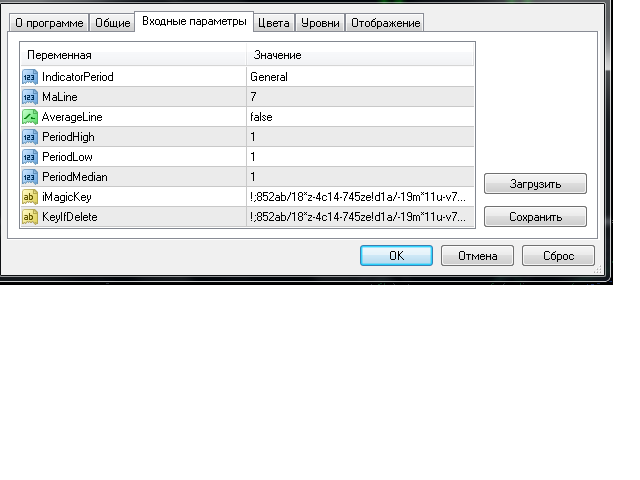
Input parameters:

IndicatorPeriod (green line): several periods (general-general, calculation for all periods; small- small period; medium- medium period; long- long period)

MaLine- indicator smoothing (Moving Average) (blue line).

PeriodHigh, PeriodLow, PeriodMedian- moving averages of the High, Low, Median periods.

AverageLine - use averaged volumes when calculating (you need to remove the dependence on volumes when calculating).

!! The indicator is overloaded, so there may be slight freezes on the online chart. To avoid this, you need to partially delete the history of the chart. !!

Recommended  PeriodHigh, PeriodLow, PeriodMedian:

  • Period general -12.
  • Period small - 4.
  • Period medium - 11.
  • Period long - 24.
Tags: Bollinger Bands, Standard Deviation, MA, Moving Average.


Recommended products
ADX Pointer
Dominik Mandok
ADX Pointer is an indicator which is based on "Average Directional Index" and draws three numbers in chart window depending on the value of ADX. In ADX Pointer you can set "ADX_Period" which is of course period of Average Directional Index and you can also set 3 levels. When ADX value exceed first level ("ADX_Level1") in chart window appears number "1", when ADX exceed second level ("ADX_Level2") appears "2" and when ADX exceed third level ("ADX_Level3") appears "3". Simple. ADX Pointer works on
Momentum Breakout Envelope
Pieter Gerhardus Van Zyl
Momentum Breakout Envelope is a momentum-analysis indicator designed to highlight potential breakout phases and shifts in market strength. It runs in a separate window and displays three main elements: an upper band , a lower band , and a momentum core line . Together they form a dynamic envelope that expands or contracts as market momentum changes. The bands act as a structured range that helps visualize momentum pressure, while the core line represents the underlying strength of the current mo
Laser Trend
Nicolas Zouein
The trend is your friend! This is what this indicator is all about. Follow this famous saying and be safe. Characteristics: Buy/Sell signals fixed on the close of a bar. Works on all symbols and all timeframes. Clear visual market trend laser line, Buy/Sell signal arrows, market strength meter, TP1 & TP2 boxes. Visual signals when to enter, when to exit the market. No repainting. Compatible with Flexible EA for trading automation. (Ask for a free set file optimized to perform 2010-2018) Parame
PABT Pattern Indicator - it's classical system one of the signal patterns. Indicator logic - the Hi & Lo of the bar is fully within the range of the preceding bar, look to trade them as pullback in trend. In the way if indicator found PABT pattern it's drawing two lines and arrow what showing trend way.  - First line - it's entry point and drawing at: 1. On the high of signal bar or on middle of the signal bar (depending from indicator mode) for buy; 2. On the low of signal bar or on middle of t
MACD Divergence
Sergey Deev
2.5 (2)
The indicator detects divergence signals - the divergences between the price peaks and the MACD oscillator values. The signals are displayed as arrows in the additional window and are maintained by the messages in a pop-up window, e-mails and push-notifications. The conditions which formed the signal are displayed by lines on the chart and in the indicator window. Indicator Parameters MacdFast - fast MACD line period MacdSlow - slow MACD line period MacdSignal - MACD signal line period MacdPric
Indicador Taurus All4
Fabio Oliveira Magalhaes
Taurus All4 Taurus All4 is a high-performance indicator, it will tell you the strength of the trend, and you will be able to observe the strength of the candle. Our indicator has more than 4 trend confirmations. It is very simple and easy to use. Confirmation Modes Candle Trend Confirmations: When the candle switches to light green the trend is high. When the candle switches to light red the trend is reverting down. When the candle changes to dark red the trend is low. Trendline Trend Confirm
RenkoMaStoch
Sergey Deev
1 (1)
The indicator displays renko bars on a chart, uses them to plot the fast and slow moving average and Stochastic, as well as it provides buy/sell signals: a buy signal is generated when the fast moving is above the slow one, and the signal line of Stochastic crosses the lower level from bottom up; a sell signal is generated when the fast moving is below the slow one, and the signal line of Stochastic crosses the upper level from top to bottom; Renko is a non-trivial price display method. Instead
Arriator
Nadiya Mirosh
The Arriator forex indicator algorithm allows you to quickly determine the current trend in the market. The Elephant indicator accompanies long-term trends and can be used without restrictions on instruments or timeframes. This indicator not only helps predict future values, but also generates buy and sell signals. It tracks market trends, ignoring wild swings and market noise around the average price. The indicator implements a type of technical analysis based on the idea of ​​market cyclicalit
Cosmic Dream
Tyrae Trae Bailey
This indicator may or may not be within your interest but I call it Cosmic Dream. When I backtested the indicator, colored level zones appear on your chart. It can work on any currency pair you want. There are 5 level zones. 5 are red and 5 are green. The purpose of this indicator is to let traders see the number of level zones. The interval of the zones is 50 at best. In terms of zone width, the number is 10. It can utilized for any direction. The colors will be visible as long as the indicator
Alpha Trend sign has been a very popular trading tool in our company for a long time. It can verify our trading system and clearly indicate trading signals, and the signals will not drift. Main functions: Based on the market display of active areas, indicators can be used to intuitively determine whether the current market trend belongs to a trend market or a volatile market. And enter the market according to the indicator arrows, with green arrows indicating buy and red arrows indicating se
Crypto_Forex Indicator "CCI with Dynamic OverSold/OverBought zones" for MT4, No Repaint. - Commodity Channel Index (CCI) is excellent for Momentum trading into the trend direction. - It is great to take Sell entries from dynamic OverBought zone and Buy entries from dynamic OverSold zone into the direction of main trend. - This indicator is excellent to combine with Price Action entries as well. - Dynamic OverBought zone - above yellow line. - Dynamic OverSold zone - below blue line. - CCI osci
VR Cub
Vladimir Pastushak
VR Cub is an indicator for getting high-quality entry points. The indicator was developed to facilitate mathematical calculations and simplify the search for entry points into a position. The trading strategy for which the indicator was written has been proving its effectiveness for many years. The simplicity of the trading strategy is its great advantage, which allows even novice traders to successfully trade with it. VR Cub calculates position opening points and Take Profit and Stop Loss targe
Indicator without redrawing Divergent MAX The DivirgentMAX indicator is a modification based on the MACD. The tool detects divergence based on OsMA and sends signals to buy or sell (buy|sell), taking into account the type of discrepancies detected. Important!!!! In the DivirgentMAX indicator, the optimal entry points are drawn using arrows in the indicator's basement. Divergence is also displayed graphically. In this modification of the MACD, the lag problem characteristic of its predecessor i
Wave Wolf MT4
Andrei Salanevich
The Wave Wold MT4 Forex indicator is designed to search for Wolf waves and display them in the current window of the trading terminal. An excellent indicator for traders who use Wolf waves in trading. Its application in trading strategies will significantly increase their efficiency and profitability. INFORMATION ABOUT THE INDICATOR Unlike other Wolf wave indicators, the Wave Wold MT4 forex indicator has a number of features that significantly increase its effectiveness: The first is the Ope
Infinity Trend Pro
Yaroslav Varankin
1 (1)
This is a trend indicator without redrawing Developed instead of the binary options strategy (by the color of the Martingale candlestick) Also works well in forex trading When to open trades (binary options) A signal will appear in the place with a candle signaling the current candle It is recommended to open a deal for one candle of the current timeframe M1 and M5 When a blue dot appears, open a deal up When a red dot appears, open a trade down. How to open trades on Forex. When a signal is rec
Stochastic Divergence
Oleksii Pidlubnyi
3 (2)
The indicator displays divergence and convergence on all instruments. It works on all timeframes. After finding divergence/convergence, the indicator draws a Buy or a Sell arrow according to the detected signal.  Settings Buy - show buy signals Sell - show sell signals Divergence - show divergence on the chart Convergence - show convergence on the chart KPeriod, DPeriod, Slowing - Stochastic settings drawPriceTrendLines - draw a line (of divergence/covergence) on a price chart drawIndicatorTren
Upgrade your charts instantly. Smart Round Levels draws powerful .00 and .50 round-number zones automatically on  any forex pair — including  JPY pairs  like USDJPY — and features a dynamic  live price tracker  that follows price in real time. Features: • Automatic round-number detection (.00 & .50) • Auto-adjusts for JPY and non-JPY pairs • Perfect precision with customizable spacing & scale • Fully customizable colors, line widths, font sizes • Real-time yellow price label tha
This is a combination of multiple oscillators into a single divergence system that creates the impression of a more reliable divergence indicator. It is multi-currency based and works best on 15 minutes timeframe and above. Every time a signal is generated, it shows an alert to the user. It is more ideal if combined with other price action indicators or trading systems.
This indicator is another variant of the famous powerful indicator Fibonacci-SS https://www.mql5.com/en/market/product/10136 but has different behaviour in placing Pending Order and TP Line. Automatically places Fibonacci retracement lines from the last highest and lowest visible bars on the chart with: An auto Pending Order (Buy/Sell). Taking Profit 1, Taking Profit 2 is pivot point and Taking Profit 3 for extended reward opportunity. The best risk and reward ratio. Simple and powerful indicat
Auto Fibo Pro m
DMITRII GRIDASOV
"Auto FIBO Pro"   Crypto_Forex  indicator  - is great auxiliary tool in trading! Indicator automatically calculate and place on chart Fibo levels and local trend lines (red color). Fibonacci levels indicate key areas where price can reverse. Most important levels are 23.6%, 38.2%, 50% and 61.8%. You can use it   for reversal scalping  or for zone grid trading. There are plenty of opportunities to  improve your current system using Auto FIBO Pro indicator as well. It has Info Spread Swap Displa
G99 GRAVITY G99 Gravity is a channel indicator for the MetaTrader 4 terminal. This indicator allows finding the most probable trend reversal points. Unlike most channel indicators, G99 Gravity does not redraw. Attach the indicator to a chart, and the alert will trigger once a signal emerges. With our alerting system, you will never miss a single position opening signal! Advantages of the indicator Perfect for scalping. Excellent for identifying trend reversals. Suitable for beginners and exper
Crypto_Forex   Indicator HTF Ichimoku for MT4. Ichimoku indicator is   one of the most powerful trend indicators . H TF means -   H igher TimeFrame. This indicator is excellent for Trend Traders as well as combination with Price Action entries. HTF Ichimoku  Indicator allows you to attach Ichimoku from higher timeframe to your current chart. Up trend   - red line above blue one (and both lines are above cloud) /  Down trend   - red line below blue one  (and both lines are below cloud). Open BUY
FXC iDeM-DivergencE MT4 Indicator This is an advanced DeMarker indicator that finds trend-turn divergences on the current symbol. The indicator detects divergence between the DeMarker and the price movements as a strong trend-turn pattern. Main features: Advanced divergence settings Price based on Close, Open or High/Low prices Give Buy/Sell open signals PUSH notifications E-mail sending Pop-up alert Customizeable Information panel Input parameters: DeM Period: The Period size of the DeMarker in
NexusSignal Scalping
Vincent Jose Proenca
TECHNICAL DESCRIPTION The Nexus Signal System is an MT4 indicator that combines 12 technical criteria to generate trading signals. The system analyzes the confluence of multiple factors (trend, momentum, volume, S/R zones) before validating a signal, which reduces the number of false signals compared to indicators using a single criterion. ANALYSIS CRITERIA (Scoring 0–15 points): Pattern detection (pin bars, engulfing) Multi-Timeframe Analysis (higher timeframe trend confirmation) ADX Market Reg
Rainbow Price Visualizer v1.21 See where the market really breathes. Turns your MT4 chart into an ultra-precise heatmap that highlights price zones favored by big players. Why it matters 300 price levels at 0.2‑pip resolution — microscopic detail. 8 visual themes (Rainbow, Fire, Ocean…) for instant readibility. Smart opacity: low noise fades, real zones pop. Lightweight rendering with automatic cleanup. Fully customizable: saturation, opacity, resolution, history depth. Bands project into the f
The indicator displays Renko bars, uses their data to calculate and display the Ichimoku Kinko Hyo indicator and provides buy/sell signals. Renko is a non-trivial price display method. Instead of displaying each bar within a time interval, only the bars where the price moved a certain number of points are shown. Renko bars do not depend on a time interval, therefore the indicator works on any timeframe without losing its efficiency. Indicator generates two signals: When the Tenkan-Sen line is ab
Crypto_Forex Indicator "FORCE index and 2 Moving Averages" for MT4. No repaint. - This indicator is excellent for momentum trading into the trend direction. - "FORCE index and 2 Moving Averages"  Indicator allows you to see Fast and Slow Moving Averages of Force index. - Force index is one of the top indicators that combines   price and volume data   into a single value. - Force index itself is powerful oscillator - that measures the amount of power used to move the price. - Indicator gives opp
Trend Oscillator - is an advanced custom  Crypto_Forex indicator, efficient trading tool! Advanced new calculation method is used - 20 options for parameter "Price for calculation". Smoothest oscillator ever developed. Green color for upward trends,  Red color for downward trends. Oversold values: below 5, O verbought values: over 95. There are plenty of opportunities to upgrade even standard strategies with this indicator. With PC and Mobile alerts. Click here to see high quality Trading Robot
Distinctive
Tatiana Savkevych
Distinctive is a forex trending arrow indicator for identifying potential entry points. I like it, first of all, because it has a simple mechanism of work, adaptation to all time periods and trading tactics. Created on the basis of a regression channel with filters. Plotting the Lawrence indicator signals on a price function chart using a mathematical approach. How it works - when the price breaks out in the overbought / oversold zone (channel levels), a buy or sell signal is generated. Everyt
[ZhiBiCCI] indicators are suitable for all cycle use, and are also suitable for all market varieties. [ZhiBiCCI] Green solid line is a reversal of bullish divergence. The green dotted line is a classic bullish divergence. [ZhiBiCCI] The solid line to the red is a reverse bearish divergence. The red dotted line is a classical bearish divergence. [ZhiBiCCI] can be set in the parameters (Alert, Send mail, Send notification), set to (true) to send instant signals to the alarm window, email, insta
Buyers of this product also purchase
Genesis Matrix Pro is a professional multi-timeframe trend detection indicator designed to help traders identify high-quality market alignment with clarity and structure. It combines 12 different technical indicators into one visual alignment matrix, allowing traders to quickly see when market conditions are bullish, bearish, or neutral. A signal is generated only when the selected strategies are aligned, helping reduce noise and improve decision-making. PLEASE CONTACT ME AFTER PURCHASE TO GET
Gann Made Easy
Oleg Rodin
4.83 (163)
Gann Made Easy is a professional and easy to use Forex trading system which is based on the best principles of trading using the theory of W.D. Gann. The indicator provides accurate BUY and SELL signals including Stop Loss and Take Profit levels. You can trade even on the go using PUSH notifications. PLEASE CONTACT ME AFTER PURCHASE TO GET TRADING  INSTRUCTIONS AND GREAT EXTRA INDICATORS   FOR FREE! Probably you already heard about the Gann trading methods before. Usually the Gann theory is a ve
The Propfolio Master Suite is the ultimate all-in-one analytical workstation for professional traders. Combining the power of the Beat The Market Maker (BTMM) methodology, Smart Money Concepts (SND/Liquidity), and Advanced Volume Profile, this suite replaces multiple different indicators with one optimized engine. Monitor up to 14 pairs simultaneously from a single chart, instantly identify market cycles, and seamlessly map institutional footprints with the click of a button. The Command Center
Scalper Inside PRO
Alexey Minkov
4.74 (69)
Scalper Inside PRO Scalper Inside PRO is an intraday trend and scalping indicator for MetaTrader 4 that uses an exclusive algorithm to quickly detect market direction and key target levels. It automatically calculates entry, exit and multiple profit targets, and shows detailed performance statistics so you can see how different instruments and strategies performed. This helps you choose the most suitable trading instruments for the current market conditions. Additionally, you can easily integrat
M1 Sniper
Oleg Rodin
5 (23)
M1 SNIPER is an easy to use trading indicator system. It is an arrow indicator which is designed for M1 time frame. The indicator can be used as a standalone system for scalping on M1 time frame and it can be used as a part of your existing trading system. Though this trading system was designed specifically for trading on M1, it still can be used with other time frames too. Originally I designed this method for trading XAUUSD and BTCUSD. But I find this method helpful in trading other markets a
PRO Renko System
Oleg Rodin
5 (30)
PRO Renko System is a highly accurate trading system specially designed for trading RENKO charts. The ARROWS and Trend Indicators DO NOT REPAINT! The system effectively neutralizes so called market noise giving you access to accurate reversal signals. The indicator is very easy to use and has only one parameter responsible for signal generation. You can easily adapt the tool to any trading instrument of your choice and the size of the renko bar. I am always ready to provide extra support to help
Auto Optimized Parabolic RSI: Advanced 3D Momentum Engine Most retail indicators fail because they rely on static inputs that break the moment market volatility shifts. Auto Optimized Parabolic RSI solves the problem of "indicator decay" by continuously recalculating its own mathematical edge, bringing institutional-grade quantitative adaptation directly to your MT5 terminal. The Core Advantage: Custom In-Memory 3D Optimization   Standard auto-optimizers often freeze the MT5 platform because the
NAM Order Blocks
NAM TECH GROUP, CORP.
3.67 (3)
MT4 Multi-timeframe Order Blocks detection indicator. Features - Fully customizable on chart control panel, provides complete interaction. - Hide and show control panel wherever you want. - Detect OBs on multiple timeframes. - Select OBs quantity to display. - Different OBs user interface. - Different filters on OBs. - OB proximity alert. - ADR High and Low lines. - Notification service (Screen alerts | Push notifications). Summary Order block is a market behavior that indicates order collection
Quants HL Break
Ferhat Mutlu
5 (2)
Advanced calculation made by pure price action to find LH and HL breakouts. It will give you a great reversal points in the market. LH and HL signals can used for the traingle breakouts as well. Once breakout happens its indicate strong reversal. Nice filter for Moving Averages. I highly suggest to use that with trend indicators. Can be used as an extra confirmation for support and resistance , supply demand indicators. The indicator is not repainting. Buffers :   SetIndexBuffer ( 0 ,UpBar);
Dynamic Forex28 Navigator
Bernhard Schweigert
4.43 (7)
Specials Discount now. The Next Generation Forex Trading Tool. Dynamic Forex28 Navigator is the evolution of our long-time, popular indicators, combining the power of three into one: Advanced Currency Strength28 Indicator (695 reviews) + Advanced Currency IMPULSE with ALERT (520 reviews) + CS28 Combo Signals (recent Bonus) Details about the indicator  https://www.mql5.com/en/blogs/post/758844 What Does The Next-Generation Strength Indicator Offer? Everything you loved about the originals, now
PZ Harmonacci Patterns
PZ TRADING SLU
3.17 (6)
Trade smarter, not harder: Empower your trading with Harmonacci Patterns This is arguably the most complete harmonic price formation auto-recognition indicator you can find for the MetaTrader Platform. It detects 19 different patterns, takes fibonacci projections as seriously as you do, displays the Potential Reversal Zone (PRZ) and finds suitable stop-loss and take-profit levels. [ Installation Guide | Update Guide | Troubleshooting | FAQ | All Products  ] It detects 19 different harmonic pric
RFI levels PRO
Roman Podpora
5 (1)
The indicator accurately shows the reversal points and price return zones where the   Major players . You see where new trends are forming and make decisions with maximum precision, maintaining control over every trade. VERSION MT5     -     Reveals its maximum potential when combined with the   TREND LINES PRO   indicator What the indicator shows: Reversal structures and reversal levels with activation at the beginning of a new trend. Display of   TAKE PROFIT   and   STOP LOSS   levels with mi
Trend Catcher ind
Ramil Minniakhmetov
TREND CATCHER INDICATOR Trend Catcher Indicator analyzes market price movements, using a combination of the author’s proprietary and customized adaptive trend-analysis indicators.  It identifies the true market direction by filtering out short-term noise and focusing on underlying momentum strength, volatility expansion, and price structure behavior.  It also uses a combination of smoothing and trend-filtering customized indicators such as moving averages, RSI, and volatility filters.   Real ope
Apollo SR Master is a Support/Resistance indicator with special features which make trading with Support/Resistance zones easier and more reliable. The indicator calculates Support/Resistance zones in real-time without any time lag by detecting local price tops and bottoms. Then to confirm the newly formed SR area, the indicator shows special signal which signalizes that the SR zone can be taken into consideration and used as an actual SELL or BUY signal. In this case the strength of the SR zone
Grabber System
Ihor Otkydach
5 (2)
Let me introduce you to an excellent technical indicator – Grabber, which works as a ready-to-use "All-Inclusive" trading strategy. Within a single code, it integrates powerful tools for technical market analysis, trading signals (arrows), alert functions, and push notifications. Every buyer of this indicator also receives the following for free: Grabber Utility for automatic management of open orders Step-by-step video guide: how to install, configure, and trade with the indicator Custom set fi
Day Trader Master is a complete trading system for traders who prefer intraday trading. The system consists of two indicators. The main indicator is the one which is represented by arrows of two colors for BUY and SELL signals. This is the indicator which you actually pay for. I provide the second indicator to my clients absolutely for free. This second indicator is actually a good trend filter indicator which works with any time frame. THE INDICATORS DO NOT REPAINT AND DO NOT LAG! The system is
GoldRush Trend Arrow Signal V1.6 The GoldRush Trend Arrow Signal indicator V1.6 continues to provide precise, real-time trend analysis tailored for high-speed, short-term scalpers in XAU/USD , but it now has additional features and improved efficiency and reliability. Built specifically for the 1-minute time frame, this tool displays directional arrows for clear entry points, allowing scalpers to navigate volatile market conditions with confidence. The indicator consists of PRIMARY and SECONDARY
Introduction to Fractal Pattern Scanner Fractal Indicator refers to the technical indicator that makes use of the fractal geometry found in the financial market. Fractal Pattern Scanner is the advanced Fractal Indicator that brings the latest trading technology after the extensive research and development work in the fractal geometry in the financial market. The most important feature in Fractal Pattern Scanner is the ability to measure the turning point probability as well as the trend probabi
Trading Special –40% OFF Best Solution for any Newbie or Expert Trader! This Indicator is a unique, high quality and affordable trading tool because we have incorporated a number of proprietary features and a new formula. With only ONE chart you can read Currency Strength for 28 Forex pairs! Imagine how your trading will improve because you are able to pinpoint the exact trigger point of a new trend or scalping opportunity? User manual: click here That's the first one, the original! Don't buy a
Advanced Supply Demand
Bernhard Schweigert
4.91 (300)
Trading Special – 40% OFF Best Solution for any Newbie or Expert Trader! This indicator is a unique, high quality and affordable trading tool because we have incorporated a number of proprietary features and a new formula. With this update, you will be able to show double timeframe zones. You will not only be able to show a higher TF but to show both, the chart TF, PLUS the higher TF: SHOWING NESTED ZONES. All Supply Demand traders will love it. :) Important Information Revealed Maximize the pot
Market Structure Patterns MT4
Samuel Manoel De Souza
5 (18)
Market Structure Patterns   is an indicator based on   smart money concepts   that displays   SMC/ICT   elements that can take your trading decisions to the next level. Take advantage of the   alerts ,   push notifications   and   email messages   to keep informed from when an element is formed on the chart, the price crosses a level and/or enters in a box/zone. Developers can access the values of the elements of the indicator using the   global variables  what allows the automation of trading d
Advanced UT BOT ALERTS for MT4 Professional Multi-Filter Trend Detection System | Enhanced UT BOT Engine We only provide high-quality indicators.  Advanced UT BOT is built for professional use, featuring a stable signal logic and secure calculation process that prevents any delays or false updates. It does not repaint, redraw, remove, or modify past signals in any way. All BUY and SELL signals are generated only after the candle has closed , ensuring consistent accuracy and reliability. There is
Contact me after purchase to get Bonus EA based on this indicator. The Self Optimizing Double MA Strategy is a professional-grade trading tool designed to eliminate parameter guesswork. Powered by a built-in auto-optimization engine, it continuously adapts to shifting market conditions by simulating thousands of parameter combinations in the background to maintain a statistical edge. Instead of relying on static, outdated settings, the indicator dynamically updates its own logic to find the mos
If you trade Forex, having detailed information about the currency strength and currency pairs correlation can take your trading to new heights. The correlation will help to cut your risk in half, and strength analysis will help to maximize the profits. This indicator provides a hybrid approach for selecting the most appropriate currency pairs using the strength analysis and currency pairs correlation. How to use the Currency Strength Analysis Suppose your trading strategy provides a buying opp
KURAMA GOLD SIGNAL PRO (MT4) — Complete XAUUSD Trading System with 7-Layer Filter, Auto TP/SL, and Quality Scoring NON-REPAINTING. NON-REDRAWING. NON-LAGGING. Every signal is permanent. What you see is what you get. BONUS: Buy the lifetime license and receive AI Zone Radar ($59 value) + full PDF manual FREE. Message me after purchase. AI Zone Radar: https://www.mql5.com/en/market/product/175834 TRUSTED BY TRADERS: Already used by an active community of Gold traders. Praised for accuracy and
The " Dynamic Scalper System " indicator is designed for the scalping method of trading within trend waves. Tested on major currency pairs and gold, compatibility with other trading instruments is possible. Provides signals for short-term opening of positions along the trend with additional price movement support. The principle of the indicator. Large arrows determine the trend direction. An algorithm for generating signals for scalping in the form of small arrows operates within trend waves.
Master head and shoulders patterns for better trading decisions A head and shoulders pattern is a chart formation that resembles a baseline with three peaks, the outside two are close in height and the middle is highest. It predicts a bullish-to-bearish trend reversal and is believed to be one of the most reliable trend reversal patterns. It is one of several top patterns that signal, with varying degrees of accuracy, that a trend is nearing its end. [ Installation Guide | Update Guide | Trouble
PZ Double Top Bottom
PZ TRADING SLU
5 (1)
Trade double tops and bottoms effectively The PZ Double Top/Bottom Indicator is a technical analysis tool that helps traders identify potential price reversal patterns in the market. These patterns, known as double tops and bottoms, are characterized by two consecutive peaks or valleys in the price of an asset. Double tops and bottoms are often seen as potential reversal patterns because they can signal a change in the direction of the current trend. [ Installation Guide | Update Guide | Troubl
Special offer : ALL TOOLS , just $35 each! New tools   will be   $30   for the   first week   or the   first 3 purchases !  Trading Tools Channel on MQL5 : Join my MQL5 channel to update the latest news from me The Three Bar Reversal Pattern Indicator offers a powerful tool for traders, automatically identifying and highlighting three-bar reversal patterns directly on the price chart. This indicator serves as a valuable resource for detecting potential trend reversals and enables users to refin
Technical indicator that structures charts and identifies cyclical price movements. Can work on any charts. Several types of alerts. There are additional arrows on the chart itself. Without redrawing on history, works on closing a candle. Recommended TF from M5 and higher. Easy to use and configure parameters. When using 2 indicators with different parameters, you can use without other indicators. Has 2 input parameters Cyclicality and Signal duration These 2 parameters work with the processin
More from author
Imagic01
Aleksandr Morozov
The indicator represents 4 moving averages, shifted back. Created, like any moving average indicators, in order to see the approximate balance of volatility and the number of bulls and bears. The difference from other Moving Averages is that an attempt is made here to bring the moving averages of different periods to a common denominator, respectively, to bring the number of traders trading on different timeframes to a common denominator. The indicator is distributed as is. MnojitelMA1, Mnojit
FREE
Imagic02
Aleksandr Morozov
An indicator showing volumes with the addition of four moving averages of these volumes. What is this indicator for? When analyzing the Forex markets, metals, indices on the H1, H4 charts, at the beginning of the day and at the end of the trading day according to server time, the volumes are less than in the middle of the day. This indicator was created for this. It will help you compare trading volumes within the day. The indicator is distributed as is. Tags: Volume, Custom Volume, MA, Custom M
FREE
Imagic03
Aleksandr Morozov
The indicator shows the trend change and how the market is changing. When calculating, many parameters are weighed. Therefore, divergence between the chart and the indicator is possible. Input parameters: IndicatorPeriod: several calculation periods (small - small period, medium - medium period, long - long period). You can trade by divergence, analyzed on the resistance and support lines (and other types of graphical analysis), as part of other indicators. Tags:  Stochastic, Trend.
Imagic04
Aleksandr Morozov
Indicator formula: High-Low + Volume; Open-Close + Volume That is, an attempt to bring price and volume to a common denominator. Input parameters: IndicatorPeriod: several periods of calculation (small-short-term; medium-medium; long-long-term). MnojitelLine, MnpjitelLine2 - multiplication of lines for comparison. AverageVolume - averaging volumes for calculation (needed to remove the dependence on volumes). If both the indicator and the chart make a fast jump, then we are waiting for a ro
Imagic06
Aleksandr Morozov
The indicator represents 2 lines of different periods: one line is short-term (red line), the other is long-term (blue line). Each of the lines is a hard Moving Average, weighted by many parameters. Accordingly, you need to trade according to chart volatility. For convenience, the indicator has been added moving averages of the High, Low, Median ((High-Low) / 2) periods. Input parameters: IndicatorPeriod: several periods (general- general period, calculation for all periods; small- short-term
Filter:
No reviews
Reply to review