Length Movement MT5

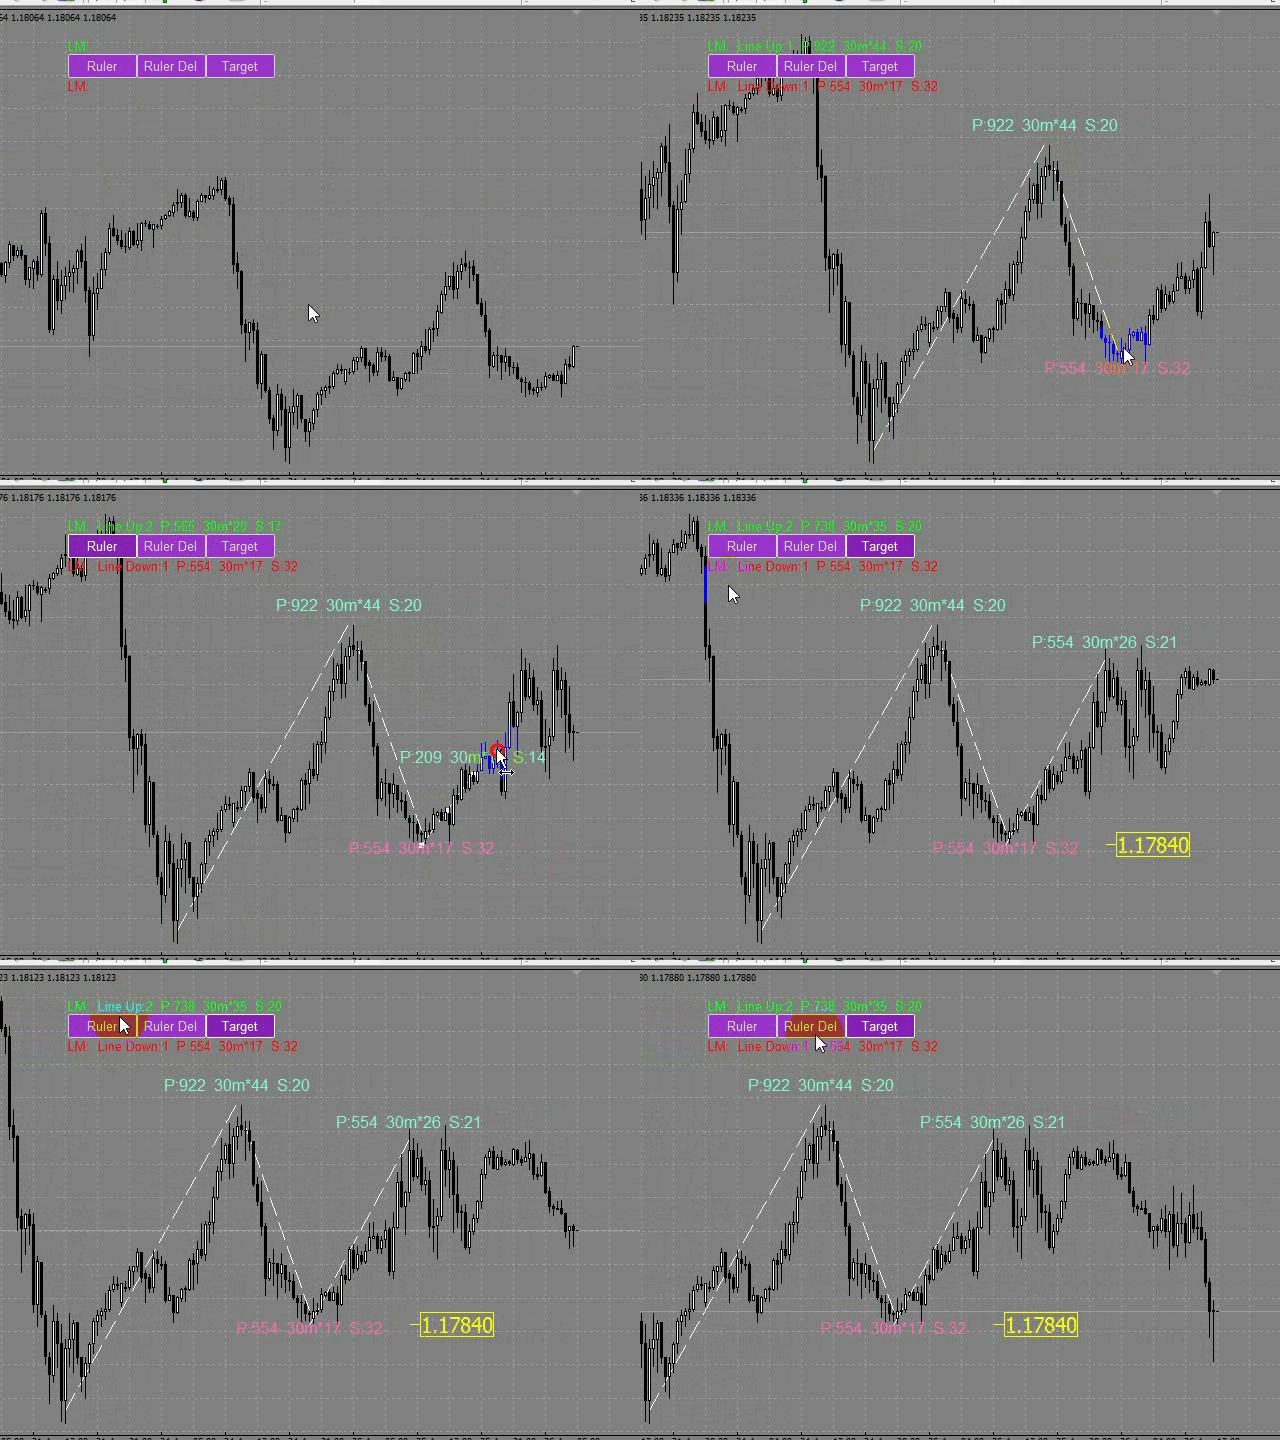
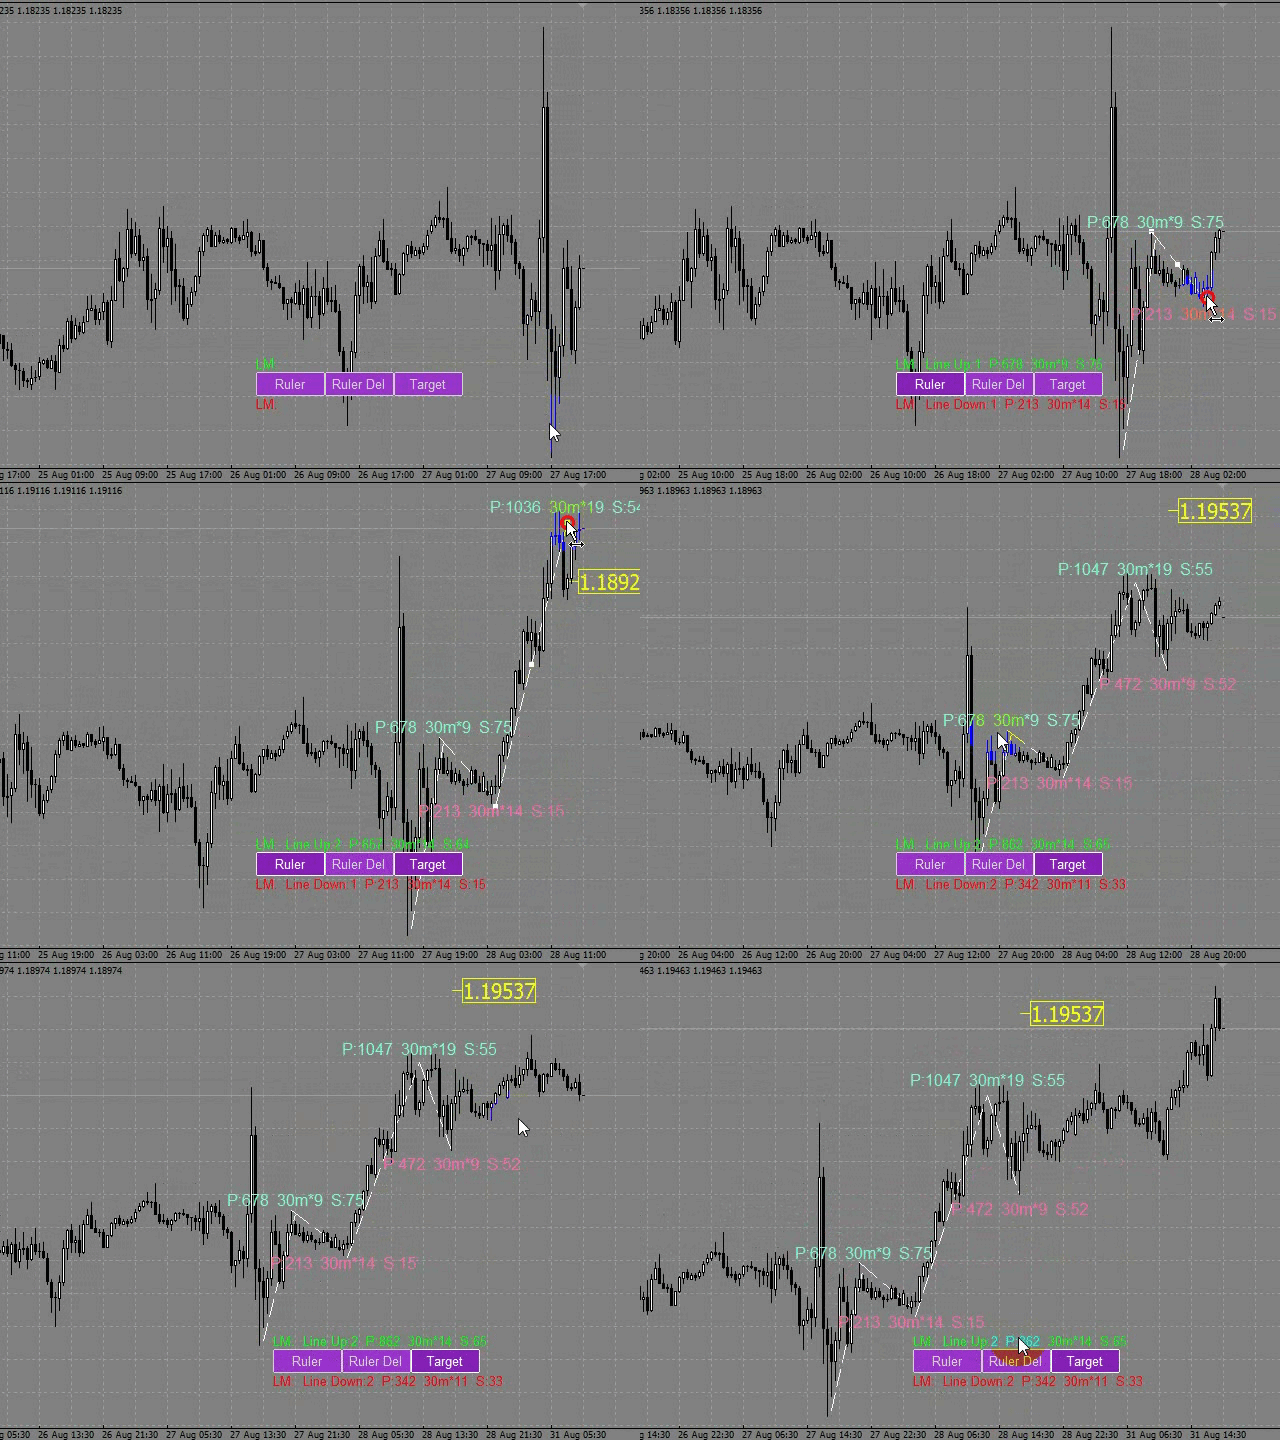
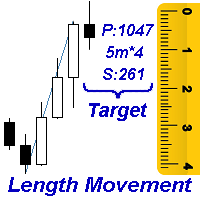
Measures the length of the selected movement in points, shows the duration of the movement, as well as the speed of movement. Outputs the average value of each dimension.
It is designed to calculate the expected target based on typical market movements.
The intended goal will provide information about the ratio of the stop size to the possible profit and will allow you not to open positions with a small expected profit.
It will also help you determine the point at which it is more logical to close a position. 

Note: the MT5 tester is not designed for full-fledged work with graphic objects, so drawing in the tester is slower than in the real situation.
Lines are selected with 1 mouse click.


Building a line
: click the "Ruler" button and draw a line (clicking the mouse - the first point of the line, where the mouse is released - the second point of the line).
(Lines, text placemarks, and the goal are only visible on the time graph where they were drawn.)

Line changes: select a line and drag it with the mouse.
When you rebuild a line, the value of the text label and the goal (if the goal is enabled) will change immediately.

Delete all measurement lines: click "Ruler_Del". During the number of seconds selected in the "Ruler_Del_Cancel" setting, the "Ruler_Del" button can be clicked to cancel, and the "Ruler_Del" command will be canceled.

Delete the selected measurement lines: select the measurement line and press "delete" on the keyboard. The text label from the measurement line will also be removed, and the goal will change.

Building a goal: the "Target" button sets/deletes a goal. To calculate the goal, you need at least two lines in different directions.

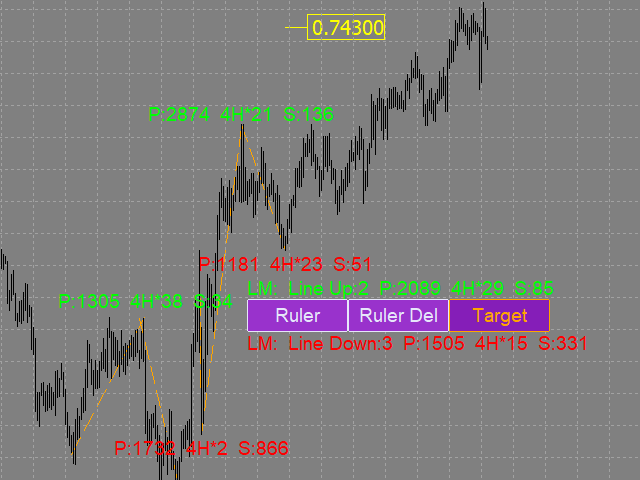
Line_Metrics - Text label of the line.
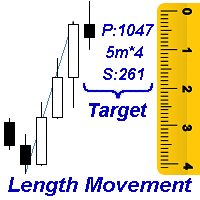
For example, we have an ascending line with the parameters: P:817 4H*10 S: 81. the line Length is 817 points, the line is drawn on a 4-hour chart, based on 10 candles, (that is, the time of the movement(line) is 40 hours).
The speed of the motion in paragraphs 81. This means that on average, each candle participating in the line construction passed 81 points.

Average_Lines_Metrics - Text label for "average values". LM: Line Up:3 P:1586 4H*40 S: 39 means that the text label of the average value is calculated based on 3 ascending measuring lines Line Up: 3 (measuring lines of 0 points, lines of other time periods and tools are not taken into account in the calculations).
The average line length in points is 1586 points P:1586.
The graph where the lines are counted is 4-hour 4H*40. On average, the line consists of 40 4h*40 candles.
On average, the price passes 39 points S:39 per candle.

The size of buttons and text labels for "average values" depends on the font in the Button_Font setting and its size in the Button_FontSize setting.
On-screen buttons can be dragged with the mouse.
You can assign keyboard shortcuts to on-screen buttons (a-Z, 0-9).

Settings

  • Ruler_key - hotkey for drawing a measuring line (you can assign (a-Z, 0-9)) .
  • Ruler_Del_key - hotkey for deleting all measuring lines (you can assign (a-Z, 0-9)) 
    (measurement lines are deleted after the pause selected in the Ruler_Del_Cancel setting).
  • Target_or_Target_Del_key - hotkey for setting / deleting a goal (a-Z, 0-9)
  • (you need at least two lines in different directions to set a goal).
  • Ruler_Del_Cancel - time to cancel the Ruler_Del_key command (in seconds).
  • Button_Background_Color - buttons background color (if Button_Background_Color=clrNONE, the buttons background is the same as the graph background color).
  • Button_Pressed_Color - color of the text and border of the Ruler button when pressed.
  • Line_Metrics_Indent - indent of the text label from the measuring line (in points).
  • Line_Metrics_Orientation - displays the labels of measuring lines vertically / horizontally / diagonally.
  • Target_Orientation - left-hand / right-hand placemark of the goal.
  • Here are the most important settings. You can also change the following characteristics for measuring lines, buttons, and text labels: color, thickness, font, and font size.
    Recommended products
    RETAILBERG FOOTPRINT CHART PRO — Order-Flow Workspace for MetaTrader 5 Version 7.00  |  Professional System  |  31 tools  |  One chart A full 150-page illustrated User Manual is included. Please read the full manual to understand this feature packed footprint chart elements and ui. https://www.mql5.com/en/blogs/post/777982 DEMO / STRATEGY TESTER — PLEASE READ FIRST
    A Média Móvel é um indicador que faz parte da Análise Técnica. Com ela, é possível identificar o equilíbrio dos preços no mercado, observando tendências de alta, neutra ou baixa. Este indicador customizado traz opções extras pera definir o método de cálculo podendo-se esclolher entre SMA,EMA,SSMA,LWMA,JJMA,JurX,ParMA,T3,Vidya,AMA,HULL MA. Também conta com varias opções para escolher o método de cálculo para o preço base a ser usado no cáculo da média.
    OB MTF Gold EA — Multi-Confirmation Trend System for XAUUSD Trading gold successfully means filtering out the noise that catches most single-signal systems off guard. This EA doesn't rely on one indicator — it only opens a trade when three independent confirmations align on the same direction at the exact same moment: RSI Momentum Trend — sticky trend-state filter that ignores weak, indecisive momentum Range Breakout (adaptive ATR channel) — waits for a genuine dip-and-return price action
    IC Flat Pro The True Math
    Aruncharan Ganapathy Sivakumar
    IC FLAT PRO – THE TRUE MATH   Early Adopter Pricing Secure IC FLAT PRO – THE TRUE MATH at the current launch price. Once the first 10 purchases  have been sold, the price will increase by USD 300 . Institutional-Grade Market Structure Analysis for MetaTrader 5 IC FLAT PRO – THE TRUE MATH is a premium institutional-grade market structure indicator developed for serious traders who demand precision, consistency, and high-quality trade opportunities. Built using advanced mathematical algorithms
    PassPropFirm MT5
    Yana Korchevska
    Pass Prop Firm is a high-frequency trading Expert Advisor specifically designed to help traders pass the prop firm evaluation phase (such as the HFT Challenge). With powerful scalping and smart order management logic, this EA aims to hit profit targets quickly and efficiently—ideal for traders seeking to meet demo account goals in record time. MT4 version myfxbook.com/portfolio/pass-prop-firm-mt5/11625306 myfxbook.com/portfolio/pass-prop-firm-mt4/11622480 Currency Pair : Optimized for DE40 (DAX
    QM gold pattern
    Patcharapon Saelim
    QM Gold Pattern EA Backtest results from 01/10/2021 to 01/10/2026 QM GOLD – QM HYBRID PRO EA V1.0 MT5 Expert Advisor trading based on the Quasimodo (QM) patternAn EA for MetaTrader 5 that automatically identifies QM patterns. It waits for the price to pull back to the zone before entering a trade. Every order includes a Stop Loss (SL), and lot sizes are automatically calculated based on risk. Why choose this EA? Not Martingale, Not Grid No
    "Impulses and Corrections 5" is created to help traders navigate the market situation. The indicator shows multi-time frame upward and downward "Impulses" of price movements. These impulses are the basis for determining the "Base" , which is composed of zones of corrections of price movements, as well as "Potential" zones for possible scenarios of price movement. Up and down impulses are determined based on a modified formula of Bill Williams' "Fractals" indicator. The last impulse is always "U
    Iconic BTC AI
    Maurice Prang
    5 (1)
    ICONIC BTC AI+ | SYNAPSE.PHENOTYPE S6 ENGINE (Version 15.00) Launch Pricing Current price: 599 USD. Available licenses: 10. Next price tier: 699 USD. Final price: 1699 USD. Early access pricing reflects the current phase of the product release. Pricing will step up as the license contingent closes and subsequent tiers open. There is no scheduled date after which the current price remains available. Bitcoin is not a Forex pair. It does not behave like gold, does not respect session boundaries th
    ClusterSecondForex
    Rafil Nurmukhametov
    4.67 (3)
    The utility allows you to build different types of graphs: Seconds chart from 1 second to 86400 seconds Tick chart from 1 tick and above The volume chart Delta chart Renko chart Range chart Product demo https://www.mql5.com/ru/channels/clustersecondforex Built-in indicators for volumetric analysis: daily market profile and market profile of the selected timeframe, Cluster Search Imbalance VWAP Dynamic POC, VAH, VAL the profile depth of the market vertical volume with various display options, del
    TLM Gold Master Trading System A Professional Gold Trading Decision & Signal System for MetaTrader 5 The TLM Gold Master Trading System is a specialized MT5 indicator designed for traders who want a structured, multi-factor approach to analyzing Gold (XAUUSD). Instead of relying on a single indicator, the system combines trend direction, higher-timeframe confirmation, market volatility, momentum, pullback conditions, automatic support/resistance zones, and ATR-based price-space analysis into
    Pulsar Terminal MT5
    Astralys LLC
    5 (6)
    Pulsar Terminal is a full trade manager for MetaTrader 5: risk-based position sizing, one-click execution, multi-level take profit, automatic trailing stop and prop firm protection, in a dedicated visual interface connected to your MT5 account. User & Installation Guide (MQL5 Blog) Important - Running Conditions 1) MetaTrader 5 must be open on the same PC as the companion app (localhost-only connection via the EA) for actions to be executed. 2) After closing Pulsar Terminal, your SL/TP will only
    AI Capital Gold Edge Scalp 1. About This Project AI Capital Gold Edge Scalp is a MetaTrader 5 Expert Advisor developed with a focus on XAUUSD scalping and structured, rule-based trade execution. I have spent a significant amount of time developing this project, reviewing the trading logic and repeatedly refining individual parts of the system. One area that became particularly important to me during development was entry location. Instead of reacting to every price movement, the EA evaluates sev
    SolarTrade Suite Financial Robot: LaunchPad Market Expert - designed to open trades! This is a trading robot that uses special innovative and advanced algorithms to calculate its values, Your Assistant in the World of Financial Markets. Use our set of indicators from the SolarTrade Suite series to better choose the moment to launch this robot. Check out our other products from the SolarTrade Suite series at the bottom of the description. Do you want to confidently navigate the world of inves
    Mine Farm
    Maryna Kauzova
    Mine Farm is one of the most classic and time-tested scalping strategies based on the breakdown of strong price levels. Mine Farm is the author's modification of the system for determining entry and exit points into the market... Mine Farm - is the combination of great potential with reliability and safety. Why Mine Farm?! - each order has a short dynamic Stop Loss - the advisor does not use any risky methods (averaging, martingale, grid, locking, etc.) - the advisor tries to get the most
    VR Grid Mt5
    Vladimir Pastushak
    3.25 (8)
    The VR Grid indicator is designed to create a graphical grid with user-defined settings. Unlike the standard grid , VR Grid is used to build circular levels . Depending on the user's choice, the step between the round levels can be arbitrary. In addition, unlike other indicators and utilities, VR Grid maintains the position of the grid even when the time period changes or the terminal is rebooted. You can find settings, set files, demo versions, instructions, problem solving, at [blog] You can
    FREE
    Multi-Timeframe Heiken Ashi (Smoothed with Dashboard) Professional Market Structure Visualization with Weighted Confluence Scoring Transform your trading with crystal-clear multi-timeframe analysis. This indicator combines smoothed Heiken Ashi candles with an intelligent weighted scoring system to give you unprecedented clarity in any market condition. YOUR TRADING QUESTIONS – ANSWERED INSTANTLY: 1. What's the REAL trend direction? Dashboard Reveals:   Higher timeframe (MN1, W1, D1, H4) trend a
    Gold Zenix
    Md Billal Hossain
    Introducing ZENIX EA — Your Elite Gold Market Companion Welcome to ZENIX — the next-generation Expert Advisor crafted exclusively for XAU/USD (Gold). ZENIX isn’t just an automated trading system — it’s a precision engine built with one mission: To dominate the gold market with intelligence, adaptability, and power. ***Limited Pricing - Ending Soon*** The next price increases to     $200.46 Don't miss this opporthunity to secure "Zenix" at the discount price.  The price will increase
    Money Flow Profile MT4  HERE   Use Guide Here our more valuable tools SMC Trend Trading   ,  Easy SMC Trading  ,  Institutional SMC Architect Volume Analysis Tools  ,  Volume flow Profile  ,  Market volume profile  , FVG with Volume  , Liquidity Heatmap Profile  ,  Volume Spread Analysis  Master Edition is a professional-grade analytical tool designed to visualize market structure through the lens of volume and money flow. Unlike standard volume indicators, this tool displays a Daily Vo
    Cumulative Volume Delta MA-X MTF with Gradient Momentum This indicator performs multi-timeframe volume delta analysis for MetaTrader5. It calculates the net difference between buying and selling pressure by analyzing tick or real volume data, providing a visual representation of order flow sentiment. Indicator Logic and Features The indicator uses a mathematical approach to volume analysis: Data Sourcing: Supports both Real Volume (for Exchange assets) and OHLC Wick Proxy calculations (for Forex
    Gold Dashboard Trend Indicator Multi-Timeframe Trend, Volatility & Momentum Analysis with Manual S/R Context Gold Dashboard Trend Indicator is a rule-based technical analysis tool designed to identify potential trend-continuation opportunities by combining current-timeframe trend direction, higher-timeframe confirmation, EMA slope, ATR-based volatility analysis, pullback detection, momentum confirmation, and optional manual Support & Resistance context. The indicator is designed with a strong fo
    TRINITY TREND — One EA, Three Trend Markets (Bitcoin, Ethereum, USDJPY) AT A GLANCE (MT5 backtest — historical, not a live record) - One EA, three low-correlation trend markets from one BTCUSD H4 chart: BTCUSD, ETHUSD and USDJPY Donchian breakouts in the SMA200 direction - Long window (2019.01-2026.06, tester-modelled ticks): Standard (default) +1,021% / Profit Factor 1.91 / equity drawdown 14.1% - 100% real-tick check (2026.01-2026.08, 38 trades): Standard Profit Factor 1.25 / equity drawdown
    GOD SCALPER The Strategy Stays Private for a Reason. Some things are better understood than exposed. God Scalper is built around a proprietary trading methodology, and there is a reason we don't publish its complete internal logic. In trading, an advantage can depend not only on how a strategy works, but also on how it is implemented, when it acts, and how its conditions interact with changing market environments. Making every detail public could make the methodology easier to copy, reverse-engi
    Gold Scalper Ultimate – Automated Scalping Expert Advisor for MT5 Gold Scalper Ultimate is an automated Expert Advisor developed for short-term trading and scalping strategies in the Forex market. The EA uses ATR-based trade management and optional Heikin Ashi analysis to identify trading opportunities and manage positions automatically. It is designed for fast market environments and supports flexible configuration for different trading styles and risk preferences. Trading Logic The EA analyze
    Fabii Volatility ATR Percentile
    Fabien Georges Andre Guillemaud
    See if Average True Range (ATR) volatility is quiet or stretched, as a 0 to 100 rank. No repaint. Any pair, any timeframe. On your chart in 2 minutes. Free demo in the Strategy Tester. Get more indicators here Baselines, volatility filters and oscillators. No repaint. Why you need it A raw ATR value such as 0.0040 tells you little. Is that high for this pair right now, or normal? To know, you have to scroll back through weeks of bars and guess. So you enter a trade in a market that is asleep,
    King Darwin
    MeanFX
    5 (1)
    A premium gold trading solution KING DARWIN  was designed to help traders succed with a long-term vision of the market, with a very simple concept, discipline and respect: only one position at a time, predefined Stop Loss and Take Profit on every trade, a maximum of one trade per day, and no unnecessary overtrading. Darwinex Ready - This EA was first conceived for trading Darwinex or Standard accounts - Mode 1 LIVE TEST PASSED LAUNCH PRICE –   Don't miss this opportunity, increases by 10$ afte
    ClusterSecond
    Rafil Nurmukhametov
    4.78 (32)
    The utility allows you to build different types of graphs: Seconds chart from 1 second to 86400 seconds Tick chart from 1 tick and above The volume chart Delta chart Renko chart Range chart Demo version of the utility https://www.mql5.com/ru/channels/clustersecond Built-in indicators for volumetric analysis: daily market profile and market profile of the selected timeframe, Cluster Search Imbalance VWAP Dynamic POC, VAH, VAL the profile depth of the market vertical volume with various display op
    Candle hunter
    Ruslan Khasanov
    5 (1)
    Indicator for graphical analysis. Marks the main Japanese candlestick patterns on the chart. At the moment, the following set of patterns is available to the trader:  - Bearish/Bullish Abandoned Baby;  - Bearish Advance Block;  - Bearish Deliberation;  - Bearish/Bullish Belt Hold;  - Bearish/Bullish Engulfing;  - Bearish Shooting Star;  - Bearish Evening Star;  - Bearish Evening Doji Star;  - Bearish/Bullish Doji Star;    - Bearish/Bullish Tri-Star;  - Bearish Hanging Man;  - Bearish/Bullish Ha
    Smart Trade Guard Pro
    Gumpha Kot-snavayothachoti
    Smart Trade Guard Pro is an essential trade management utility designed for professional manual traders, scalpers, swing traders, and prop firm participants. It automates profit-taking, trade protection, and trailing stop execution in real-time, eliminating emotional decision-making and protecting your capital. Because the utility operates strictly on real-time tick price movements (Points-based logic) rather than bar closes, it is fully compatible with ANY Timeframe (M1 to Monthly) and ANY Fi
    Buyers of this product also purchase
    Trade Assistant MT5
    Evgeniy Kravchenko
    4.43 (216)
    It helps to calculate the risk per trade, the easy installation of a new order, order management with partial closing functions, trailing stop of 7 types and other useful functions. Additional materials and instructions Installation instructions - Application instructions Line function -   shows on the chart the Opening line, Stop Loss, Take Profit. With this function it is easy to set a new order and see its additional characteristics before opening.   Risk management  - The risk calculation
    Forex Trade Manager MT5
    InvestSoft
    4.98 (687)
    Trade Manager MT5 is an advanced position size calculator and trade management tool for MetaTrader 5, designed to help traders plan trades faster, control risk more precisely, and manage open positions directly from the chart. It combines order placement, risk based lot calculation, Stop Loss and Take Profit management, Break Even, Trailing Stop, Partial Close, Equity Protection, and external trade management in one panel. Whether you trade forex, indices, metals, commodities, crypto, or future
    Telegram to MT5 MultiChannel Copier
    Sergio Marquez Uroz
    4.65 (20)
    Telegram to MT5 Multi-Channel Copier   automatically copies trading signals from your Telegram and Discord channels straight to MetaTrader 5. No bots, no browser extensions, no manual copying. A signal arrives in Telegram or Discord and the EA opens the trade in your terminal within seconds. And before you copy a channel, the built-in backtester shows you what that channel would have done in your account. The product has two components: a Windows application that listens to your Telegram channel
    ================================================================================ POC BREAKOUT - V20.72. Full Professional Grade Toolkit ================================================================================ POC Breakout is a full MetaTrader 5 trading dashboard for discretionary traders who want breakout signals, Point of Control (POC) context, volume profiles, order flow, market structure, news, alerts, and advanced trade planning in one professional workspace. Attached directly to you
    FarmedHedge Pair Trading Dashboard
    Tanapisit Tepawarapruek
    5 (6)
    Farmed Hedge Yield Farming | All Markets (Manual - Hybrid - Semi/Automated EA) VERIFIED TRADING RESULTS - Farmed Hedge Yield Axi Copy:  https://www.mql5.com/en/signals/2356376 - Farmed Hedge Yield Exn Copy:   https://www.mql5.com/en/signals/2356404 - Farmed Hedge Yield V Copy:  https://www.mql5.com/en/signals/2357156 IMPORTANT NOTICE: FarmedHedge is a MANUAL-FOCUSED TRADING UTILITY ,not a fully automated EA. Results shown on this Signal include manual trades and overall strategic management.
    Copy Telegram signals with your own trading rules Telegram to MT5 Signal Trader automatically copies text-based trading signals from public and private Telegram channels and groups into MetaTrader 5. Manage multiple providers and MT5 accounts from one desktop app, with individual risk and trade settings for each provider . No Telegram bot or API setup needed for copying. Simply sign in with your own Telegram account by phone or QR code and select the channels or groups you have already joined. Y
    TradePanel MT5
    Alfiya Fazylova
    4.88 (170)
    Trade Panel is a multi-functional trading assistant. The app contains over 50 trading functions for manual trading and allows you to automate most trading tasks. Application instructions: https://www.mql5.com/en/blogs/post/756482 Trial version of the application for a demo account: https://www.mql5.com/en/blogs/post/750865 How to install the application: https://www.mql5.com/en/blogs/post/756239 How to test the application in visual mode: https://www.mql5.com/en/blogs/post/770277 How to install
    Master Your Trading Discipline   Stop losing your hard-earned gains to overtrading and emotional decisions. The Discipline Tool is your ultimate trading assistant, ensuring strict risk management in real-time. Key Protection Features: Advanced Drawdown Defense : Automatically halts trading if your daily drawdown exceeds a preset threshold (percentage or dollar amount). Real-Time Equity Lock : Safeguard profits by referencing peak equity, ensuring drawdown stays within control. Hard Profit Target
    Power Candles Strategy Scanner - Self-Optimizing Multi-Symbol Setup Finder Self-optimizing settings work one chart at a time, and finding where they pay off right now means opening chart after chart. Power Candles Strategy Scanner runs the same self-optimizing engine as the Power Candles indicator on every symbol in your Market Watch, side by side. One panel ranks where it pays off: the winning strategy per symbol, its optimized Stop Loss and Take Profit. An alert fires the moment a fresh signal
    Entry In The Zone with SMC Multi Timeframe is a real-time market analysis tool based on Smart Money Concepts (SMC), designed to analyze market structure, price direction, and key trading zones. It supports both Single-Timeframe and Multi-Timeframe Analysis, providing a clearer view of overall market structure across multiple timeframes, with real-time BUY / SELL signals designed with a strict focus on No-Repaint principles.   The signals are designed to help filter unclear setups and evaluate tr
    EasyInsight AIO MT5
    Alain Verleyen
    4.92 (12)
    EASY Insight AIO – All-In-One Power for AI-Driven Trading Want to skip the setup and start scanning the entire market – Forex, Gold, Crypto, Indices, and even Stocks – in seconds? EASY Insight AIO is the complete plug-and-play solution for AI-powered trade analysis. It includes all core Stein Investments indicators built-in and automatically exports clean, structured CSV files – perfect for backtesting, AI prompts, and live market decision-making. No need to install or configure indicators manu
    The product will copy all telegram signal to MT5 ( which you are member) , also it can work as remote copier.  Easy to set up, copy order instant, can work with almost signal formats, image signal,  s upport to translate other language to English Work with all type of channel or group, even channel have "Restrict Saving Content", work with  multi channel, multi MT5 Work as remote copier: with signal have ticket number, it will copy exactly via ticket number. Support to backtest signal. How to s
    Trade Indicator Assistant   is a powerful MT5 utility designed to turn indicators into automated trading systems. Its main feature is the ability to automatically detect an indicator’s   BUY and SELL signal buffers , without requiring you to know the buffer numbers, search through indicator settings, or modify the indicator source code. Bonus Indicator:   After purchasing Trade Indicator Assistant, contact me to receive   Trade Signal Pro   completely free as a bonus indicator. [Download Demo V
    The Patch
    Mian Rameez Ali
    The Patch It never opens a trade. It walks behind the ones that did. Every open position, every pending order — checked twice a second for the one thing that's easy to forget: a stop, a target. Found bare, it doesn't ask. It writes the missing number in, measured in points from wherever the position began, and moves on to the next. No strategy, no opinion on direction. Just the quiet assumption that nothing should ever sit on the market unprotected — not because someone decided it shouldn't,
    EA Overfitter
    Stephen J Martret
    5 (1)
    That backtest looks great. But will it still be making money tomorrow, next week, next month? EA Overfitter re-runs your EA on 100 price histories it has never seen. One score tells you if the edge is real. A backtest tells you what an EA did on one price history — the one that happened to occur. What you cannot tell from it is how much of that result was the strategy and how much was the particular path. EA Overfitter answers that. It builds up to 100 synthetic price histories your EA has n
    Floor Watch
    Syed Tauqeer Hussain Shah
    Floor Watch One number, watched every thirty seconds: how far equity has fallen since the day began — or since its highest point, if it's told to trail the peak instead of the open. Cross the line and it doesn't argue. Every open position closes, every pending order vanishes, and anything that slips through afterward gets shut the moment it appears. Not asked. Removed. The floor holds until the clock turns 5 AM Pakistan time — then, and only then, does the day start over. One rule. No except
    Buy once. Get all my MT4 and MT5 indicators - available now and released in the future - at no extra cost. Contact me after purchase for instructions to receive them. The price is planned to rise by 50$ after every 10 purchases, up to 999$. The Market price at checkout applies. Keep the indicator you trust. Automate the work around it. Your signal. Your rules. Your execution. Already have an MT5 indicator you rely on, but still need to watch the chart, wait for a signal, calculate the lot, plac
    AI Trading Assistant | Discord/Telegram → MetaTrader 5 Automation An advanced automation framework that enables natural language trade instructions sent from Discord or Telegram to be executed automatically on MetaTrader 5 using n8n workflows and a custom Expert Advisor. This solution integrates modern workflow automation with MetaTrader 5, allowing users to send trade instructions such as: “buy EURUSD 1% risk 30 pip SL 3R TP” “sell GBPUSD now 2% 20 SL 60 TP” “buy limit EURUSD at 1.0850 with 1%
    YuClusters
    Yury Kulikov
    4.93 (43)
    Attention: You can view the program operation in the free version  YuClusters DEMO .  YuClusters is a professional market analysis system. The trader has unique opportunities to analyze the flow of orders, trade volumes, price movements using various charts, profiles, indicators, and graphical objects. YuClusters operates on data based on Time&Sales or ticks information, depending on what is available in the quotes of a financial instrument. YuClusters allows you to build graphs by combining da
    Premium Trade Manager - The Trade Panel With a Coach Built In Premium Trade Manager puts a trading coach inside your chart, with a full execution engine underneath it. Set the trade up the way you always do, then let Max, your AI trading coach, read that exact setup against your live account and give you a straight verdict before you commit: is the stop disciplined, is the risk sane, is a high-impact release minutes away, are you near a prop-firm limit. Below sits the engine that runs everything
    Quant AI Agents
    Ho Tuan Thang
    5 (1)
    Quant AI Agents are independent trading Expert Advisors. Instead of trading using a fixed strategy like other conventional EAs, Quant AI Agents   is a   multi-agent AI trading framework   that turns natural-language strategy prompts into live.  WANT THE SAME RESULTS AS MY LIVE SIGNAL?   Use the exact same brokers I do:   IC MARKETS , IC TRADING   .  Unlike the centralized stock market, Forex has no single, unified price feed.  Every broker sources liquidity from different providers, creating un
    VirtualTradePad PRO SE MT5 — professional trading control center for MetaTrader 5 VirtualTradePad PRO SE is a premium chart-based trading panel and trade-management workspace for MetaTrader 5 . It is designed for traders who want faster execution, clearer position control, structured trade management, visual level planning and a professional workflow directly from the chart. This is not only a BUY / SELL panel. PRO SE combines manual trading, pending orders, position management, partial exits, b
    Daily Trading Limiter
    AL MOOSAWI ABDULLAH JAFFER BAQER
    5 (8)
    • Please test the product in the Strategy Tester before purchasing to understand how it works. • If you face any issues, contact me via private message—I’m always available to help. • After purchase, send me a screenshot of your order to receive a FREE EA as a gift. Daily Trading Limiter — the rule you cannot break Every trader knows the number. Three trades. Two percent. One bad day and stop. And every trader has watched themselves take the fourth trade anyway. The problem was never knowing th
    FUTURES ORDERFLOW FOOTPRINT CHART Professional OrderFlow EA for MetaTrader 5 Version 1.01| Professional tool for real traders | Institutional-Grade Visualization STRATEGY TESTER USERS - PLEASE SELECT EVERY REAL TICK WHEN TESTING AND YOU HAVE DOWNLOADED HISTORICAL DATA. IF YOU SEE A WAITING SCREEN AND IT IS NOT DOWNLOADING, IT MEANS YOU HAVE LOW HISTORICAL DATA. TRY 1 MIN AND 5 MIN FIRST ON 1 DAY DATA. ONE DAY DATA SHOULD BE THE NEWEST AND MOST CURRENT DATE. PLEASE WAIT UNTIL THE MARKET HAS ROL
    Trading Chaos Expert
    Hennadii Stanilevych
    5 (11)
    This software has no equals in the world and represents a universal trade "console" covering trading signals, automated market entry, setting of Stop Loss and Take Profit, as well as Trailing Profit for multiple trades at the same time in a single open window. Intuitive control of the Expert Advisor in "three clicks" ensures a comprehensive use of all its functions on different computers, including tablets PCs. Interacting with additional signal indicators that mark the chart to give a real mark
    Copy your MT5 trades to Interactive Brokers You keep using MT5. Every order you open or close is sent to your IB account. In real time. No coding. No changes to your strategy or EA. Try it first Rent 1 month: $30. Test on a live or paper account. What it does Real-time copying: same direction, reverse, or one side only. Map any MT5 symbol to any IB symbol. Set a lot ratio for each. Forex, Futures, Stocks, CFDs, Metals and Crypto. Position sync: both accounts checked, any difference fixed. Optio
    Quant Panel
    Kevin Craig E Gittins
    Quant Panel is a strategy analysis utility for MetaTrader 5. It helps traders review several Expert Advisors or trading strategies running on the same account. The panel groups closed positions by Expert Advisor comment or magic number and calculates each strategy's results separately. You can compare strategy performance, review individual drawdowns and export detailed reports from one dashboard. Independent strategy analysis Each strategy has its own virtual starting balance and closed-trade b
    EA Slipstream
    Stephen J Martret
    5 (1)
    Your backtest filled every order at the price it asked for. Your account does not. EA Slipstream measures what execution costs your EA, using your own fills, slippages and spreads to show you the true performance of your EA. A backtest prices every trade at the level the EA named. In live trading a pending order fills at whatever price is available when it triggers, a stop closes wherever the market is when it is hit, and the spread at that moment is whatever the account was quoting. The differ
    Dynamic Fibonacci Grid
    Tsvetan Tsvetanov
    5 (1)
    Introducing the latest version of the Dynamic Fibonacci Grid Dashboard for MT5. Now packed with many new features, this new dashboard transforms your trading experience and allows you to see the market and the price action from a completely different perspective. Discover new possibilities with simultaneous analysis of multiple timeframes covering multiple symbols. User-friendly interface for manual trading and management of positions and an expanded ability to apply predefined automated strate
    Ultimate Extractor
    Clifton Creath
    5 (7)
    Ultimate Extractor - Professional Trading Analytics for MT5 *****this is the local HTML version of Ultimate Extractor. !!!!!it is not compatible with Cloud!!!! For the online version please reach out to me directly****** Ultimate EA manager also now available when you use cloud pro and above for free!! Ultimate Extractor transforms your MetaTrader 5 trading history into actionable insights with comprehensive analytics, interactive charts, and real-time performance tracking. What It Does Automa
    More from author
    The indicator draws support and resistance lines on an important part of the chart for making decisions. After the trend line appears, you can trade for a breakout or rebound from it, as well as place orders near it. Outdated trend lines are deleted automatically. Thus, we always deal with the most up-to-date lines. The indicator is not redrawn . Settings: Size_History  - the size of the calculated history. Num_Candles_extremum  - the number of candles on each side of the extremum. Type_Arrow
    Turn
    Pavel Verveyko
    The indicator shows the market turning points (entry points). Reversals allow you to track rebound/breakout/testing from the reverse side of the lines of graphical analysis or indicators. Reversals can be an independent signal. The indicator allows you to determine reversals taking into account the trend and without it. You can choose a different period for the movement preceding the reversal, as well as the volatility coefficient. When plotting reversals, the indicator takes into account volati
    Length Movement
    Pavel Verveyko
    5 (1)
    Measures the length of the selected movement in points, shows the duration of the movement, as well as the speed of movement.   Outputs the average value of each dimension. It is designed to calculate the expected target based on typical market movements. The intended goal will provide information about the ratio of the stop size to the possible profit and will allow you not to open positions with a small expected profit. It will also help you determine the point at which it is more logical to c
    The indicator allows you to quickly switch from one instrument to another, from one time period to another using the keyboard or buttons on the monitor. Each command can be assigned a hot key from 0-9, a-Z (case-insensitive) and VK_OEM_COMMA ("<" on the keyboard) and VK_OEM_PERIOD (">" on the keyboard). This can help you to operate the maximum number of instruments that are available at your broker, analyze more instruments/periods in less time. This product cannot be tested in the tester , beca
    Ratio TP SL
    Pavel Verveyko
    5 (1)
    This indicator allows you to measure the profitability of each specific transaction (the ratio of Stop and Profit). The indicator allows you to adjust the ratio by step size and number of steps. You can build an unlimited number of ratios to compare the risks from different movements. Note: in MT4, the number of horizontal lines in a single ratio cannot exceed 32. Building a line : click the " Ratio " button and draw a line (mouse click - the first point of the line, where the mouse is release
    Corporate Report
    Pavel Verveyko
    5 (1)
    The script displays info about the share's corporate reports and dividends. The data is downloaded from   investing.com : Report date Profit per share (EPS) Revenue Market capitalization Amount of dividends Date of payment of dividends Dividend income The product cannot be tested in the tester (since it is not possible to receive data from the Internet). Before launching:  Add 2   URL   https://ru.investing.com/earnings-calendar/Service/getCalendarFilteredData  and   https://ru.investing.com/di
    Channel FTF
    Pavel Verveyko
    The Envelopes indicator determines the presence of a trend or flat. It has 3 types of signals, shows the probable retracement levels and levels of the possible targets. The Fibonacci coefficients are used in the indicator's calculations. Signals (generated when touching the lines or rebounding from lines): Trend - the middle line of the Envelopes has a distinct inclination; the lines below the channel's middle line are used for buy trades, the lines above the middle line and the middle line itse
    Mr Big
    Pavel Verveyko
    The indicator shows and highlights the chart candles, which are formed as a result of large players entering the market in large volumes. Such candles can also be formed after achieving a certainty on the market, when most of the participants hold positions in the same direction. The movement is likely to continue in that direction after such candles. The indicator highlights the significant candles from the existing ones on the chart; The indicator allows identifying the trends based on candles
    Splash
    Pavel Verveyko
    The indicator identifies the most suitable moment for entering the market in terms of market volatility, when the market has the strength to move (the signal is indicated by an arrow under the candle). For each of the signals, the presence of trends on the current and higher timeframes is determined, so that the signal is in the direction of the majority of positions opened on the market (denoted near the signal by abbreviations of timeframes with a trend present). The signal appears after the c
    The indicator displays the key support and resistance levels on the chart. The significance of these levels lies in that the price may reverse or strengthen the movement when passing such levels, since they are formed as a consequence of the natural reaction of market participants to the price movement, depending on which positions they occupied or did not have time to occupy. The psychology of the level occurrence: there always those who bought, sold, hesitated to enter or exited early. If the
    This indicator is a multitimeframe trading strategy. It has the levels for stop loss, take profit and entry point. The order level can also be set manually. The indicator uses the regularity of the market, which manifests itself on all instruments, and does not require adjustment of the parameters. The strategy uses a proprietary approach to determining: trend, volatility, hierarchy of timeframe significance, the size of the history period (the number of candles), which is important for making a
    Trend Sync
    Pavel Verveyko
    5 (1)
    The indicator shows the trend of 3 timeframes: higher timeframe; medium timeframe; smaller (current) timeframe, where the indicator is running. The indicator should be launched on a chart with a timeframe smaller than the higher and medium ones. The idea is to use the trend strength when opening positions. Combination of 3 timeframes (smaller, medium, higher) allows the trend to be followed at all levels of the instrument. The higher timeframes are used for calculations. Therefore, sudden change
    The indicator detects important peaks and troughs (extremes) on the chart. These points can be used to plot support/resistance levels and trend lines, as well as any other graphical analysis. These points can serve as reference points for setting trading orders. The indicator does not redraw . Settings: Size_History  - the size of the calculated history. Num_Candles_Right  - number of candles to the right of the peak or trough. Num_Candles_Left  - number of candles to the left of the peak or
    Running along Lines
    Pavel Verveyko
    3 (2)
    The indicator draws support and resistance lines on an important part of the chart for making decisions. After the trend line appears, you can trade for a breakout or rebound from it, as well as place orders near it. Outdated trend lines are deleted automatically. Thus, we always deal with the most up-to-date lines. The indicator is not redrawn . Settings: Size_History  - the size of the calculated history. Num_Candles_extremum  - the number of candles on each side of the extremum. Type_Arrow
    Key Volumes
    Pavel Verveyko
    1 (1)
    The indicator shows key volumes confirmed by the price movement. The indicator allows you to analyze volumes in the direction, frequency of occurrence, and their value. There are 2 modes of operation: taking into account the trend and not taking into account the trend (if the parameter Period_Trend = 0, then the trend is not taken into account; if the parameter Period_Trend is greater than zero, then the trend is taken into account in volumes). The indicator does not redraw . Settings History_S
    This trading system is based on market impulses of varying complexity.   To generate a signal, the indicator uses the moments when the direction of the pulse and the necessary section of the trend coincide. The indicator also takes into account the current market volatility. Stop_loss tags can be set with the parameter "0" or "1", then Stop_Loss will take into account market volatility.   Take_Profit tags can be set with the parameter "0", then Take_Profit will take into account market volatil
    Indexes
    Pavel Verveyko
    The stocks that make up the index are one of the drivers of the movement. Analyzing the financial performance of all elements of the index, we can assume further development of the situation. The program (script) displays corporate reports of shares that are part of the index selected in the settings.   "Indexes" cannot be tested in the tester (since there is no way to get information from the Internet). Information is downloaded from the site investing.com: Report Date Earnings per share (E
    Fibo World
    Pavel Verveyko
    The indicator builds a graphical analysis based on the Fibonacci theory. Fibo Fan is used for the analysis of the impulses and corrections of the movement. Reversal lines (2 lines at the base of the Fibonacci fan) are used to analyze the direction of movements. The indicator displays the of 4 the target line in each direction. The indicator takes into account market volatility. If the price is above the reversal lines, it makes sense to consider buying, if lower, then selling. You can open posi
    The indicator determines the state of the market: trend or flat. The state of the market is determined by taking into account volatility. The flat (trading corridor)is displayed in yellow. The green color shows the upward trend. The red color shows the downward trend. The height of the label corresponds to the volatility in the market. The indicator does not redraw . Settings History_Size   - the amount of history for calculation. Period_Candles  - the number of candles to calculate the indicat
    The indicator plots flexible support and resistance levels (dots). A special phase of movement is used for construction. Levels are formed dynamically, that is, each new candle can continue the level or complete it. The level can provide resistance or support to the price even where it is no longer there. Also, support and resistance levels can change roles. The importance of levels is affected by: the amount of time the level is formed and the number of touches. The significance of these lev
    The indicator is a trading system for short-term trading. Scalper Assistant helps to determine the direction of the transaction, and also shows the entry and exit points. The indicator draws two lines (possible points for opening positions). At the moment of the breakdown of the upper line up (and when all trading conditions are met), an up arrow appears (a buy signal), as well as 2 goals. At the moment of the breakdown of the lower line down (and when all trading conditions are met), a down ar
    Gold n XAU
    Pavel Verveyko
    The trading system is designed to work with gold on time periods: 30M, 1H. The indicator allows you to adjust to the market situation. Parameters for 1H :   PERIOD=9F ,   FILTER=300 .   Parameters for  30M :   PERIOD=22B ,   FILTER=450 .   A small adjustment to a specific broker is allowed .   If you change the amount of history displayed, you may also need to adjust the parameters. The indicator is not redrawn.     "Gold n XAU" uses different rules for entering a trade and different rules fo
    The indicator builds "psychological levels": levels of round numbers and intermediate levels of round numbers. Round numbers play an important role in forming support and resistance levels. There is a pattern in which the decline or growth of the price can stop at round numbers. The level whose price ends at 0 is the level of a round number of the first order. Intermediate level, this is the level between two round levels, for example, between 10 and 20 this is level 15. In the " Num_Zeros "
    Ichimoku Map
    Pavel Verveyko
    Ichimoku Map (instant look at the markets) - built on the basis of the legendary Ichimoku Kinko Hyo indicator. The task of the Ichimoku Map is to provide information about the market strength on the selected time periods and instruments, from the point of view of the Ichimoku indicator. The indicator displays 7 degrees of buy signal strength and 7 degrees of sell signal strength. The stronger the trend, the brighter the signal rectangle in the table. The table can be dragged with the mouse. The
    The indicator displays a stock chart of a non-standard type, in which the price and time have the same value. The usual chart of Japanese candlesticks does not take into account all the information that the time analysis can give. Renko charts do not use all the information that price can give in relation to time. The "Chart Price and Time" indicator takes into account price and time equally and shows the predominance of price or time. Taking into account price and time equally gives an idea
    The indicator tracks sharp volatility (moments when the market has shown increased activity and movement may occur), on the selected instruments and time periods. The information is displayed as colored rectangles. Thus, it is possible to assess at a glance which tool should be given priority attention. The indicator will be useful for scalpers when they need a quick reaction or for traders working with a large number of instruments. The indicator does not redraw. The indicator displays 8 degree
    The Alert Creator indicator is designed to create alerts for selected conditions. You can select one or several indicators for the notification. If several conditions are selected, the alert is triggered when all the selected conditions are met. The signals can be configured separately for buying and separately for selling. Example, a buy alert: the closing price is above the moving average, the RSI is below 20. (In this example, 2 indicators are used to generate an alert: MA and RSI) At the
    The indicator determines the strength of the trend and its possible reversal points, based on the author's arithmetic approach . Each new peak or trough is a trend development. Such peaks and troughs are numbered so that the strength of the trend development can be seen. Attempts to change the trend are also numbered. This gives an understanding of a possible change in the direction of the trend. Indicator signals are generated when trying to change the trend . In the settings, it is possible
    The indicator draws potential levels that may become significant support and resistance levels in the future. The longer the line, the higher the probability of a price reversal or an increase in price movement after the breakdown of this level. With a decrease in the probability of the formation of a level, the length of the line is reduced. The indicator does not require adjustment. In the settings, you can change the design of the indicator. The "L ine_Length " button is placed on the ch
    Jumping along Levels is dedicated to the most important aspect of trading: support and resistance levels. This indicator is built using a unique technology based on proprietary development and testing algorithms. The indicator has a built-in intelligent market situation assessment system. It can automatically adjust to varying market volatility. Jumping along Levels simultaneously displays levels from different time periods on the current chart. It has a graphical table for working with comple
    Filter:
    krisnara123
    2210
    krisnara123 2020.12.11 14:22 

    User didn't leave any comment to the rating

    Reply to review