Length Movement MT5

Measures the length of the selected movement in points, shows the duration of the movement, as well as the speed of movement. Outputs the average value of each dimension.
It is designed to calculate the expected target based on typical market movements.
The intended goal will provide information about the ratio of the stop size to the possible profit and will allow you not to open positions with a small expected profit.
It will also help you determine the point at which it is more logical to close a position. 

Note: the MT5 tester is not designed for full-fledged work with graphic objects, so drawing in the tester is slower than in the real situation.
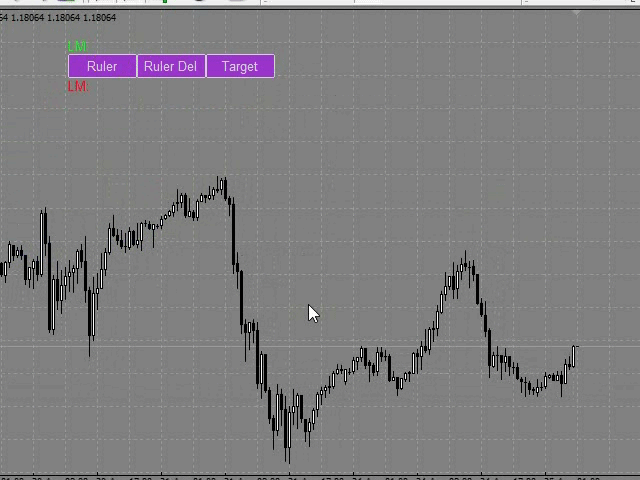
Lines are selected with 1 mouse click.


Building a line
: click the "Ruler" button and draw a line (clicking the mouse - the first point of the line, where the mouse is released - the second point of the line).
(Lines, text placemarks, and the goal are only visible on the time graph where they were drawn.)

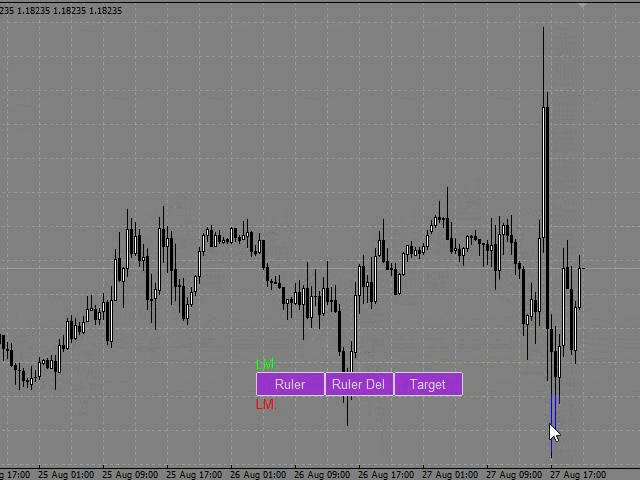
Line changes: select a line and drag it with the mouse.
When you rebuild a line, the value of the text label and the goal (if the goal is enabled) will change immediately.

Delete all measurement lines: click "Ruler_Del". During the number of seconds selected in the "Ruler_Del_Cancel" setting, the "Ruler_Del" button can be clicked to cancel, and the "Ruler_Del" command will be canceled.

Delete the selected measurement lines: select the measurement line and press "delete" on the keyboard. The text label from the measurement line will also be removed, and the goal will change.

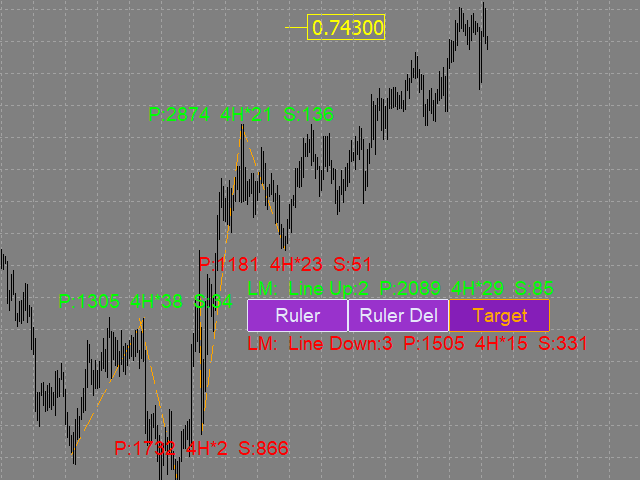
Building a goal: the "Target" button sets/deletes a goal. To calculate the goal, you need at least two lines in different directions.

Line_Metrics - Text label of the line.
For example, we have an ascending line with the parameters: P:817 4H*10 S: 81. the line Length is 817 points, the line is drawn on a 4-hour chart, based on 10 candles, (that is, the time of the movement(line) is 40 hours).
The speed of the motion in paragraphs 81. This means that on average, each candle participating in the line construction passed 81 points.

Average_Lines_Metrics - Text label for "average values". LM: Line Up:3 P:1586 4H*40 S: 39 means that the text label of the average value is calculated based on 3 ascending measuring lines Line Up: 3 (measuring lines of 0 points, lines of other time periods and tools are not taken into account in the calculations).
The average line length in points is 1586 points P:1586.
The graph where the lines are counted is 4-hour 4H*40. On average, the line consists of 40 4h*40 candles.
On average, the price passes 39 points S:39 per candle.

The size of buttons and text labels for "average values" depends on the font in the Button_Font setting and its size in the Button_FontSize setting.
On-screen buttons can be dragged with the mouse.
You can assign keyboard shortcuts to on-screen buttons (a-Z, 0-9).

Settings

  • Ruler_key - hotkey for drawing a measuring line (you can assign (a-Z, 0-9)) .
  • Ruler_Del_key - hotkey for deleting all measuring lines (you can assign (a-Z, 0-9)) 
    (measurement lines are deleted after the pause selected in the Ruler_Del_Cancel setting).
  • Target_or_Target_Del_key - hotkey for setting / deleting a goal (a-Z, 0-9)
  • (you need at least two lines in different directions to set a goal).
  • Ruler_Del_Cancel - time to cancel the Ruler_Del_key command (in seconds).
  • Button_Background_Color - buttons background color (if Button_Background_Color=clrNONE, the buttons background is the same as the graph background color).
  • Button_Pressed_Color - color of the text and border of the Ruler button when pressed.
  • Line_Metrics_Indent - indent of the text label from the measuring line (in points).
  • Line_Metrics_Orientation - displays the labels of measuring lines vertically / horizontally / diagonally.
  • Target_Orientation - left-hand / right-hand placemark of the goal.
  • Here are the most important settings. You can also change the following characteristics for measuring lines, buttons, and text labels: color, thickness, font, and font size.
    Produtos recomendados
    Footprint Chart Pro — Professional OrderFlow EA for MetaTrader 5 Version 6.34 | Professional tool for real traders | Institutional-Grade Visualization DEMO USERS - PLEASE SELECT EVERY TICK / REAL TICK WHEN TESTING AND YOU HAVE DOWNLOADED HISTORICAL DATA. IF YOU SEE A WAITING SCREEN AND IT IS NOT DOWNLOADING, IT MEANS YOU HAVE LOW HISTORICAL DATA. TRY 1 MIN AND 5 MIN FIRST ON 1 DAY DATA. ONE DAY DATA SHOULD BE THE NEWEST AND MOST CURRENT DATE. PLEASE WAIT UNTIL THE MARKET HAS ROLLED OVER PERIOD.
    A Média Móvel é um indicador que faz parte da Análise Técnica. Com ela, é possível identificar o equilíbrio dos preços no mercado, observando tendências de alta, neutra ou baixa. Este indicador customizado traz opções extras pera definir o método de cálculo podendo-se esclolher entre SMA,EMA,SSMA,LWMA,JJMA,JurX,ParMA,T3,Vidya,AMA,HULL MA. Também conta com varias opções para escolher o método de cálculo para o preço base a ser usado no cáculo da média.
    Currency Trailing Gold é uma versão gratuita e limitada de Currency Trailing , o EA inteligente de bloqueio de lucros que segue as suas operações com base no valor monetário real , e não em pips ou pontos. Esta versão gratuita funciona exclusivamente em XAUUSD (Gold) e permite-lhe ter a experiência completa de trailing num dos instrumentos de trading mais populares do mundo, sem qualquer custo. Quer utilizar o Currency Trailing em todos os símbolos? A versão completa suporta todos os pares Fo
    FREE
    Zen Eagle
    TICK STACK LTD
    5 (2)
    Launch Promotion — Purchase Zen Eagle during the launch period and choose any one of my other EAs at no extra cost. The price rises by $50 with every 10 copies sold — early buyers get the best deal. Zen Eagle Zen Eagle is a fully automated breakout trading system engineered exclusively for USDJPY — one of the most liquid and technically clean pairs in the forex market. Built on 8 independent breakout strategies running simultaneously, Zen Eagle identifies moments when price escapes established
    PassPropFirm MT5
    Yana Korchevska
    Pass Prop Firm is a high-frequency trading Expert Advisor specifically designed to help traders pass the prop firm evaluation phase (such as the HFT Challenge). With powerful scalping and smart order management logic, this EA aims to hit profit targets quickly and efficiently—ideal for traders seeking to meet demo account goals in record time. MT4 version myfxbook.com/portfolio/pass-prop-firm-mt5/11625306 myfxbook.com/portfolio/pass-prop-firm-mt4/11622480 Currency Pair : Optimized for DE40 (DAX
    ALIEN Dashboard
    Youssef Esseghaiar
    ALIEN DASHBOARD FULL EDITION – Professional ICT & Precision Trading Dashboard for MT5 ( HYBRID ENGINE ) Overview The   Alien Dashboard Full Edition   is a comprehensive, all‑in‑one technical indicator for MetaTrader 5 that merges the most powerful concepts from Inner Circle Trader (ICT) methodology with advanced precision‑entry logic, multi‑timeframe analysis, and an intuitive on‑chart dashboard. Designed for serious traders who want to visualise institutional order flow, identify high‑probabili
    "Impulses and Corrections 5" is created to help traders navigate the market situation. The indicator shows multi-time frame upward and downward "Impulses" of price movements. These impulses are the basis for determining the "Base" , which is composed of zones of corrections of price movements, as well as "Potential" zones for possible scenarios of price movement. Up and down impulses are determined based on a modified formula of Bill Williams' "Fractals" indicator. The last impulse is always "U
    ClusterSecondForex
    Rafil Nurmukhametov
    4.67 (3)
    The utility allows you to build different types of graphs: Seconds chart from 1 second to 86400 seconds Tick chart from 1 tick and above The volume chart Delta chart Renko chart Range chart Product demo https://www.mql5.com/ru/channels/clustersecondforex Built-in indicators for volumetric analysis: daily market profile and market profile of the selected timeframe, Cluster Search Imbalance VWAP Dynamic POC, VAH, VAL the profile depth of the market vertical volume with various display options, del
    SMC Buy Sell Indicator SMC Buy Sell Indicator is a price action-based trading tool designed to identify market structure using Smart Money Concepts. It focuses on detecting meaningful swing points, structural breaks, and confirmation signals directly from chart data. The indicator operates using closed candle data and does not rely on future bars. All calculations are performed on confirmed price action, which helps maintain consistent and stable signals. Key Features Market Structure Detection
    SolarTrade Suite Financial Robot: LaunchPad Market Expert - concebido para abrir negociações! Este é um robô comercial que utiliza algoritmos especiais inovadores e avançados para calcular os seus valores, o seu assistente no mundo dos mercados financeiros. Utilize o nosso conjunto de indicadores da série SolarTrade Suite para escolher melhor o momento de lançamento deste robô. Veja os nossos outros produtos da série SolarTrade Suite na parte inferior da descrição. Quer navegar com confiança
    Mine Farm
    Maryna Kauzova
    Mine Farm is one of the most classic and time-tested scalping strategies based on the breakdown of strong price levels. Mine Farm is the author's modification of the system for determining entry and exit points into the market... Mine Farm - is the combination of great potential with reliability and safety. Why Mine Farm?! - each order has a short dynamic Stop Loss - the advisor does not use any risky methods (averaging, martingale, grid, locking, etc.) - the advisor tries to get the most
    VR Grid Mt5
    Vladimir Pastushak
    3.25 (8)
    O indicador VR Grid foi projetado para criar uma grade gráfica com configurações definidas pelo usuário. Ao contrário da grade padrão , a VR Grid é usada para construir níveis circulares . Dependendo da escolha do usuário, o passo entre os níveis de rodada pode ser arbitrário. Além disso, ao contrário de outros indicadores e utilitários, o VR Grid mantém a posição da rede mesmo quando o período de tempo muda ou o terminal é reiniciado. Configurações, arquivos de configuração, versões demo, instr
    FREE
    Gold Zenix
    Md Billal Hossain
    Apresentamos a ZENIX EA — O seu companheiro de elite no mercado do ouro Bem-vindo ao ZENIX — o Expert Advisor de última geração criado exclusivamente para XAU/USD (Ouro). O ZENIX não é apenas um sistema de negociação automatizado — é um motor de precisão construído com uma missão: Dominar o mercado do ouro com inteligência, adaptabilidade e poder. ***Preço limitado - A terminar em breve*** O próximo preço aumenta para 200,46 $ Não perca esta oportunidade de garantir o "Zenix" com desc
    Trading Room Indcator
    Meshari F M Alkhawaled
    Trading Room Indicator is a professional market-structure tool built to give traders a clear, complete trading framework — combining CPR levels, dynamic targets, and trend direction in one clean view. Instead of guessing direction or overloading the chart with indicators, Trading Room Indicator focuses on what actually matters : levels, direction, and potential price expansion. What This Indicator Provides CPR Structure BUY level SELL level Pivot Point (PP) Designed to highlight equilibrium
    BTC Terminator
    Riaan Adriaan Swanepoel
    # Advanced Terminator AI EA MT5 - Neural Network Powered Trading System ## Premium Features Advanced Neural Network Technology - Deep learning algorithms for market pattern recognition - Real-time adaptive strategy optimization - Smart risk management powered by AI - Multi-timeframe analysis system Dual Market Mastery - Specialized for XAUUSD (Gold) trading - Optimized for BTCUSD cryptocurrency pairs - Individual strategy optimization for each market Professional Risk Management
    Supply and Demand MTFs
    Mohammed Zakana Al Mallouk
    Overview Supply & Demand (MTF) v1.00 is a MetaTrader 5 indicator that automatically identifies and draws key supply and demand zones from up to three timeframes on your current chart. Supply zones mark areas where selling pressure was strong; demand zones mark areas where buying pressure was strong. Features Multi-timeframe detection Scan the current chart plus two higher timeframes for zones. Candle-strength filter Require a configurable number of strong candles to confirm each zone. Adjust
    FREE
    ClusterSecond
    Rafil Nurmukhametov
    4.78 (32)
    The utility allows you to build different types of graphs: Seconds chart from 1 second to 86400 seconds Tick chart from 1 tick and above The volume chart Delta chart Renko chart Range chart Demo version of the utility https://www.mql5.com/ru/channels/clustersecond Built-in indicators for volumetric analysis: daily market profile and market profile of the selected timeframe, Cluster Search Imbalance VWAP Dynamic POC, VAH, VAL the profile depth of the market vertical volume with various display op
    Candle hunter
    Ruslan Khasanov
    5 (1)
    Indicador para análise gráfica. Marca os principais padrões de velas japonesas no gráfico. No momento, o seguinte conjunto de padrões está disponível para o trader:  - Bearish/Bullish Abandoned Baby;  - Bearish Advance Block;  - Bearish Deliberation;  - Bearish/Bullish Belt Hold;  - Bearish/Bullish Engulfing;  - Bearish Shooting Star;  - Bearish Evening Star;  - Bearish Evening Doji Star;  - Bearish/Bullish Doji Star;    - Bearish/Bullish Tri-Star;  - Bearish Hanging Man;  - Bearish/Bullish Har
    Professional Opening Range Breakout (ORB) indicator designed for precision session trading with automatic time handling, breakout alerts, and advanced target levels. This indicator automatically identifies the Opening Range for any configurable session, plots the High, Low, and Midpoint levels, and extends them across the trading day. Built-in breakout detection and alerts, range measurements, and extension targets provide traders with clear structure and actionable levels. Ideal for traders usi
    Pro Experience Only 4 copies available for $99.00. Next price 199 USD ECN Pro Experience is a scalping strategy based on breaking through strong price levels. One of the oldest and most reliable strategies with the author's modernization for the current market. The strategy does not require any optimizations. We installed it on the chart according to the recommendation and enjoy trading!!! Advantages of ECN Pro Experience: - optimal SL/TP ratio - low SL, which makes the system as safe as possi
    Autogrids Light
    Guilherme Emiliao Ferreira
    Autogrids Light – Smart Grid Trading EA for Hedge Accounts Autogrids Light carries the unmistakable DNA of the original Autogrids, preserving its powerful logic and precision while delivering a lighter, more streamlined version. Focused exclusively on the Spot Grid strategy, Autogrids Light dynamically constructs a customizable grid of buy and sell orders around a reference price, automatically placing pending orders according to user-defined distances, volumes, and number of levels. Every o
    ScalperGun
    Mikhail Nazarenko
    Scalper gun  - главное оружие для торговли скальпингом и свингом, с визуализацией и алертом точек входа. Индикатор работает как в трендовых, так и в нетрендовых рыночных условиях. Подходит начинающим и опытным трейдерам.  SCALPER GUN превосходит по скорости, качеству визуализации и точности входа популярные топовые индикаторы этого сайта!!! Перед покупкой скачайте демо Scalper gun и сравните с аналогичными индикаторами для скальпинга в тестере MT4. Особенности Это готовая торговая система с визу
    Simple Customizable Trade Panel — Fast and Easy One-Click Trading This lightweight and powerful panel is built for traders who value   speed ,   simplicity , and   full customization . With just one click, you can: Buy or Sell instantly Close all open positions Place pending orders with custom distance Delete all pending orders Adjustable parameters: • Lot size • Stop Loss (in points) • Take Profit (in points) • Distance to price for pending orders The panel is fully responsive and ad
    Universal Volatility Compass (UVC): Navegue os Ciclos de Mercado com Confiança em Todos os Ativos Desde a sua introdução em 1993, o Índice de Volatilidade da CBOE (VIX) tornou-se a medida de referência para o risco de mercado e o medo dos investidores no mercado de ações. Leituras elevadas do VIX sinalizam volatilidade aumentada e frequentemente coincidem com os fundos de mercado, enquanto leituras baixas sugerem complacência e os topos de mercado. Mas e o vasto universo além do S&P 500, Nasdaq
    Aura Smc Quantum H4
    Chaibadee Dechtanankul
    AURA SMC QUANTUM V1.01 code in English, structured for a professional presentation or MQL5 Market description: AURA SMC QUANTUM V1.01 | Logic Breakdown The Aura SMC Quantum is an advanced automated trading system (EA) specifically engineered for Gold (XAUUSD) on the H4 timeframe. It combines high-probability Smart Money Concepts (SMC) with a sophisticated Hybrid Grid management system. 1. Market Analysis Strategy (SMC & Trend Filter) The core "intelligence" of the EA relies on a dual-layer confi
    Advanced Trading Chaos  The main purpose of the indicator is to help the trader detect the signals described by Bill Williams in his books to make a quick and correct trading decision. 1)Bullish/Bearish Reversal Bar(BDB) 2) Divergent Bar(DB) 3) Second Sage Signal — the third consecutive Awesome Oscillator bar  4) Working fractals (Fractals that worked above/below the red forehead  5) Three bar coloring modes 5.1) Coloring of bars according to the AO indicator (Including the squatting bar) 5.2
    O DYJ MOBILE GAMING TRADING WINNER pode usar seus vários terminais (MOBILE PHONE, WEB, TRADINGVIEW, MT5) para negociação manual e, em seguida, processado automaticamente pela EA. A negociação móvel pode usar os vários modos de grade da EA, modo de couro cabeludo, modo de arbitragem de hedge e modo de ordem independente para abrir posições manualmente, A EA pode definir automaticamente o stop loss para abertura móvel. E use seu celular para abrir uma grade, couro cabeludo e ordens de hedge. A
    Gold Rush Turbo EA
    Pham Tung Anh Nguyen
    5 (1)
    INTRODUCTION Gold Rush Turbo – Ride the Fastest Wave of Gold Trading Experience the thrill of fast-paced gold trading. Gold Rush Turbo is a high-performance, medium-risk Expert Advisor designed for traders who thrive in dynamic market conditions. Built for aggressive scalping on XAUUSD (gold), it uses rapid market entries, tight stops, and momentum-based logic to capture short-term price movements. If you’re ready for high-speed decision-making, Gold Rush Turbo keeps your strategy sharp and your
    Was: $249  Now: $99   Market Profile defines a number of day types that can help the trader to determine market behaviour. A key feature is the Value Area, representing the range of price action where 70% of trading took place. Understanding the Value Area can give traders valuable insight into market direction and establish the higher odds trade. It is an excellent addition to any system you may be using. Inspired by Jim Dalton’s book “Mind Over Markets”, this indicator is designed to suit the
    Trend Edge Predator
    Itumeleng Mohlouwa Kgotso Tladi
    TREND EDGE PREDATOR Advanced Trend-Following Expert Advisor Trend Edge Predator   is a high-performance automated trading system designed to identify and exploit emerging market trends with surgical precision. Built for traders who value stability and logic, this EA combines advanced price action analysis with proprietary trend-filtering algorithms to stay on the right side of the market. Key Features: Smart Trend Detection:   Uses multi-timeframe analysis to confirm trend direction before en
    Os compradores deste produto também adquirem
    Trade Assistant MT5
    Evgeniy Kravchenko
    4.42 (210)
    Ajuda a calcular o risco por comércio, a fácil instalação de uma nova encomenda, gestão de encomendas com funções de fecho parcial, trailing stop de 7 tipos e outras funções úteis. Materiais e instruções adicionais Instruções de instalação   -   Instruções para a aplicação   -   Versão de teste da aplicação para uma conta de demonstração Função de linha Mostra no gráfico a linha de Abertura, Stop Loss, Take Profit. Com esta função é fácil definir uma nova ordem e ver as suas características ad
    Bem-vindo ao Trade Manager EA—uma ferramenta de gestão de risco criada para tornar o trading mais intuitivo, preciso e eficiente. Não é apenas uma ferramenta para executar ordens, mas uma solução abrangente para planejamento de operações, gerenciamento de posições e controle de risco. Seja você um iniciante, trader avançado ou scalper que precisa de execução rápida, o Trade Manager EA adapta-se às suas necessidades, oferecendo flexibilidade em todos os mercados, desde forex e índices até commodi
    TradePanel MT5
    Alfiya Fazylova
    4.87 (154)
    Trade Panel é um assistente de negociação multifuncional. O aplicativo contém mais de 50 funções de negociação para trading manual e permite automatizar a maioria das tarefas de negociação. Antes da compra, você pode testar a versão de demonstração em uma conta demo. Baixe a versão experimental do aplicativo para uma conta de demonstração: https://www.mql5.com/pt/blogs/post/762547 . Instruções completas aqui . Comércio. Permite realizar operações de negociação com um clique: Abrir ordens pendent
    Versão Beta O Telegram to MT5 Signal Trader está quase no lançamento oficial da versão alfa. Alguns recursos ainda estão em desenvolvimento e você pode encontrar pequenos erros. Se tiver problemas, por favor reporte, seu feedback ajuda a melhorar o software para todos. Telegram to MT5 Signal Trader é uma ferramenta poderosa que copia automaticamente sinais de trading de canais ou grupos do Telegram diretamente para sua conta MetaTrader 5 . Suporta canais públicos e privados do Telegram, e você
    Farmed Hedge Yield Farming | All Markets (Manual - Hybrid - Semi/Automated EA) MULTI-ASSET SUPPORT Trade any asset available on your broker - Forex: Major, Minor, Exotic pairs - Crypto: BTC, ETH, XRP, SOL, BNB - Stocks: Apple, Tesla, Amazon, Google, etc. - Commodities: Gold, Silver, Oil, Gas - Indices: US30, NAS100, SPX500, DAX40 - Any CFD your broker offers VERIFIED TRADING RESULTS - Farmed Hedge Yield Axi Copy:  https://www.mql5.com/en/signals/2356376 - Farmed Hedge Yield Exn Copy:   https:/
    Power Candles Strategy Scanner - Localizador de configurações multissímbolo com auto-otimização O Power Candles Strategy Scanner utiliza o mesmo motor de auto-otimização que alimenta o indicador Power Candles — em todos os símbolos da sua lista de observação, lado a lado. Um painel indica-lhe quais os símbolos que são estatisticamente negociáveis neste momento, qual a estratégia vencedora para cada um, o par ideal de Stop Loss / Take Profit, e avisa-o assim que um novo sinal é emitido. Esta ferr
    AntiOverfit PRO MT5
    Enrique Enguix
    5 (4)
    Antes de comprar um EA, verifique se ele realmente se sustenta ou se apenas teve sorte num backtest. A maioria dos robôs é vendida com um backtest bonito. Curva ascendente. Bom profit factor. Poucas dúvidas. E, ainda assim, muitos desses EAs desmoronam assim que o mercado deixa de se mover como nesse histórico. Porquê? Porque um backtest só prova uma coisa: que essa estratégia funcionou num percurso específico do preço. Não prova que vá aguentar outros percursos. Não prova que seja robusta. E mu
    The product will copy all telegram signal to MT5 ( which you are member) , also it can work as remote copier.  Easy to set up, copy order instant, can work with almost signal formats, image signal,  s upport to translate other language to English Work with all type of channel or group, even channel have "Restrict Saving Content", work with  multi channel, multi MT5 Work as remote copier: with signal have ticket number, it will copy exactly via ticket number. Support to backtest signal. How to s
    O Local Trade Copier EA é uma solução para traders individuais ou gerentes de contas que precisam executar sinais de negociação de fontes externas ou que precisam gerenciar várias contas ao mesmo tempo, sem a necessidade de uma conta MAM ou PAMM. Copia de até 8 contas mestras para contas escravas ilimitadas [ Guia de instalação | Guia de atualização | Solução de problemas | Perguntas frequentes | Todos os produtos ] 100% auto-hospedado Fácil de instalar e usar Nenhum instalador, arquivos de con
    HINN Lazy Trader
    ALGOFLOW OÜ
    5 (2)
    The core idea: using the user interface, you configure the parameters the chart must meet before entering a position (or positions), choose which entry models to use, and set the rules for when trading and planning should end. Lazy Trader  handles the rest: it  takes over all the routine chart watching and execution! full description  :: 3 key videos [1] ->  [2]   ->  [3] What can it do? - Understands Larry Williams market structure - Understands swing market structure by Michael Huddleston
    Ultimate Trailing Stop EA MT5
    BLAKE STEVEN RODGER
    4.13 (8)
    This EA Utility allows you to manage (with advanced filtering) unlimited open orders (manual or EA) with 16 trailing stop methods: fixed, percent, ATR Exit, Chandelier Exit, Moving Average, Candle High Low Exit, Bollinger Bands, Parabolic, Envelope, Fractal, Ichimoku Kijun-Sen, Alligator, Exit After X Minutes or Bars, RSI and Stochastic. The trailing stop can be either real or virtual, and you can exit fully or with a partial close percent on touch or bar close.  Moreover, you can add (override
    Ultimate Extractor
    Clifton Creath
    5 (9)
    Ultimate Extractor - Professional Trading Analytics for MT5 *****this is the local HTML version of Ultimate Extractor. !!!!!it is not compatible with Cloud!!!! For the online version please reach out to me directly****** Ultimate Extractor transforms your MetaTrader 5 trading history into actionable insights with comprehensive analytics, interactive charts, and real-time performance tracking. What It Does Automatically analyzes your MT5 trading history across all Expert Advisors and generates
    EA Performance Logger Telegram
    Abdulqudus Tomiwa Akande-owoo
    The Performance Logger is a utility for MetaTrader 5 designed to track and report account metrics. It identifies trades based on specific criteria and provides summaries of account activity. Main Functions Automated Reporting : Generates summaries of account performance and sends them to specified communication channels (Telegram or Discord) on a weekly, monthly, or yearly basis. Strategy Analysis : Organizes performance data based on the specific Expert Advisor or strategy used for each trade.
    TradeMirror é uma ferramenta local de cópia de ordens desenvolvida para as plataformas MT4/MT5, com suporte à sincronização de negociações em tempo real. Vantagens do Produto Alinhado com os altos padrões de segurança, estabilidade e privacidade para softwares financeiros, otimizamos três aspectos fundamentais: Interface gráfica intuitiva para operação simplificada Proteção de privacidade reforçada para isolamento de dados sensíveis em cenários financeiros Sincronização de ordens em milissegundo
    Telegram To MT5 Receiver
    Levi Dane Benjamin
    4.31 (16)
    Copie os sinais de qualquer canal do qual você seja membro (incluindo privados e restritos) diretamente para o seu MT5.  Esta ferramenta foi projetada com o usuário em mente, oferecendo muitos recursos que você precisa para gerenciar e monitorar as negociações. Este produto é apresentado em uma interface gráfica fácil de usar e visualmente atraente. Personalize suas configurações e comece a usar o produto em minutos! Guia do usuário + Demo  | Versão MT4 | Versão Discord Se deseja experimentar
    EA Auditor
    Stephen J Martret
    5 (2)
    EA AUDITOR — EA and Signal Verification Tool for MetaTrader 5 EA Auditor is an independent analysis tool for traders evaluating Expert Advisors and trading signals on MetaTrader 5. It audits backtest reports, reviews posted developer signals, and cross-verifies the two against each other to help traders assess strategies before committing capital. The MQL5 market offers a wide range of Expert Advisors from many developers, with varying approaches, quality, and transparency. EA Auditor provides a
    Custom Timeframe Manager Pro: timeframes ilimitados no MetaTrader 5 As configurações padrão do terminal costumam ocultar detalhes importantes do movimento dos preços. Ao limitar a análise apenas aos períodos clássicos, o trader corre o risco de perder os momentos de início de uma tendência e os níveis reais de volatilidade. Custom Timeframe Manager Pro é um utilitário profissional que expande os limites do MetaTrader 5. Crie quaisquer períodos personalizados, incluindo fracionários e exóticos,
    Prop Guardian Risk Manager MT5 – Daily and Overall Drawdown Protection for Prop Firm Traders Prop Guardian Risk Manager is a professional risk-control utility for MetaTrader 5, created for traders who operate under prop firm rules. It does not open trades and does not implement any trading strategy. Instead, it runs in the background, monitors your account risk and can automatically block trading or close exposure when your own limits are reached. Use it as a safety layer on top of your manual t
    YuClusters
    Yury Kulikov
    4.93 (43)
    Atenção: A versão demo para revisão e teste está aqui . YuClusters é um sistema profissional de análise de mercado. O trader tem oportunidades únicas para analisar o fluxo de pedidos, volumes de negociação, movimentos de preços usando vários gráficos, perfis, indicadores e objetos gráficos. O YuClusters opera com base em dados de Tempos e Negócios ou informações de ticks, dependendo do que está disponível nas cotações de um instrumento financeiro. O YuClusters permite que você crie gráficos com
    MT5-StreamDeck offers the possibility to use a certain number of pre-programmed Hot-keys with a clearly defined role. So by the push of a button you can open a trade with a pre-defined lot size, stoploss and take profit. Close all your trades, close the ones in profit, or in loss, set Break-even or set a trailing stop. All this with a Hot key button. See the feature list for all the actions that can take place at the push of a button. Ideal for Quick Scalping or day trading with set risk managem
    Custom Alerts AIO: Monitoramento inteligente de múltiplos mercados – pronto para uso, sem configuração Visão geral Custom Alerts AIO é uma ferramenta avançada de varredura de mercado que funciona imediatamente após a instalação — sem necessidade de configurar indicadores adicionais. Inclui internamente todos os principais indicadores da Stein Investments (FX Power, FX Volume, FX Dynamic, FX Levels e IX Power), permitindo que você monitore facilmente todas as principais classes de ativos: Forex
    FUTURES ORDERFLOW FOOTPRINT CHART Professional OrderFlow EA for MetaTrader 5 Version 1.01| Professional tool for real traders | Institutional-Grade Visualization STRATEGY TESTER USERS - PLEASE SELECT EVERY REAL TICK WHEN TESTING AND YOU HAVE DOWNLOADED HISTORICAL DATA. IF YOU SEE A WAITING SCREEN AND IT IS NOT DOWNLOADING, IT MEANS YOU HAVE LOW HISTORICAL DATA. TRY 1 MIN AND 5 MIN FIRST ON 1 DAY DATA. ONE DAY DATA SHOULD BE THE NEWEST AND MOST CURRENT DATE. PLEASE WAIT UNTIL THE MARKET HAS ROL
    Bots Builder Pro MT5
    Andrey Barinov
    4.17 (6)
    This is exactly what the name says. Visual strategy builder . One of a kind. Turn your trading strategies and ideas into Expert Advisors without writing single line of code. Generate mql source code files with a few clicks and get your fully functional Expert Advisors, which are ready for live execution, strategy tester and cloud optimization. There are very few options for those who have no programming skills and can not create their trading solutions in the MQL language. Now, with Bots Builde
    EasyInsight AIO MT5
    Alain Verleyen
    4.92 (12)
    EASY Insight AIO – A solução tudo-em-um para trading inteligente e sem esforço Visão geral Imagine analisar todo o mercado — Forex, Ouro, Cripto, Índices e até Ações — em segundos, sem precisar examinar gráficos manualmente, instalar indicadores ou lidar com configurações complicadas. EASY Insight AIO é sua ferramenta definitiva de exportação para trading com IA, pronta para usar. Ela oferece um panorama completo do mercado em um único arquivo CSV limpo — pronto para análise imediata no ChatGP
    ManHedger MT5
    Peter Mueller
    4.83 (6)
    THIS EA IS A SEMI-AUTO EA, IT NEEDS USER INPUT. Manual & Test Version Please TEST this product before BUYING  and watch my video about it. The price of the ManHedger will increase to 250$ after 20 copies sold. Contact me for user support or bug reports or if you want the MT4 version! MT4 Version  I do not guarantee any profits or financial success using this EA. With this Expert Advisor, you can: Implement your own Zone Recovery strategy to capitalize on trending markets. Create Grid trading s
    FiboPlusWaves MT5
    Sergey Malysh
    5 (1)
    Uma série de produtos sob marca FiboPlusWave Um sistema comercial pronto baseado nas  ondas de Elliott e níveis de Fibonacci . Simples e de fácil acesso. Exibição de marcação das ondas de Elliott (opção geral ou alternativa) em um gráfico. Construção dos níveis horizontais, linhas de apoio e resistência, canal. Sobreposição dos níveis de Fibonacci para as ondas 1, 3, 5, A Sistema de alerta (no ecrã, E-Mail, Push notificações).    Particularidade s : sem se aprofundar na teoria das ondas de Ellio
    The   Basket expert advisor   can open up to 10 trades at once. It was developed for basket traders who need to open a lot of trades on many different pairs. Expert advisor allows to set a take profit and stop loss as a value in money for each basket trade. This EA is also equipped with hedge functions and allows traders to use the Classic hedge strategy or Sure-Fire strategy, also known as "Always in profit". Main features Opening multiple trades simultaneously EA Works on any market (forex,
    VOLUME BUBBLES ORDERFLOW FOOTPRINT PROFESSIONAL Expert Advisor for MetaTrader 5 Complete Feature Documentation Introduction: Volume Bubbles OrderFlow Footprint Professional is an advanced order flow visualization tool designed for the MetaTrader 5 platform. It provides institutional-grade market analysis through real-time volume bubbles visualization, volume profiling, and sophisticated order flow analysis. This Expert Advisor transforms raw market data into actionable trading intelligence, hel
    Encontrou um ótimo sinal, mas o lote de um provedor é muito pequeno? Você precisa de um volume de posição maior, mas as configurações do terminal são muito ruins? O Signal Lot Manager aumentará o volume da posição do provedor por meio de uma ordem duplicada do volume necessário. Basta definir um tamanho de lote e um nome de sinal para copiar pedidos. O Signal Lot Manager é um utilitário multiplicador de lotes para duplicar pedidos em seu terminal. A fonte pode ser selecionada por qualquer consul
    AlgoRadar
    Stephen J Martret
    5 (4)
    AlgoRadar — On-Chart Trade Analytics for MetaTrader 5 AlgoRadar is an on-chart analytics dashboard for MT5 that aggregates Expert Advisor performance across multiple accounts, brokers, and platforms — including both MT4 and MT5 data — into a single live view on your MT5 chart. What AlgoRadar Does AlgoRadar displays aggregated EA performance metrics directly on your MT5 chart in real time, without requiring external applications or manual report processing. All analysis runs from the chart inter
    Mais do autor
    Ichimoku Map (instant look at the markets) - built on the basis of the legendary Ichimoku Kinko Hyo indicator. The task of the Ichimoku Map is to provide information about the market strength on the selected time periods and instruments, from the point of view of the Ichimoku indicator. The indicator displays 7 degrees of buy signal strength and 7 degrees of sell signal strength. The stronger the trend, the brighter the signal rectangle in the table. The table can be dragged with the mouse. The
    The trading system is designed to work with gold on time periods: 30M, 1H. The indicator allows you to adjust to the market situation. Parameters for 1H :   PERIOD=9F ,   FILTER=300 .   Parameters for  30M :   PERIOD=22B ,   FILTER=450 .     A small adjustment to a specific broker is allowed .   If you change the amount of history displayed, you may also need to adjust the parameters. The indicator is not redrawn.     "Gold n XAU" uses different rules for entering a trade and different rules
    Length Movement
    Pavel Verveyko
    5 (1)
    Measures the length of the selected movement in points, shows the duration of the movement, as well as the speed of movement.   Outputs the average value of each dimension. It is designed to calculate the expected target based on typical market movements. The intended goal will provide information about the ratio of the stop size to the possible profit and will allow you not to open positions with a small expected profit. It will also help you determine the point at which it is more logical to c
    Turn
    Pavel Verveyko
    The indicator shows the market turning points (entry points). Reversals allow you to track rebound/breakout/testing from the reverse side of the lines of graphical analysis or indicators. Reversals can be an independent signal. The indicator allows you to determine reversals taking into account the trend and without it. You can choose a different period for the movement preceding the reversal, as well as the volatility coefficient. When plotting reversals, the indicator takes into account volati
    The indicator allows you to quickly switch from one instrument to another, from one time period to another using the keyboard or buttons on the monitor. Each command can be assigned a hot key from 0-9, a-Z (case-insensitive) and VK_OEM_COMMA ("<" on the keyboard) and VK_OEM_PERIOD (">" on the keyboard). This can help you to operate the maximum number of instruments that are available at your broker, analyze more instruments/periods in less time. This product cannot be tested in the tester , beca
    Ratio TP SL
    Pavel Verveyko
    5 (1)
    This indicator allows you to measure the profitability of each specific transaction (the ratio of Stop and Profit). The indicator allows you to adjust the ratio by step size and number of steps. You can build an unlimited number of ratios to compare the risks from different movements. Note: in MT4, the number of horizontal lines in a single ratio cannot exceed 32. Building a line : click the " Ratio " button and draw a line (mouse click - the first point of the line, where the mouse is release
    Corporate Report
    Pavel Verveyko
    5 (1)
    The script displays info about the share's corporate reports and dividends. The data is downloaded from   investing.com : Report date Profit per share (EPS) Revenue Market capitalization Amount of dividends Date of payment of dividends Dividend income The product cannot be tested in the tester (since it is not possible to receive data from the Internet). Before launching:  Add 2   URL   https://ru.investing.com/earnings-calendar/Service/getCalendarFilteredData  and   https://ru.investing.com/di
    Channel FTF
    Pavel Verveyko
    The Envelopes indicator determines the presence of a trend or flat. It has 3 types of signals, shows the probable retracement levels and levels of the possible targets. The Fibonacci coefficients are used in the indicator's calculations. Signals (generated when touching the lines or rebounding from lines): Trend - the middle line of the Envelopes has a distinct inclination; the lines below the channel's middle line are used for buy trades, the lines above the middle line and the middle line itse
    Mr Big
    Pavel Verveyko
    The indicator shows and highlights the chart candles, which are formed as a result of large players entering the market in large volumes. Such candles can also be formed after achieving a certainty on the market, when most of the participants hold positions in the same direction. The movement is likely to continue in that direction after such candles. The indicator highlights the significant candles from the existing ones on the chart; The indicator allows identifying the trends based on candles
    Splash
    Pavel Verveyko
    The indicator identifies the most suitable moment for entering the market in terms of market volatility, when the market has the strength to move (the signal is indicated by an arrow under the candle). For each of the signals, the presence of trends on the current and higher timeframes is determined, so that the signal is in the direction of the majority of positions opened on the market (denoted near the signal by abbreviations of timeframes with a trend present). The signal appears after the c
    The indicator displays the key support and resistance levels on the chart. The significance of these levels lies in that the price may reverse or strengthen the movement when passing such levels, since they are formed as a consequence of the natural reaction of market participants to the price movement, depending on which positions they occupied or did not have time to occupy. The psychology of the level occurrence: there always those who bought, sold, hesitated to enter or exited early. If the
    This indicator is a multitimeframe trading strategy. It has the levels for stop loss, take profit and entry point. The order level can also be set manually. The indicator uses the regularity of the market, which manifests itself on all instruments, and does not require adjustment of the parameters. The strategy uses a proprietary approach to determining: trend, volatility, hierarchy of timeframe significance, the size of the history period (the number of candles), which is important for making a
    Trend Sync
    Pavel Verveyko
    5 (1)
    The indicator shows the trend of 3 timeframes: higher timeframe; medium timeframe; smaller (current) timeframe, where the indicator is running. The indicator should be launched on a chart with a timeframe smaller than the higher and medium ones. The idea is to use the trend strength when opening positions. Combination of 3 timeframes (smaller, medium, higher) allows the trend to be followed at all levels of the instrument. The higher timeframes are used for calculations. Therefore, sudden change
    The indicator detects important peaks and troughs (extremes) on the chart. These points can be used to plot support/resistance levels and trend lines, as well as any other graphical analysis. These points can serve as reference points for setting trading orders. The indicator does not redraw . Settings: Size_History  - the size of the calculated history. Num_Candles_Right  - number of candles to the right of the peak or trough. Num_Candles_Left  - number of candles to the left of the peak or
    Running along Lines
    Pavel Verveyko
    3 (2)
    The indicator draws support and resistance lines on an important part of the chart for making decisions. After the trend line appears, you can trade for a breakout or rebound from it, as well as place orders near it. Outdated trend lines are deleted automatically. Thus, we always deal with the most up-to-date lines. The indicator is not redrawn . Settings: Size_History  - the size of the calculated history. Num_Candles_extremum  - the number of candles on each side of the extremum. Type_Arrow
    Key Volumes
    Pavel Verveyko
    1 (1)
    The indicator shows key volumes confirmed by the price movement. The indicator allows you to analyze volumes in the direction, frequency of occurrence, and their value. There are 2 modes of operation: taking into account the trend and not taking into account the trend (if the parameter Period_Trend = 0, then the trend is not taken into account; if the parameter Period_Trend is greater than zero, then the trend is taken into account in volumes). The indicator does not redraw . Settings History_S
    This trading system is based on market impulses of varying complexity.   To generate a signal, the indicator uses the moments when the direction of the pulse and the necessary section of the trend coincide. The indicator also takes into account the current market volatility. Stop_loss tags can be set with the parameter "0" or "1", then Stop_Loss will take into account market volatility.   Take_Profit tags can be set with the parameter "0", then Take_Profit will take into account market volatil
    Indexes
    Pavel Verveyko
    The stocks that make up the index are one of the drivers of the movement. Analyzing the financial performance of all elements of the index, we can assume further development of the situation. The program (script) displays corporate reports of shares that are part of the index selected in the settings.   "Indexes" cannot be tested in the tester (since there is no way to get information from the Internet). Information is downloaded from the site investing.com: Report Date Earnings per share (E
    Fibo World
    Pavel Verveyko
    The indicator builds a graphical analysis based on the Fibonacci theory. Fibo Fan is used for the analysis of the impulses and corrections of the movement. Reversal lines (2 lines at the base of the Fibonacci fan) are used to analyze the direction of movements. The indicator displays the of 4 the target line in each direction. The indicator takes into account market volatility. If the price is above the reversal lines, it makes sense to consider buying, if lower, then selling. You can open posi
    The indicator determines the state of the market: trend or flat. The state of the market is determined by taking into account volatility. The flat (trading corridor)is displayed in yellow. The green color shows the upward trend. The red color shows the downward trend. The height of the label corresponds to the volatility in the market. The indicator does not redraw . Settings History_Size   - the amount of history for calculation. Period_Candles  - the number of candles to calculate the indicat
    The indicator plots flexible support and resistance levels (dots). A special phase of movement is used for construction. Levels are formed dynamically, that is, each new candle can continue the level or complete it. The level can provide resistance or support to the price even where it is no longer there. Also, support and resistance levels can change roles. The importance of levels is affected by: the amount of time the level is formed and the number of touches. The significance of these lev
    The indicator is a trading system for short-term trading. Scalper Assistant helps to determine the direction of the transaction, and also shows the entry and exit points. The indicator draws two lines (possible points for opening positions). At the moment of the breakdown of the upper line up (and when all trading conditions are met), an up arrow appears (a buy signal), as well as 2 goals. At the moment of the breakdown of the lower line down (and when all trading conditions are met), a down ar
    Gold n XAU
    Pavel Verveyko
    The trading system is designed to work with gold on time periods: 30M, 1H. The indicator allows you to adjust to the market situation. Parameters for 1H :   PERIOD=9F ,   FILTER=300 .   Parameters for  30M :   PERIOD=22B ,   FILTER=450 .   A small adjustment to a specific broker is allowed .   If you change the amount of history displayed, you may also need to adjust the parameters. The indicator is not redrawn.     "Gold n XAU" uses different rules for entering a trade and different rules fo
    The indicator builds "psychological levels": levels of round numbers and intermediate levels of round numbers. Round numbers play an important role in forming support and resistance levels. There is a pattern in which the decline or growth of the price can stop at round numbers. The level whose price ends at 0 is the level of a round number of the first order. Intermediate level, this is the level between two round levels, for example, between 10 and 20 this is level 15. In the " Num_Zeros "
    Ichimoku Map (instant look at the markets) - built on the basis of the legendary Ichimoku Kinko Hyo indicator. The task of the Ichimoku Map is to provide information about the market strength on the selected time periods and instruments, from the point of view of the Ichimoku indicator. The indicator displays 7 degrees of buy signal strength and 7 degrees of sell signal strength. The stronger the trend, the brighter the signal rectangle in the table. The table can be dragged with the mouse. The
    The indicator displays a stock chart of a non-standard type, in which the price and time have the same value. The usual chart of Japanese candlesticks does not take into account all the information that the time analysis can give. Renko charts do not use all the information that price can give in relation to time. The "Chart Price and Time" indicator takes into account price and time equally and shows the predominance of price or time. Taking into account price and time equally gives an idea
    The indicator tracks sharp volatility (moments when the market has shown increased activity and movement may occur), on the selected instruments and time periods. The information is displayed as colored rectangles. Thus, it is possible to assess at a glance which tool should be given priority attention. The indicator will be useful for scalpers when they need a quick reaction or for traders working with a large number of instruments. The indicator does not redraw. The indicator displays 8 degree
    The Alert Creator indicator is designed to create alerts for selected conditions. You can select one or several indicators for the notification. If several conditions are selected, the alert is triggered when all the selected conditions are met. The signals can be configured separately for buying and separately for selling. Example, a buy alert: the closing price is above the moving average, the RSI is below 20. (In this example, 2 indicators are used to generate an alert: MA and RSI) At the
    The indicator determines the strength of the trend and its possible reversal points, based on the author's arithmetic approach . Each new peak or trough is a trend development. Such peaks and troughs are numbered so that the strength of the trend development can be seen. Attempts to change the trend are also numbered. This gives an understanding of a possible change in the direction of the trend. Indicator signals are generated when trying to change the trend . In the settings, it is possible
    O indicador desenha níveis potenciais que podem se tornar níveis significativos de suporte e resistência no futuro. Quanto maior a linha, maior a probabilidade de uma reversão de preço ou aumento do movimento de preços após a quebra desse nível. Com a diminuição da probabilidade de formação de nível, o comprimento da linha é reduzido. O indicador "Level Predictor" não requer ajustes. Nas configurações, você pode alterar o design do indicador. O botão " Line_Length " é exibido no gráfico par
    Filtro:
    krisnara123
    2180
    krisnara123 2020.12.11 14:22 
     

    O usuário não deixou nenhum comentário para sua avaliação

    Responder ao comentário