Length Movement MT5

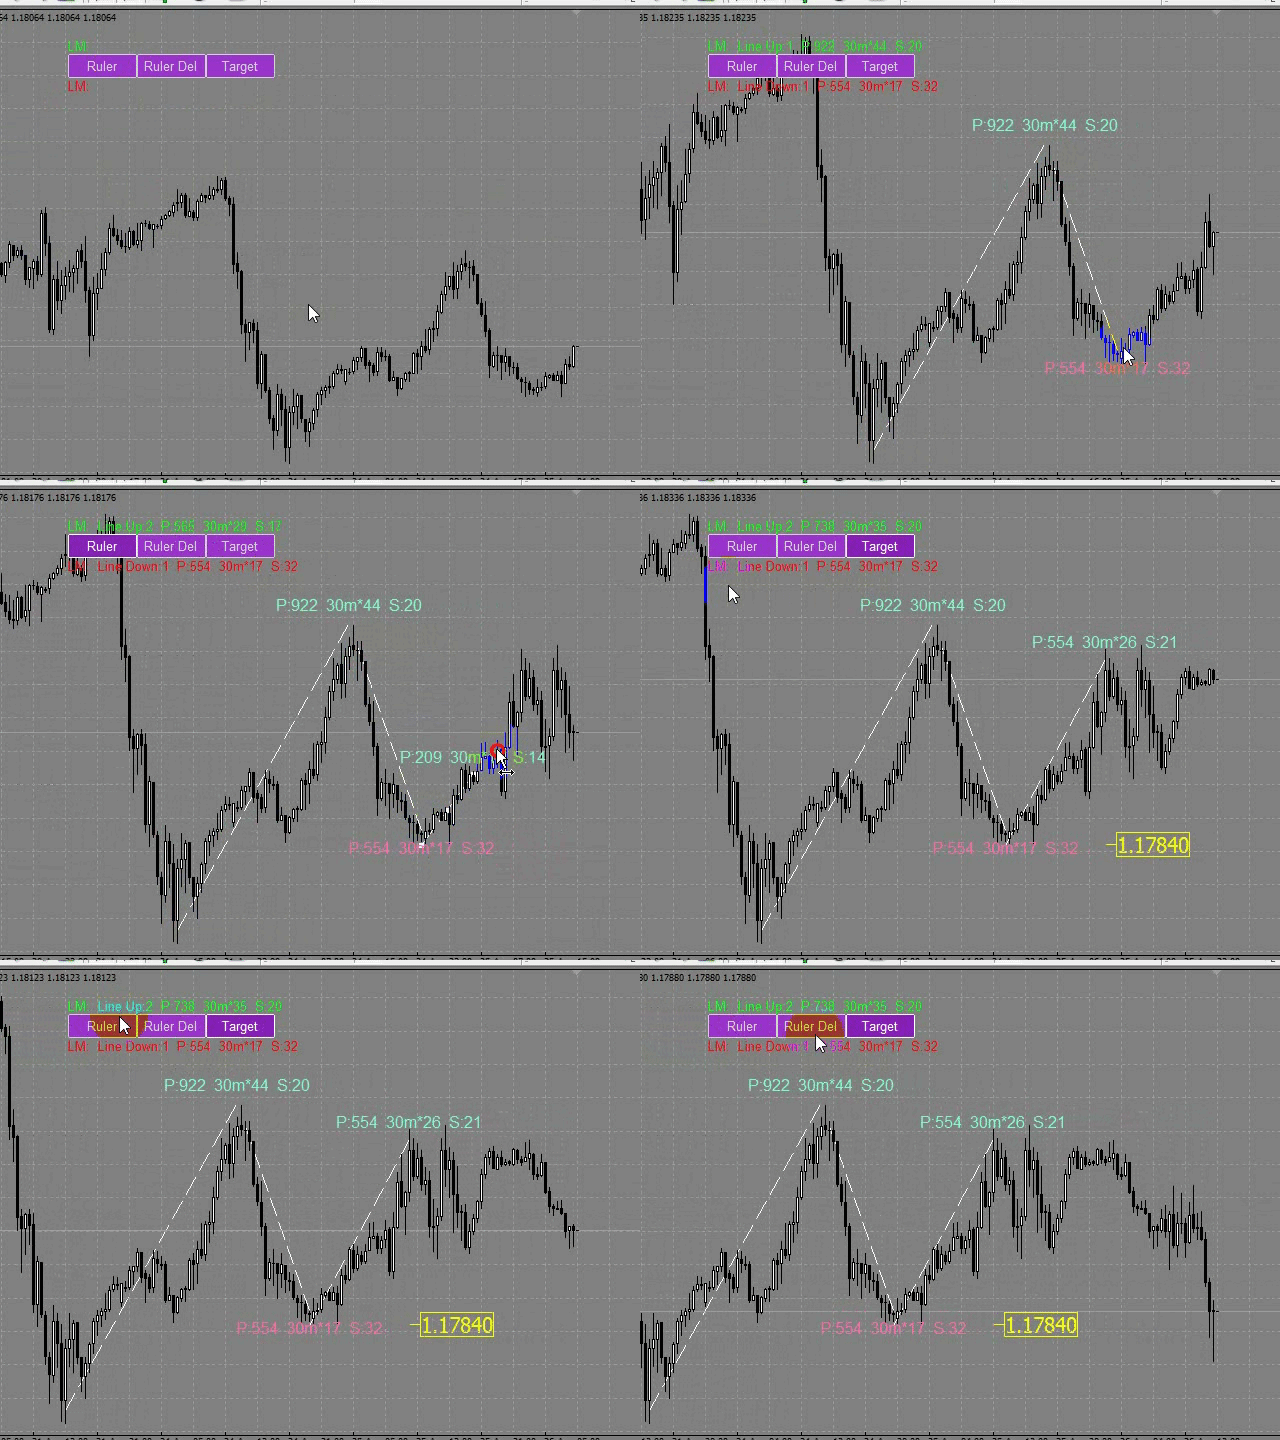
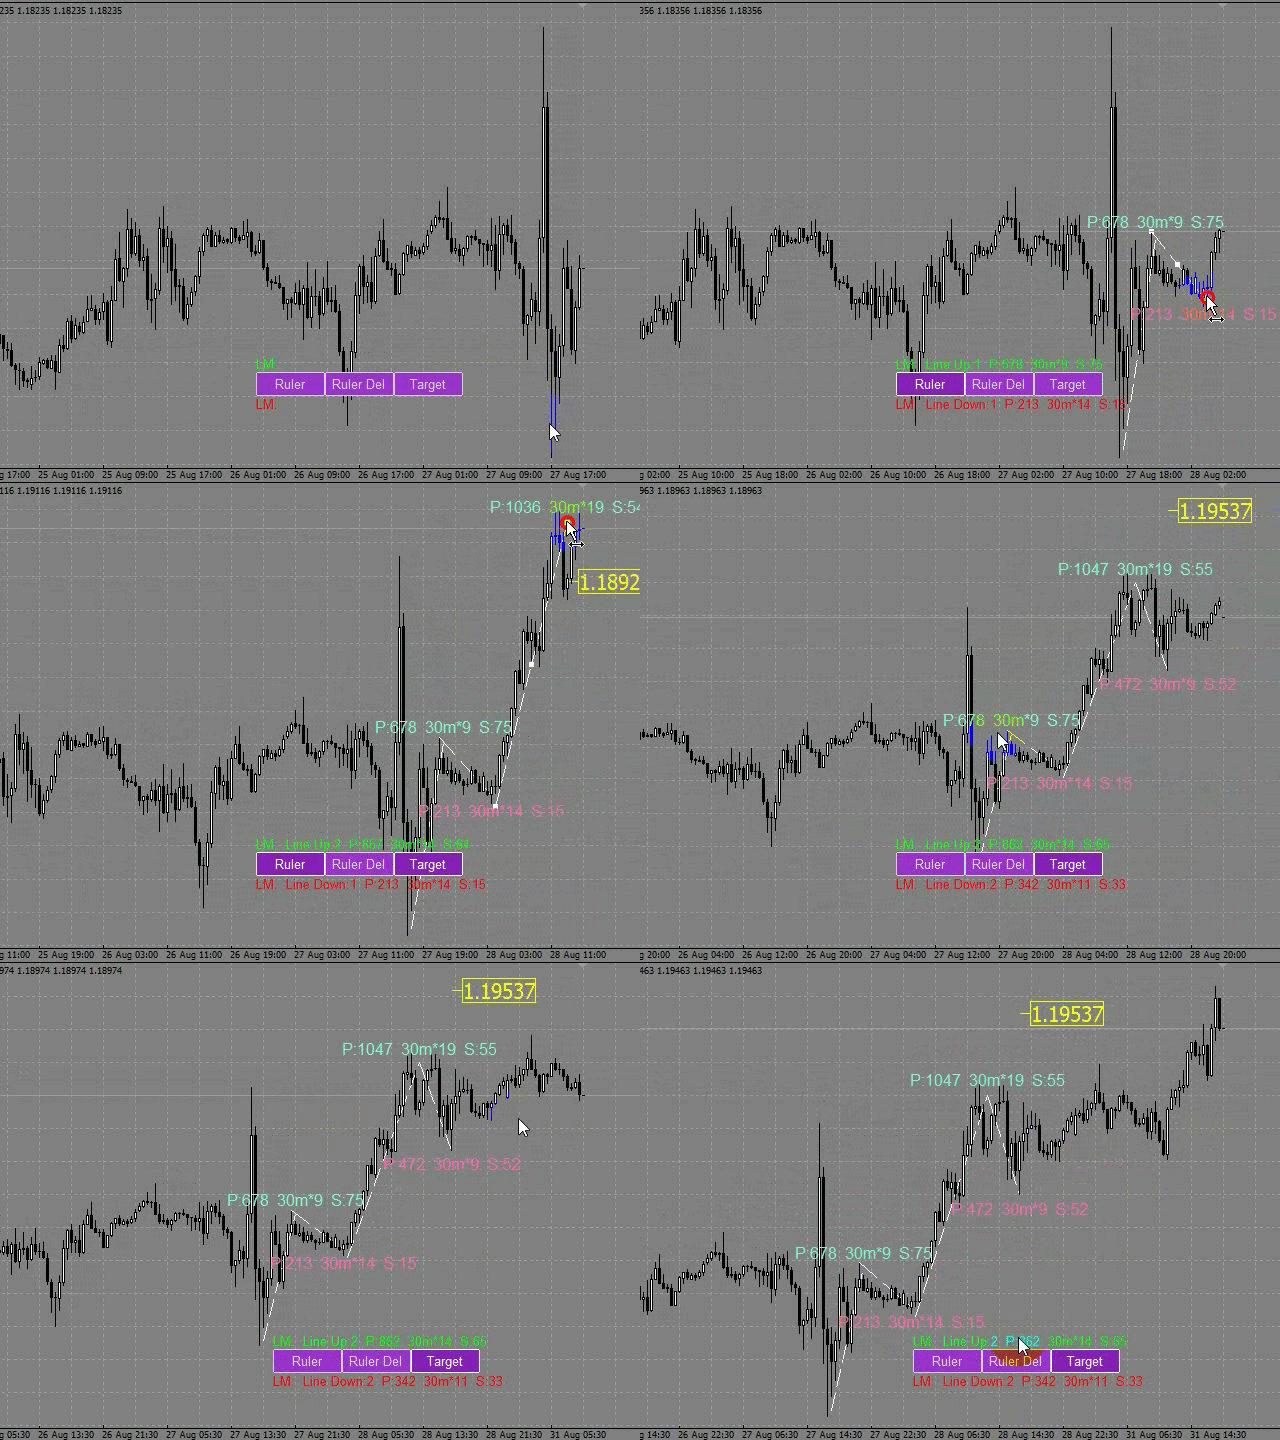
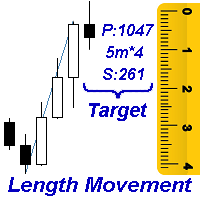
Measures the length of the selected movement in points, shows the duration of the movement, as well as the speed of movement. Outputs the average value of each dimension.
It is designed to calculate the expected target based on typical market movements.
The intended goal will provide information about the ratio of the stop size to the possible profit and will allow you not to open positions with a small expected profit.
It will also help you determine the point at which it is more logical to close a position. 

Note: the MT5 tester is not designed for full-fledged work with graphic objects, so drawing in the tester is slower than in the real situation.
Lines are selected with 1 mouse click.


Building a line
: click the "Ruler" button and draw a line (clicking the mouse - the first point of the line, where the mouse is released - the second point of the line).
(Lines, text placemarks, and the goal are only visible on the time graph where they were drawn.)

Line changes: select a line and drag it with the mouse.
When you rebuild a line, the value of the text label and the goal (if the goal is enabled) will change immediately.

Delete all measurement lines: click "Ruler_Del". During the number of seconds selected in the "Ruler_Del_Cancel" setting, the "Ruler_Del" button can be clicked to cancel, and the "Ruler_Del" command will be canceled.

Delete the selected measurement lines: select the measurement line and press "delete" on the keyboard. The text label from the measurement line will also be removed, and the goal will change.

Building a goal: the "Target" button sets/deletes a goal. To calculate the goal, you need at least two lines in different directions.

Line_Metrics - Text label of the line.
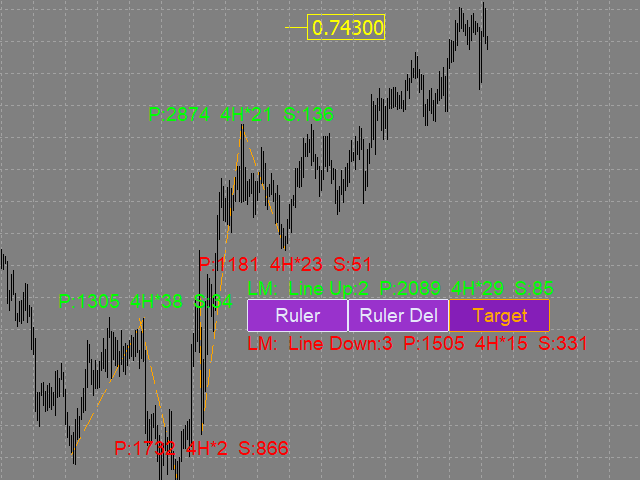
For example, we have an ascending line with the parameters: P:817 4H*10 S: 81. the line Length is 817 points, the line is drawn on a 4-hour chart, based on 10 candles, (that is, the time of the movement(line) is 40 hours).
The speed of the motion in paragraphs 81. This means that on average, each candle participating in the line construction passed 81 points.

Average_Lines_Metrics - Text label for "average values". LM: Line Up:3 P:1586 4H*40 S: 39 means that the text label of the average value is calculated based on 3 ascending measuring lines Line Up: 3 (measuring lines of 0 points, lines of other time periods and tools are not taken into account in the calculations).
The average line length in points is 1586 points P:1586.
The graph where the lines are counted is 4-hour 4H*40. On average, the line consists of 40 4h*40 candles.
On average, the price passes 39 points S:39 per candle.

The size of buttons and text labels for "average values" depends on the font in the Button_Font setting and its size in the Button_FontSize setting.
On-screen buttons can be dragged with the mouse.
You can assign keyboard shortcuts to on-screen buttons (a-Z, 0-9).

Settings

  • Ruler_key - hotkey for drawing a measuring line (you can assign (a-Z, 0-9)) .
  • Ruler_Del_key - hotkey for deleting all measuring lines (you can assign (a-Z, 0-9)) 
    (measurement lines are deleted after the pause selected in the Ruler_Del_Cancel setting).
  • Target_or_Target_Del_key - hotkey for setting / deleting a goal (a-Z, 0-9)
  • (you need at least two lines in different directions to set a goal).
  • Ruler_Del_Cancel - time to cancel the Ruler_Del_key command (in seconds).
  • Button_Background_Color - buttons background color (if Button_Background_Color=clrNONE, the buttons background is the same as the graph background color).
  • Button_Pressed_Color - color of the text and border of the Ruler button when pressed.
  • Line_Metrics_Indent - indent of the text label from the measuring line (in points).
  • Line_Metrics_Orientation - displays the labels of measuring lines vertically / horizontally / diagonally.
  • Target_Orientation - left-hand / right-hand placemark of the goal.
  • Here are the most important settings. You can also change the following characteristics for measuring lines, buttons, and text labels: color, thickness, font, and font size.
    推荐产品
    Footprint Chart Pro — Professional OrderFlow EA for MetaTrader 5 Version 6.34 | Professional tool for real traders | Institutional-Grade Visualization DEMO USERS - PLEASE SELECT EVERY TICK / REAL TICK WHEN TESTING AND YOU HAVE DOWNLOADED HISTORICAL DATA. IF YOU SEE A WAITING SCREEN AND IT IS NOT DOWNLOADING, IT MEANS YOU HAVE LOW HISTORICAL DATA. TRY 1 MIN AND 5 MIN FIRST ON 1 DAY DATA. ONE DAY DATA SHOULD BE THE NEWEST AND MOST CURRENT DATE. PLEASE WAIT UNTIL THE MARKET HAS ROLLED OVER PERIOD.
    A Média Móvel é um indicador que faz parte da Análise Técnica. Com ela, é possível identificar o equilíbrio dos preços no mercado, observando tendências de alta, neutra ou baixa. Este indicador customizado traz opções extras pera definir o método de cálculo podendo-se esclolher entre SMA,EMA,SSMA,LWMA,JJMA,JurX,ParMA,T3,Vidya,AMA,HULL MA. Também conta com varias opções para escolher o método de cálculo para o preço base a ser usado no cáculo da média.
    Currency Trailing Gold 是 免费、受限版本 的 Currency Trailing ,这是一款智能利润锁定EA,根据 真实货币价值 进行追踪,而不是点数或点位。 该免费版本仅适用于 XAUUSD (Gold) ,让您可以在全球最受欢迎的交易品种之一上免费体验完整的追踪功能。 想在所有交易品种上使用Currency Trailing吗? 完整版 支持您账户中的所有外汇货币对、金属、指数和加密货币。 仅需$39即可在 gromastech.com/full-currencytrailing 获取完整版 Currency Trailing ,基于真实资金的智能利润锁定! 厌倦了基于点数或点位的追踪方式,而这些并不能反映您的真实收益? 使用 Currency Trailing ,您可以根据实际 货币价值 来追踪利润,使用账户货币计价,让您完全掌控真正重要的东西,您锁定并保护的资金。 工作原理: 设置 触发金额 和 锁定金额 ,两者均以货币计。 示例: Trigger = $20 Lock = $10 当任何交易达到 $20的浮动利润
    FREE
    IC Flat Pro The True Math
    Aruncharan Ganapathy Sivakumar
    IC FLAT PRO – THE TRUE MATH   Early Adopter Pricing Secure IC FLAT PRO – THE TRUE MATH at the current launch price. Once the first 10 purchases  have been sold, the price will increase by USD 300 . Institutional-Grade Market Structure Analysis for MetaTrader 5 IC FLAT PRO – THE TRUE MATH is a premium institutional-grade market structure indicator developed for serious traders who demand precision, consistency, and high-quality trade opportunities. Built using advanced mathematical algorithms
    PassPropFirm MT5
    Yana Korchevska
    Pass Prop Firm is a high-frequency trading Expert Advisor specifically designed to help traders pass the prop firm evaluation phase (such as the HFT Challenge). With powerful scalping and smart order management logic, this EA aims to hit profit targets quickly and efficiently—ideal for traders seeking to meet demo account goals in record time. MT4 version myfxbook.com/portfolio/pass-prop-firm-mt5/11625306 myfxbook.com/portfolio/pass-prop-firm-mt4/11622480 Currency Pair : Optimized for DE40 (DAX
    "Impulses and Corrections 5" is created to help traders navigate the market situation. The indicator shows multi-time frame upward and downward "Impulses" of price movements. These impulses are the basis for determining the "Base" , which is composed of zones of corrections of price movements, as well as "Potential" zones for possible scenarios of price movement. Up and down impulses are determined based on a modified formula of Bill Williams' "Fractals" indicator. The last impulse is always "U
    Pulsar Terminal 是 Astralys LLC 旗下商标 Pulsar Technologies 的产品。 Pulsar Terminal是MetaTrader 5的实用工具插件。它是一个 可视化界面 ,结合了 配套应用程序 中的执行工具,通过 Expert Advisor 连接到您的MetaTrader 5账户。我们使用配套应用程序来最大化工具的功能,并提供比标准MT5面板更先进的可视化界面和工作流程。Pulsar Terminal不是独立应用程序,需要MetaTrader 5才能运行。EA与Pulsar Terminal配套应用程序 仅通过localhost 通信。配套应用程序的安装程序通过安装指南(MQL5博客文章)提供给购买者。 该界面允许您执行订单、管理风险、查看交易统计数据,以及通过连接到MetaTrader 5的配套应用程序中的高级图表工具直接进行图表分析。 安装指南(MQL5博客): 将在产品批准后发布 用户指南(MQL5博客) 重要 - 运行条件 1) MetaTrader 5必须在与配套应用程序相同的PC上打开(通过EA的仅限localhost连
    ClusterSecondForex
    Rafil Nurmukhametov
    4.67 (3)
    该工具允许绘制不同类型的图表。 秒图从1秒到86400秒 从1滴答开始的滴答图 成交量图 三角洲图 仁科图 范围图 用于体积分析的内置指标。 产品演示 https://www.mql5.com/ru/channels/clustersecondforex 每日市场概况和所选时间框架的市场概况。 集群搜索。 不平衡。 VWAP。 动态POC、VAH、VAL 价格窗口简介 具有不同表现形式的垂直体积。 δ,有不同的可视化选项。 当前的和高的时间框架极 地下室蜡烛图指标 为了控制该图表,我们使用了 鼠标左键--移动图表,在设置中选择不同模式,调用位于屏幕左下角螺丝刀键图标下的主设置窗口。 鼠标右键 - 用于输入位于屏幕左上角图标下的图形结构的设置,以及绘制垂直、水平、趋势线和矩形的个别设置。 在图表区域旋转鼠标滚轮--左右移动图表,按住Ctrl键--上下移动图表,在价格比例区域--按价格比例,在时间轴区域--按时间比例。 H键--在图表上或体积区建立一条水平线(必须启用 "画水平线 "图标),Shift+H键--删除所有水平线。 V键 - 设置垂直线(必须启用 "画垂直线 "图标),S
    TLM Gold Master Trading System A Professional Gold Trading Decision & Signal System for MetaTrader 5 The TLM Gold Master Trading System is a specialized MT5 indicator designed for traders who want a structured, multi-factor approach to analyzing Gold (XAUUSD). Instead of relying on a single indicator, the system combines trend direction, higher-timeframe confirmation, market volatility, momentum, pullback conditions, automatic support/resistance zones, and ATR-based price-space analysis into
    Cosmic Nebula Oscillator
    Pieter Gerhardus Van Zyl
    Cosmic Nebula Oscillator is a momentum and trend-strength oscillator designed to visualize market pressure using color-coded histogram states. It transforms directional energy into four intuitive cosmic phases plotted around the zero line (event horizon), making it easy to read both direction and quality of momentum at a glance. The indicator classifies market conditions into: Neutron Star (bright blue): strong bullish momentum with expanding energy. Nebula Glow (purple): bullish bias, but momen
    SolarTrade Suite 金融机器人:LaunchPad 市场专家 - 专为开启交易而设计! 这是一个使用特殊创新和先进算法来计算其价值的交易机器人,是您在金融市场世界中的助手。 使用我们来自 SolarTrade Suite 系列的指标集来更好地选择启动此机器人的时机。 在描述底部查看我们来自 SolarTrade Suite 系列的其他产品。 您想自信地驾驭投资和金融市场的世界吗? SolarTrade Suite 金融机器人:LaunchPad 市场专家是一款创新软件,旨在帮助您做出明智的投资决策并增加您的利润。 SolarTrade Suite 金融机器人的优势:LaunchPad 市场专家: - 准确计算:我们的机器人使用先进的算法和分析方法来准确预测市场走势。 计算购买和出售资产的最佳时机。 - 用户友好界面:直观的界面将使您能够轻松掌握程序并在安装后立即开始享受其好处。 - 专家支持:我们的专业团队随时准备为您解答任何问题,并为您提供有关使用该程序的建议。 立即试用 SolarTrade Suite 金融机器人:LaunchPad Market
    Mine Farm
    Maryna Kauzova
    Mine Farm is one of the most classic and time-tested scalping strategies based on the breakdown of strong price levels. Mine Farm is the author's modification of the system for determining entry and exit points into the market... Mine Farm - is the combination of great potential with reliability and safety. Why Mine Farm?! - each order has a short dynamic Stop Loss - the advisor does not use any risky methods (averaging, martingale, grid, locking, etc.) - the advisor tries to get the most
    CornGrid
    Mohamad Akram Bin Mohd Jamil
    CornGrid EA MT5 – Advanced Algorithmic Trading System Official Website:   https://corngrid.com Platform: MetaTrader 5 (MT5) | Version:  2.10 Executive Overview CornGrid EA is a sophisticated, fully automated Expert Advisor engineered for MetaTrader 5. Built upon a high-probability Reverse-Candle Entry Algorithm combined with a Dynamic Smart Grid Recovery Model , CornGrid EA is designed to capitalize on short-term market mean-reversion and structural price retracements. Unlike traditional mome
    VR Grid Mt5
    Vladimir Pastushak
    3.25 (8)
    VR 网格指示器 设计 用于创建具有用户定义设置的图形网格。与 标准网格 不同,VR 网格用于构建 圆形关卡 。根据用户的选择,轮次级别之间的步长可以是任意的。此外,与其他指标和实用程序不同,即使时间段发生变化或终端重新启动,VR Grid 也能保持网格的位置 。 设置、设置文件、演示版本、说明、问题解决,可以从以下位置获取 [博客] 您可以在以下位置阅读或撰写评论 [关联] 版本为 [MetaTrader 4] 垂直级别 基于实际时间间隔并 忽略缺失 或不存在的周期。因此,级别之间的步长严格对应于用户选择的值。 使用 VR 网格指标时,交易者 可以更改任何级别的垂直线和水平线的样式 、颜色和粗细。这使您可以控制金融工具的 回合水平 。 整数位是 以两个或多个零结尾 的价格(例如:1.23500、5.65900、1923.200)。人们相信,这样的水平 经常充当 作为支撑或阻力的强点。 Horizontal line settings Horizontal line step Horizontal line color Horizontal line style Horizonta
    FREE
    Multi-Timeframe Heiken Ashi (Smoothed with Dashboard) Professional Market Structure Visualization with Weighted Confluence Scoring Transform your trading with crystal-clear multi-timeframe analysis. This indicator combines smoothed Heiken Ashi candles with an intelligent weighted scoring system to give you unprecedented clarity in any market condition. YOUR TRADING QUESTIONS – ANSWERED INSTANTLY: 1. What's the REAL trend direction? Dashboard Reveals:   Higher timeframe (MN1, W1, D1, H4) trend a
    Gold Zenix
    Md Billal Hossain
    隆重推出 ZENIX EA — 您的黄金市场精英伴侣 欢迎使用 ZENIX — 专为 XAU/USD(黄金)打造的新一代 EA。ZENIX 不仅仅是一个自动交易系统,更是一个精准的引擎,其使命只有一个: 凭借智能、灵活和强大的功能,主宰黄金市场。 ***限时特惠 - 即将结束*** 下次价格上涨至 200.46 美元 切勿错过以优惠价购买“Zenix”的机会。 每购买 5 次,价格将上涨 100 美元。 无论您是专业的散户交易者、信号提供商还是投资组合经理,ZENIX 都将彻底改变您的黄金交易方式——将波动转化为机遇,将风险转化为可衡量的控制。 第一阶段:核心理念——智能与黄金的碰撞 ZENIX 的核心是一个多层决策引擎,它: 像经验丰富的交易员一样,利用价格行为、波动性和动量动态解读市场。 从市场背景中学习,过滤噪音,避免假突破。 在统计上有利的区域以外科手术般的精准度执行。 这不是一个静态网格或随机入场机器人。这就是 ZENIX: ️ 为黄金而设计。由数据训练。为胜利而部署。 第二阶段:值得信赖的技术 自适应算法逻辑 ZENIX
    Volume flow Profile
    Israr Hussain Shah
    大师版是一款专业级的分析工具,旨在通过成交量和资金流向的视角来可视化市场结构。与标准的成交量指标不同,该工具直接在图表上显示每日成交量分布,让您准确看到价格发现发生的位置以及“聪明钱”的定位。 此大师版专为清晰度和速度而设计,具有独特的自动主题同步系统,加载后即刻美化您的图表布局。 主要特点: 真实资金流向计算: 超越标准的跳动量。启用“Use Money Flow”时,成交量按价格加权,揭示了特定价格水平的实际资金投入。 价值区域 (VA) 可视化: 自动计算价值区域(默认为成交量的70%)。 VA填充: 为价值区域背景着色,以便即时识别控制区域。 关键水平: 清晰标记控制点 (POC)、价值区域高点 (VAH) 和价值区域低点 (VAL)。 专业标记系统: 扫描概况结构以识别关键交易区域: HVN (高成交量节点): 接受和盘整区域(支撑/阻力)。 LVN (低成交量节点): 拒绝区域或“快速通过”区域。 所有标记均向右绘制延长线,便于监控。 Delta 背离(左侧直方图): 左侧直方图可视化每个级别的买卖压力对比。这有助于识别隐藏的背离——即价格可能上涨,但卖家在这些水平上激进打
    Code Green
    Md Wakiluzzaman Raz
    Code Green EA This is a breakout strategy featuring advanced market confirmation and robust risk management. The system is designed to be highly flexible, offering the choice to utilize a Martingale recovery module or trade without it. Performance & Transparency This EA is built to provide realistic, sustainable results rather than inflated or unrealistic returns. While I have conducted my own internal forward testing, I encourage all traders to verify the strategy’s performance independently on
    Cumulative Volume Delta MA-X MTF(带梯度动量) 该指标为 MetaTrader 5 提供多时区累积成交量德尔塔(CVD)分析。它通过分析报价成交量(Tick Volume)或真实成交量(Real Volume)数据,计算买盘与卖盘压力之间的净差值,从而直观地展示订单流(Order Flow)情绪。 指标逻辑与特性 本指标采用数学方法进行成交量分析: 数据来源 :支持交易所资产的 真实成交量 (Real Volume) ,以及针对外汇/CFD 市场的 OHLC 影线代理算法 (OHLC Wick Proxy) 。 梯度系统 :4 色移动平均线用于识别趋势阶段: 深天蓝 (DeepSkyBlue) :数值为正且正在上升。 橙色 (Orange) :数值为正但正在下降。 洋红色 (Magenta) :数值为负且正在下降。 紫色 (Purple) :数值为负但正在上升。 五层共振系统 (5-Layer Confluence System) 指标集成了五种不同的分析方法: 第一层:成交量德尔塔核心 (Volume Delta Core) —— 计算成交量德尔塔的
    Gold Dashboard Trend Indicator Multi-Timeframe Trend, Volatility & Momentum Analysis with Manual S/R Context Gold Dashboard Trend Indicator is a rule-based technical analysis tool designed to identify potential trend-continuation opportunities by combining current-timeframe trend direction, higher-timeframe confirmation, EMA slope, ATR-based volatility analysis, pullback detection, momentum confirmation, and optional manual Support & Resistance context. The indicator is designed with a strong fo
    ICT Kill zone and Macros Indicator mark and display the following zone times on the chart: Kill zones   Kill zone Forex Asian London Open New York Open London Close Central Bank Dealing range Kill zone Indices Asian London Open New York AM New York Lunch New York PM Power Hour Macros London 1 London 2 New York Am 1 New York AM 2 New York Lunch New York PM 1 New York PM 2 Silver bullet London Open New York AM New York PM Sessions Asian London New York Chart The display of  Kill zone , Macro ,
    Net Z
    Sugianto
    5 (1)
    NET Z uses a very well-known trend reversal technique to determine position entry with slight modifications by using virtual trade techniques and virtual pending orders so that position entry is not too early or too late. Why NETZ? NET Z does not require complicated settings and is easy to use because user only need to upload a set file that is already available. Currently there are set files for 20 fx pairs. The best GRID EA with the ability to control risks. I will share my personal daily rou
    Gold Scalper Ultimate – Automated Scalping Expert Advisor for MT5 Gold Scalper Ultimate is an automated Expert Advisor developed for short-term trading and scalping strategies in the Forex market. The EA uses ATR-based trade management and optional Heikin Ashi analysis to identify trading opportunities and manage positions automatically. It is designed for fast market environments and supports flexible configuration for different trading styles and risk preferences. Trading Logic The EA analyze
    ClusterSecond
    Rafil Nurmukhametov
    4.78 (32)
    该工具允许绘制不同类型的图表。 秒图从1秒到86400秒 从1滴答开始的滴答图 成交量图 三角洲图 仁科图 范围图 用于体积分析的内置指标。 该工具的演示版 https://www.mql5.com/ru/channels/clustersecond 每日市场概况和所选时间框架的市场概况。 集群搜索。 不平衡。 VWAP。 动态POC、VAH、VAL 价格窗口简介 具有不同表现形式的垂直体积。 δ,有不同的可视化选项。 当前的和高的时间框架极 地下室指标烛台显示 也可以从图表中进行交易。 注意:该工具是为具有真实(交换)量的市场设计的。 它不适合外汇市场。它在VPS上不起作用。它在策略测试器中不起作用。 为了控制该图表,我们使用了 鼠标左键 - 移动图表,在设置中选择不同的模式,调用位于屏幕左下角带螺丝刀的钥匙图标下的主设置窗口。 鼠标右键 - 用于输入位于屏幕左上角图标下的图形结构的设置,以及绘制垂直、水平、趋势线和矩形的单独设置。 在图表区域旋转鼠标滚轮--左右移动图表,按住Ctrl键--上下移动图表,在价格比例区域--按价格比例,在时间轴区域--按时间比例。 H键--在
    Candle hunter
    Ruslan Khasanov
    5 (1)
    圖形分析指標。 在圖表上標記主要的日本燭台形態。 目前,交易者可以使用以下一組模式:  - Bearish/Bullish Abandoned Baby;  - Bearish Advance Block;  - Bearish Deliberation;  - Bearish/Bullish Belt Hold;  - Bearish/Bullish Engulfing;  - Bearish Shooting Star;  - Bearish Evening Star;  - Bearish Evening Doji Star;  - Bearish/Bullish Doji Star;    - Bearish/Bullish Tri-Star;  - Bearish Hanging Man;  - Bearish/Bullish Harami;  - Bearish/Bullish Harami Cross;  - Bearish Two Crows;  - Bearish Identical Three Crows;  - Bearish Three Black Crows
    Professional Opening Range Breakout (ORB) indicator designed for precision session trading with automatic time handling, breakout alerts, and advanced target levels. This indicator automatically identifies the Opening Range for any configurable session, plots the High, Low, and Midpoint levels, and extends them across the trading day. Built-in breakout detection and alerts, range measurements, and extension targets provide traders with clear structure and actionable levels. Ideal for traders usi
    Pro Experience Only 4 copies available for $99.00. Next price 199 USD ECN Pro Experience is a scalping strategy based on breaking through strong price levels. One of the oldest and most reliable strategies with the author's modernization for the current market. The strategy does not require any optimizations. We installed it on the chart according to the recommendation and enjoy trading!!! Advantages of ECN Pro Experience: - optimal SL/TP ratio - low SL, which makes the system as safe as possi
    Autogrids Light
    Guilherme Emiliao Ferreira
    Autogrids Light – Smart Grid Trading EA for Hedge Accounts Autogrids Light carries the unmistakable DNA of the original Autogrids, preserving its powerful logic and precision while delivering a lighter, more streamlined version. Focused exclusively on the Spot Grid strategy, Autogrids Light dynamically constructs a customizable grid of buy and sell orders around a reference price, automatically placing pending orders according to user-defined distances, volumes, and number of levels. Every o
    ScalperGun
    Mikhail Nazarenko
    Scalper gun  - главное оружие для торговли скальпингом и свингом, с визуализацией и алертом точек входа. Индикатор работает как в трендовых, так и в нетрендовых рыночных условиях. Подходит начинающим и опытным трейдерам.  SCALPER GUN превосходит по скорости, качеству визуализации и точности входа популярные топовые индикаторы этого сайта!!! Перед покупкой скачайте демо Scalper gun и сравните с аналогичными индикаторами для скальпинга в тестере MT4. Особенности Это готовая торговая система с визу
    Pairs synthetique mt5
    Vincent Albert Feugier
    Pairs Synthetic Pro (Synthetic Pairs & Spread) Master Correlation Trading Correlation trading and statistical arbitrage are now within your reach thanks to the Pairs Synthetic Pro indicator. This tool goes beyond simple ratio analysis, acting as a specialized radar for detecting price imbalances between two assets to anticipate market corrections. For example, when Brent rises while WTI lags, the price spread widens. Our indicator, integrated with adaptive Bollinger Bands, identifies when this d
    该产品的买家也购买
    Trade Assistant MT5
    Evgeniy Kravchenko
    4.41 (216)
    它有助于计算每笔交易的风险,容易安装新的订单,具有部分关闭功能的订单管理, 7 种类型的追踪止损和其他有用的功能。   附加材料和说明 安装说明   -   应用程序说明   -   模拟账户应用程序的试用版 线条功能  - 在图表上显示开仓线、止损线、止盈线。 有了这个功能,就可以很容易地设置一个新的订单,并在开仓前看到它的附加特性。   风险管理  - 风险计算功能在考虑到设定的风险和止损单的大小的情况下,计算新订单的成交量。它允许你设置任何大小的止损,同时观察设定的风险。 批量计算按钮 - 启用 / 禁用风险计算。 在 " 风险 " 一栏中设置必要的风险值,从 0 到 100 的百分比或存款的货币。 在 " 设置 " 选项卡上选择风险计算的变量: $ 货币, % 余额, % 资产, % 自由保证金, % 自定义, %AB 前一天, %AB 前一周, %AB 前一个月。   R/TP 和 R/SL - 设置止盈和止损的关系。 这允许你设置相对于损失的利润大小。 例如, 1 : 1 - 这决定了 TP = SL 的大小。 2 : 1 - 这意味着 TP 是 SL 的两倍。 RR -
    欢迎来到 Trade Manager EA——这是一个终极风险管理工具,旨在使交易变得更直观、精准和高效。它不仅仅是一个下单工具,而是一个用于无缝交易计划、仓位管理和风险控制的全面解决方案。不论您是新手交易员、资深交易员,还是需要快速执行的剥头皮交易员,Trade Manager EA 都可以满足您的需求,适用于外汇、指数、大宗商品、加密货币等各种市场。 借助 Trade Manager EA,复杂的计算已成过去。只需分析市场,在图表上用水平线标记入场、止损和止盈,设置您的风险水平,Trade Manager 就会立即计算出理想的头寸规模,并实时显示以点、账户货币计价的止损和止盈。每笔交易都得以轻松管理。 主要功能: 头寸规模计算器 :根据定义的风险瞬间确定交易规模。 简单的交易计划 :在图表上用可拖动的水平线直接计划交易,设置入场、止损和止盈。 实时显示 SL 和 TP :以账户货币、点或分显示止损和止盈,便于分析。 高级保护工具 盈亏平衡选项 : 基本盈亏平衡 :当您的交易达到设定水平时自动保护利润。 多级盈亏平衡 :设置多达 4 个级别以逐步保护利润。 尾随止损选项 : 基本尾随
    ================================================================================ POC BREAKOUT - V20.72. Full Professional Grade Toolkit ================================================================================ POC Breakout is a full MetaTrader 5 trading dashboard for discretionary traders who want breakout signals, Point of Control (POC) context, volume profiles, order flow, market structure, news, alerts, and advanced trade planning in one professional workspace. Attached directly to you
    测试版发布 Telegram to MT5 Signal Trader 即将进入正式的 Alpha 版本。一些功能仍在开发中,您可能会遇到一些小错误。如果您遇到问题,请反馈,您的意见将帮助我们改进软件。 Telegram to MT5 Signal Trader 是一款强大的工具,能够将 Telegram 频道或群组的交易信号自动复制到您的 MetaTrader 5 账户。 支持公开和私人频道,可将多个信号提供者连接至一个或多个 MT5 账户。软件优化、高效、稳定,精准控制每笔复制交易。 界面简洁,仪表盘美观,图表交互性佳,导航直观。您可以管理多个信号账户,自定义每个提供者的设置,并实时监控所有操作。 系统需求 由于 MQL 限制,EA 需要配合 PC 端应用与 Telegram 通信。 安装程序可通过官方 安装指南 获取。 核心功能 多提供者支持: 从多渠道复制信号至多个 MT5 帐户 高级信号识别: 关键词、模式和标签全面自定义 逐提供者控制: 可启用/禁用特定信号类型、平仓策略等 灵活风险管理: 固定手数、固定金额、余额/权益百分比、部分平仓设置 可定制 SL/TP: 覆盖信号
    TradePanel MT5
    Alfiya Fazylova
    4.88 (167)
    交易面板是一款多功能交易助手。该应用包含超过50种手动交易功能,并允许您自动执行大多数交易任务。 应用程序说明 + 视频教程: https://www.mql5.com/zh/blogs/post/761102 用于模拟账户的应用程序试用版: https://www.mql5.com/zh/blogs/post/762579 如何安装应用程序: https://www.mql5.com/zh/blogs/post/762580 如何在可视化模式下测试应用程序: https://www.mql5.com/zh/blogs/post/770278 如何在VPS MetaTrader上安装应用程序: https://www.mql5.com/zh/blogs/post/770196 贸易. 只需单击一下即可执行交易操作: 打開掛單和頭寸,並自動計算風險。 一鍵打開多個訂單和頭寸。 打開訂單網格。 按組別關閉掛單和頭寸。 反轉頭寸方向(關閉買入>打開賣出,關閉賣出>打開買入)。 鎖定頭寸(通過開啟缺少的頭寸,使買入和賣出頭寸的數量相等)。 一鍵部分關閉所有頭寸。 將所有頭寸的止盈和止損設置在同
    The product will copy all telegram signal to MT5 ( which you are member) , also it can work as remote copier.  Easy to set up, copy order instant, can work with almost signal formats, image signal,  s upport to translate other language to English Work with all type of channel or group, even channel have "Restrict Saving Content", work with  multi channel, multi MT5 Work as remote copier: with signal have ticket number, it will copy exactly via ticket number. Support to backtest signal. How to s
    Global Investing FX Terminal
    Santiago Nicolas Pla Casuriaga
    Global Investing FX Terminal 是一款面向 MetaTrader 5 的一体化外汇仪表盘——涵盖央行政策利率、CFTC COT 持仓、利差排名、经济意外指数、期权偏斜、散户情绪与相关性,共十三个分析面板——以单一无闪烁画布呈现,每 10 秒从单个挂载 EA 刷新一次,无需任何外部软件。 专业外汇分析需要同时调取通常分散在不同平台的数据:利率衍生品、政府数据门户、券商掉期规格、期权台。此 EA 将所有这些整合到交易终端内的单一界面中,在您执行决策的地方完成分析。 仪表盘上显示的内容 市场概览 外汇对列表 — 所有 28 个 G10 货币对,加上当券商 Market Watch 中存在 NOK/SEK 交叉盘时显示的交叉盘——最多共 36 个货币对——的实时买卖价。每行显示点差、日度与周度变化、以点数表示的绝对区间,以及 ADR%——当前交易时段区间占 14 日平均日区间的百分比。ADR 达到 95% 的货币对已消耗其统计日内延伸空间;伦敦盘中场 ADR 仅 25% 的货币对仍有运行余地。颜色逐 Tick 实时更新。 货币对详情 — 点击列表中的任意行,即可打开该
    Power Candles 策略扫描器——自优化多符号设置查找器 Power Candles策略扫描器 采用与Power Candles指标相同的自优化引擎,可同时扫描您“市场观察”中的所有交易品种。一个面板即可显示当前哪些品种在统计上具备交易价值、每种策略的最佳应用方向、最优止损/止盈组合,并在新信号触发时立即向您发送提醒。 本工具是 Stein Investments 生态系统的一部分 - 18+ 款工具,加上 Max,您的一对一 AI 交易导师。  随时在线,深入了解每一款指标,在您需要梳理思路的那一刻就在那里。  立即认识他: https://stein.investments 您的全面市场监控。每个交易品种超过3,000次自动优化。2种警报类型。一键切换图表并采取行动。 为何您需要此工具 大多数多标的扫描器仅展示价格 波动 。每只股票的波动率、百分比变化、RSI。您仍需自行摸索正确的策略、合适的止损位以及理想的入场阈值。Power Candles策略扫描器针对每只股票自动解答这些问题,仅在数学验证过的交易设置中触发实际入场信号时才会向您发出提示。这就是全部卖点。 自动
    Premium Trade Manager - 内置交易导师的图表面板 Premium Trade Manager 将一位交易导师嵌入您的图表,并在其下搭载完整的执行引擎。像往常一样建立交易,然后让您的 AI 交易导师 Max 读取这笔具体的交易,结合您的实时账户给出直接判断,再由您决定是否下单:止损是否符合纪律化交易的要求、风险规模是否合理、高影响新闻事件是否即将发布、您是否接近资金盘限额。其下是完整的执行引擎,负责点击之后的一切:一键按风险下单、您在图表上拖动规划且交易进行中仍可随时调整的计划、最多四个分批止盈级别、七种移动止损方式、实时资金盘合规检查、新闻屏蔽保护,以及对自身成本进行评级的点差功能。决策由您做出。Max 给出第二次审视。面板负责此后的一切。 购买前先亲手体验。 直接在浏览器中点击实时面板,这是在购买前感受其工作方式的最快途径。 stein.investments/products/premium-trade-manager Max 是您的一对一 AI 交易导师,他直接内置于面板之中。  他了解您的账户、您的设置和您的规则,用您自己的语言回答,并在每笔交易下单前进
    Trading Chaos Expert
    Gennadiy Stanilevych
    5 (11)
    世界上没有本软件的同等产品,它代表一个覆盖交易信号的通用交易 "控制台",自动入场,设置止损和止盈,还有在单一窗口里同时进行多交易尾随终止。EA 的 "三次点击" 直观控制,确保在不同计算机上全方位使用所有功能,包括平板电脑。 与附加的信号指标交互来标记图标,给出实际市场的全貌,EA 令您做出正确的选择,以及在大多数情况下成为胜者一方。内置资金管理算法, 还有自动计算手数, 虚拟订单交易, 以及一些其它从崩溃账户里挽救交易者的 "诀窍"。它不是一个 "黑盒子"。而是一个深思熟虑的交易员的不可或缺的助理, 至少要尝试一次它的动作。 注,在面板上形成的 EA 不能在策略测试员中测试。可以在您的模拟账户里以实时模式检查它, 您可以下载本 EA 的免费版 - 混沌交易 EA 演示 。 EA 表现为一个面板,带有内置功能的交易机器人的,自动基于交易者可直观检查的交易信号入场,完全按照比尔·威廉姆斯的策略“混沌交易:第二版”和“新贸易维度”。在单独的窗口里,EA 识别价格走势的导向,用于指定品种和时间帧的全自动交易模式,也可以多品种并发。 它同时分析 MetaTrader 5“市场观察”窗口中显示
    Farmed Hedge Yield Farming | All Markets (Manual - Hybrid - Semi/Automated EA) VERIFIED TRADING RESULTS - Farmed Hedge Yield Axi Copy:  https://www.mql5.com/en/signals/2356376 - Farmed Hedge Yield Exn Copy:   https://www.mql5.com/en/signals/2356404 - Farmed Hedge Yield V Copy:  https://www.mql5.com/en/signals/2357156 * Before purchasing, please feel free to send me a message if you have any questions about the product or setup. ** After purchase,  Contact me via private message to receive t
    Welcome to ENTRY IN THE ZONE WITH SMC MULTI TIMEFRAME Entry In The Zone and SMC Multi Timeframe is a real-time market analysis tool based on Smart Money Concepts (SMC), designed to analyze market structure, price direction, and key trading zones. It supports both Single-Timeframe Analysis and Multi-Timeframe Analysis, providing a clearer view of the overall market structure across multiple timeframes, with real-time BUY / SELL signals that do not repaint. It is designed to help filter trading op
    Quant AI Agents
    Ho Tuan Thang
    5 (1)
    Quant AI Agents are independent trading Expert Advisors. Instead of trading using a fixed strategy like other conventional EAs, Quant AI Agents   is a   multi-agent AI trading framework   that turns natural-language strategy prompts into live.  WANT THE SAME RESULTS AS MY LIVE SIGNAL?   Use the exact same brokers I do:   IC MARKETS , IC TRADING   .  Unlike the centralized stock market, Forex has no single, unified price feed.  Every broker sources liquidity from different providers, creating un
    VirtualTradePad PRO SE MT5 — MetaTrader 5 专业交易控制中心 VirtualTradePad PRO SE 是一款基于图表的高级交易面板,也是适用于 MetaTrader 5 的交易管理工作区。它专为希望获得更快执行、更清晰持仓控制、结构化交易管理、可视化价位规划,以及直接在图表上完成专业交易流程的交易者而设计。 这不仅仅是一个 BUY / SELL 面板。PRO SE 将手动交易、挂单、持仓管理、部分平仓、篮子利润/亏损控制、加仓均价层级、ATM 规则、信号监控、实时市场信息、策略测试器 (Strategy Tester) 流程以及面向 VPS 的运行方式整合到一个互相关联的界面中。 MT4 版本 | 完整说明和截图 | 如何购买 | 如何安装 | 如何获取日志文件 | 如何测试与优化 | Expforex 的所有产品 为什么交易者会选择这套面板 图表一键交易 ,并支持键盘快速操作 快速完成开仓、平仓、修改、反转、锁仓与部分平仓 深度控制仓位、挂单、总利润与风控逻辑 自动参数计算,减少手动输入与重复劳动 为什么 PRO SE 比标准手动交易更高
    YuClusters
    Yury Kulikov
    4.93 (43)
    Attention: You can view the program operation in the free version  YuClusters DEMO .  YuClusters is a professional market analysis system. The trader has unique opportunities to analyze the flow of orders, trade volumes, price movements using various charts, profiles, indicators, and graphical objects. YuClusters operates on data based on Time&Sales or ticks information, depending on what is available in the quotes of a financial instrument. YuClusters allows you to build graphs by combining da
    Trump Shock Guard
    Thomas Christoph Lipka
    TRUMP SHOCK – Real-Time Market Protection for MT5 TRUMP SHOCK is a MetaTrader 5 risk-management utility designed to react to sudden market-moving news and unexpected volatility. Markets such as Gold, Oil and USD-related instruments can move within seconds following major political statements or breaking news. TRUMP SHOCK monitors important Truth Social posts and general breaking news and can automatically trigger predefined protective actions in MetaTrader 5 — helping you reduce unwanted exposur
    AlgoRadar
    Stephen J Martret
    5 (4)
    AlgoRadar is an on-chart analytics dashboard for MT5 that aggregates Expert Advisor performance across multiple accounts, brokers, and platforms, including both MT4 and MT5 data, into a single live view on your MT5 chart. All analysis runs from the chart interface, with no external applications or manual report processing required. EA Analysis and Ranking For traders running multiple Expert Advisors, AlgoRadar provides a consolidated view of each EA's performance across accounts. Active EAs a
    AI Agent Supervisor is NOT an Expert Advisor. AI Agent Supervisor   is a   multi-agent AI risk & portfolio supervisor   that watches every EA on your account and intervenes in real time.  WANT AN AI PORTFOLIO MANAGER WATCHING YOUR FLEET 24/7?   Run your fleet on the same brokers I do:   IC MARKETS , IC TRADING   .  Unlike the centralized stock market, Forex has no single, unified price feed.  Every broker sources liquidity from different providers, creating unique data streams. The Supervisor r
    EA Auditor
    Stephen J Martret
    5 (5)
    EA Auditor is an independent analysis tool for traders evaluating Expert Advisors and trading signals on MetaTrader 5. It audits backtest reports, reviews posted developer signals, and cross-verifies the two against each other to help traders assess strategies before committing capital. The MQL5 market offers a wide range of Expert Advisors from many developers, with varying approaches, quality, and transparency. EA Auditor provides a consistent, data-driven framework for reviewing them, answer
    Check EA performance  https://www.mql5.com/en/signals/2376164?source=Site +Profile+Seller Spot vs Future Arbitrage EA for MT5 Spot vs Future Arbitrage EA is an automated Expert Advisor designed for MetaTrader 5 that operates using price differences between Gold spot and Gold futures instruments. The strategy opens positions on both instruments simultaneously to take advantage of temporary differences between spot and futures prices. Requirements The trading account must provide both Gold spot
    Custom Timeframe Manager Pro:MetaTrader 5 中的无限时间周期 终端的默认设置通常会隐藏价格变动的重要细节。如果仅将分析局限于经典周期,交易者可能会错失趋势形成的时刻和真实的波动水平。 Custom Timeframe Manager Pro 是一款扩展 MetaTrader 5 边界的专业工具。您可以创建任何自定义周期(包括分数和稀有周期),并像操作终端原生图表一样使用它们。 可选周期类型: 秒级 :任何数值(例如 S1、S5、S15、S30)。 分数级 :用于精细化分析的非标准间隔(例如 M1.5、H1.5、D1.2)。 自定义 :用于战略分析的多日和多周大周期。 您将获得: 全功能图表 :创建的周期像 MT5 原生图表一样工作——您可以在其上应用任何指标、震荡指标、模板和 EA。这不是“覆盖层”,也不是视觉模拟。 即时更新 :行情实时传输,无明显延迟。您的市场观察速度与标准图表一致。 指标稳定运行 :专有技术确保 RSI、MACD 等震荡指标运行流畅,无伪影、无跳动、无重置。实时 K 线更新无需重新计算全部历史数据。 自动恢复 :断网后,工
    Custom Alerts AIO:多市场智能监控,一键启动,无需设置 概述 Custom Alerts AIO 是一款“开箱即用”的高级市场扫描工具,无需额外安装任何其他指标或进行复杂设置。它内置了 Stein Investments 的所有核心指标(FX Power、FX Volume、FX Dynamic、FX Levels 和 IX Power),可帮助您轻松监控所有主要资产类别,如外汇、黄金、指数和加密货币。如果您的经纪商支持股票,您也可以手动添加个股进行监控。 1. 为什么选择 Custom Alerts AIO? 无需额外购买任何指标 • 所有关键指标均已内置,开箱即用。 • 专注于实时预警,不包含任何图形元素,性能高效,界面简洁。 全面覆盖所有主要市场 • 支持监控外汇、金属、加密货币和指数市场。 • 无需手动输入任何交易品种,只需在设置中勾选资产类别即可启用。 • 股票并不属于默认类别,如有需要可手动通过参数输入添加。 高效、专业、便捷 • 无需图表模板和手动加载,适合自动化或远程交易环境。 • 非常适合 VPS 上长期运行,或作为后台市场预警工具使用。 2
    Adam FTMO MT5
    Vyacheslav Izvarin
    5 (2)
    ADAM EA Special Version for FTMO Please use ShowInfo= false for backtesting ! Our 1st EA created using ChatGPT technology Trade only GOOD and checked PROP FIRMS  Default parameters for Challenge $100,000 Tested on EURUSD and GBPUSD only  Use 15MIN Time Frame Close all deals and Auto-trading  before Weekend at 12:00 GMT+3  Friday For Prop Firms MUST use special Protector  https://www.mql5.com/en/market/product/94362 --------------------------------------------------------------------------------
    Mt5 To InterativeBrokers Copier allows you to copy deals from MT5 account to Interactive Brokers. With this, you can run your EA strategy on a MT5 Demo/Real Account, then copy all the deals to Interactive Brokers account real time. Features: 1. Copy or Invert-Copy deals Realtime from MT5 to IB Account. 2. Synchronizing positions of both accounts periodicaly, in case any missing copying. 3. You can choose only Buy position or Sell position. Symbols Setup: General Format:  {MT Symbol} -> {IB S
    EasyInsight AIO MT5
    Alain Verleyen
    4.92 (12)
    EASY Insight AIO – 全能智能交易一站式解决方案 概述 想象一下,您可以在几秒钟内扫描整个市场——外汇、黄金、加密货币、指数,甚至股票——无需手动筛选图表、繁琐安装或配置指标。 EASY Insight AIO 是您专为 AI 交易打造的即装即用数据导出工具。它将整个市场快照一次性输出为简洁的 CSV 文件,直接支持 ChatGPT、Claude、Gemini、Perplexity 等各类 AI 平台的即时分析。 无需窗口切换,无需图表叠加,也没有任何杂乱。只需纯净、结构化的数据自动导出,让您专注于基于数据的高效决策,无需再盯盘耗时。 为什么选择 EASY Insight AIO? 真正的一体化 • 无需设置,无需安装指标,无图表叠加。只需安装、运行并导出——就是这么简单。 多资产全覆盖 • 扫描分析外汇、金属、加密货币、指数、股票——您的券商所能提供的一切市场。 AI 专属数据导出 • 高度结构化、针对 AI 优化的 CSV 文件,直接适配主流智能工具和平台。 完整导出内容: • 三个可选周期的货币强度分析 • 净多头头寸变化体现市场情绪 • 成交量变化、
    The product will copy all  Discord  signal   to MT5   ( which you are member  ) , also it can work as remote copier.  Easy to set up. Work with almost signal formats, support to translate other language to English Work with multi channel, multi MT5. Work with Image signal. Copy order instant, auto detect symbol. Work as remote copier: with signal have ticket number, it will copy exactly via ticket number. How to setup and guide: Let read all details about setup and download Discord To MetaTrader
    FUTURES ORDERFLOW FOOTPRINT CHART Professional OrderFlow EA for MetaTrader 5 Version 1.01| Professional tool for real traders | Institutional-Grade Visualization STRATEGY TESTER USERS - PLEASE SELECT EVERY REAL TICK WHEN TESTING AND YOU HAVE DOWNLOADED HISTORICAL DATA. IF YOU SEE A WAITING SCREEN AND IT IS NOT DOWNLOADING, IT MEANS YOU HAVE LOW HISTORICAL DATA. TRY 1 MIN AND 5 MIN FIRST ON 1 DAY DATA. ONE DAY DATA SHOULD BE THE NEWEST AND MOST CURRENT DATE. PLEASE WAIT UNTIL THE MARKET HAS ROL
    Crystal Trade Manager – Advanced MT5 Risk and Trade Control Utility Overview Crystal Trade Manager (CTM) is a professional MetaTrader 5 utility designed for risk management, trade automation, and instant execution control. It provides traders with an integrated system for protecting equity, managing daily drawdowns, controlling lot sizes, and applying automation features such as automatic SL/TP, break-even, and trailing stop. The tool is suitable for manual traders, prop-firm challenge particip
    Features   With MT5 to Interactive Brokers(IB) Trader, you can: 1. Load chart data from IB to MT5, and Analyze with all standard or customer Indicators. 2. Place Orders to IB Account Directly in MT5. 3. Make your Own EAs upon IB Securities by only making minus changes of the trading function. Usage 1) Installation Copy the "Mt5ToIBTraderEn.ex4" and sample files to [MT5 Data Folder]->MQL5->Experts.  2)  MT5 Settings Add the IP Address to the MT5 Allowed URLs in 'Tools->Options->Expert Adviso
    Indicator Automation XT - Elite Universal Signal Engine Transform any indicator into a high-performance automated trading system instantly. Stop chasing signals and start executing with precision. Indicator Automation XT is the ultimate evolution of signal-to-trade technology for MetaTrader 5. Designed for traders who demand speed, reliability, and institutional-grade risk management, the XT version bridges the gap between your favorite technical indicators and the live market. Whether it is a
    作者的更多信息
    Running along Lines MT5
    Pavel Verveyko
    5 (1)
    The indicator draws support and resistance lines on an important part of the chart for making decisions. After the trend line appears, you can trade for a breakout or rebound from it, as well as place orders near it. Outdated trend lines are deleted automatically. Thus, we always deal with the most up-to-date lines. The indicator is not redrawn . Settings: Size_History  - the size of the calculated history. Num_Candles_extremum  - the number of candles on each side of the extremum. Type_Arrow
    Turn
    Pavel Verveyko
    The indicator shows the market turning points (entry points). Reversals allow you to track rebound/breakout/testing from the reverse side of the lines of graphical analysis or indicators. Reversals can be an independent signal. The indicator allows you to determine reversals taking into account the trend and without it. You can choose a different period for the movement preceding the reversal, as well as the volatility coefficient. When plotting reversals, the indicator takes into account volati
    Length Movement
    Pavel Verveyko
    5 (1)
    Measures the length of the selected movement in points, shows the duration of the movement, as well as the speed of movement.   Outputs the average value of each dimension. It is designed to calculate the expected target based on typical market movements. The intended goal will provide information about the ratio of the stop size to the possible profit and will allow you not to open positions with a small expected profit. It will also help you determine the point at which it is more logical to c
    The indicator allows you to quickly switch from one instrument to another, from one time period to another using the keyboard or buttons on the monitor. Each command can be assigned a hot key from 0-9, a-Z (case-insensitive) and VK_OEM_COMMA ("<" on the keyboard) and VK_OEM_PERIOD (">" on the keyboard). This can help you to operate the maximum number of instruments that are available at your broker, analyze more instruments/periods in less time. This product cannot be tested in the tester , beca
    Ratio TP SL
    Pavel Verveyko
    5 (1)
    This indicator allows you to measure the profitability of each specific transaction (the ratio of Stop and Profit). The indicator allows you to adjust the ratio by step size and number of steps. You can build an unlimited number of ratios to compare the risks from different movements. Note: in MT4, the number of horizontal lines in a single ratio cannot exceed 32. Building a line : click the " Ratio " button and draw a line (mouse click - the first point of the line, where the mouse is release
    Corporate Report
    Pavel Verveyko
    5 (1)
    The script displays info about the share's corporate reports and dividends. The data is downloaded from   investing.com : Report date Profit per share (EPS) Revenue Market capitalization Amount of dividends Date of payment of dividends Dividend income The product cannot be tested in the tester (since it is not possible to receive data from the Internet). Before launching:  Add 2   URL   https://ru.investing.com/earnings-calendar/Service/getCalendarFilteredData  and   https://ru.investing.com/di
    Channel FTF
    Pavel Verveyko
    The Envelopes indicator determines the presence of a trend or flat. It has 3 types of signals, shows the probable retracement levels and levels of the possible targets. The Fibonacci coefficients are used in the indicator's calculations. Signals (generated when touching the lines or rebounding from lines): Trend - the middle line of the Envelopes has a distinct inclination; the lines below the channel's middle line are used for buy trades, the lines above the middle line and the middle line itse
    Mr Big
    Pavel Verveyko
    The indicator shows and highlights the chart candles, which are formed as a result of large players entering the market in large volumes. Such candles can also be formed after achieving a certainty on the market, when most of the participants hold positions in the same direction. The movement is likely to continue in that direction after such candles. The indicator highlights the significant candles from the existing ones on the chart; The indicator allows identifying the trends based on candles
    Splash
    Pavel Verveyko
    The indicator identifies the most suitable moment for entering the market in terms of market volatility, when the market has the strength to move (the signal is indicated by an arrow under the candle). For each of the signals, the presence of trends on the current and higher timeframes is determined, so that the signal is in the direction of the majority of positions opened on the market (denoted near the signal by abbreviations of timeframes with a trend present). The signal appears after the c
    The indicator displays the key support and resistance levels on the chart. The significance of these levels lies in that the price may reverse or strengthen the movement when passing such levels, since they are formed as a consequence of the natural reaction of market participants to the price movement, depending on which positions they occupied or did not have time to occupy. The psychology of the level occurrence: there always those who bought, sold, hesitated to enter or exited early. If the
    This indicator is a multitimeframe trading strategy. It has the levels for stop loss, take profit and entry point. The order level can also be set manually. The indicator uses the regularity of the market, which manifests itself on all instruments, and does not require adjustment of the parameters. The strategy uses a proprietary approach to determining: trend, volatility, hierarchy of timeframe significance, the size of the history period (the number of candles), which is important for making a
    Trend Sync
    Pavel Verveyko
    5 (1)
    The indicator shows the trend of 3 timeframes: higher timeframe; medium timeframe; smaller (current) timeframe, where the indicator is running. The indicator should be launched on a chart with a timeframe smaller than the higher and medium ones. The idea is to use the trend strength when opening positions. Combination of 3 timeframes (smaller, medium, higher) allows the trend to be followed at all levels of the instrument. The higher timeframes are used for calculations. Therefore, sudden change
    The indicator detects important peaks and troughs (extremes) on the chart. These points can be used to plot support/resistance levels and trend lines, as well as any other graphical analysis. These points can serve as reference points for setting trading orders. The indicator does not redraw . Settings: Size_History  - the size of the calculated history. Num_Candles_Right  - number of candles to the right of the peak or trough. Num_Candles_Left  - number of candles to the left of the peak or
    Running along Lines
    Pavel Verveyko
    3 (2)
    The indicator draws support and resistance lines on an important part of the chart for making decisions. After the trend line appears, you can trade for a breakout or rebound from it, as well as place orders near it. Outdated trend lines are deleted automatically. Thus, we always deal with the most up-to-date lines. The indicator is not redrawn . Settings: Size_History  - the size of the calculated history. Num_Candles_extremum  - the number of candles on each side of the extremum. Type_Arrow
    Key Volumes
    Pavel Verveyko
    1 (1)
    The indicator shows key volumes confirmed by the price movement. The indicator allows you to analyze volumes in the direction, frequency of occurrence, and their value. There are 2 modes of operation: taking into account the trend and not taking into account the trend (if the parameter Period_Trend = 0, then the trend is not taken into account; if the parameter Period_Trend is greater than zero, then the trend is taken into account in volumes). The indicator does not redraw . Settings History_S
    Catch Impulse
    Pavel Verveyko
    This trading system is based on market impulses of varying complexity.   To generate a signal, the indicator uses the moments when the direction of the pulse and the necessary section of the trend coincide. The indicator also takes into account the current market volatility. Stop_loss tags can be set with the parameter "0" or "1", then Stop_Loss will take into account market volatility.   Take_Profit tags can be set with the parameter "0", then Take_Profit will take into account market volatil
    Indexes
    Pavel Verveyko
    The stocks that make up the index are one of the drivers of the movement. Analyzing the financial performance of all elements of the index, we can assume further development of the situation. The program (script) displays corporate reports of shares that are part of the index selected in the settings.   "Indexes" cannot be tested in the tester (since there is no way to get information from the Internet). Information is downloaded from the site investing.com: Report Date Earnings per share (E
    Fibo World
    Pavel Verveyko
    The indicator builds a graphical analysis based on the Fibonacci theory. Fibo Fan is used for the analysis of the impulses and corrections of the movement. Reversal lines (2 lines at the base of the Fibonacci fan) are used to analyze the direction of movements. The indicator displays the of 4 the target line in each direction. The indicator takes into account market volatility. If the price is above the reversal lines, it makes sense to consider buying, if lower, then selling. You can open posi
    The indicator determines the state of the market: trend or flat. The state of the market is determined by taking into account volatility. The flat (trading corridor)is displayed in yellow. The green color shows the upward trend. The red color shows the downward trend. The height of the label corresponds to the volatility in the market. The indicator does not redraw . Settings History_Size   - the amount of history for calculation. Period_Candles  - the number of candles to calculate the indicat
    The indicator plots flexible support and resistance levels (dots). A special phase of movement is used for construction. Levels are formed dynamically, that is, each new candle can continue the level or complete it. The level can provide resistance or support to the price even where it is no longer there. Also, support and resistance levels can change roles. The importance of levels is affected by: the amount of time the level is formed and the number of touches. The significance of these lev
    The indicator is a trading system for short-term trading. Scalper Assistant helps to determine the direction of the transaction, and also shows the entry and exit points. The indicator draws two lines (possible points for opening positions). At the moment of the breakdown of the upper line up (and when all trading conditions are met), an up arrow appears (a buy signal), as well as 2 goals. At the moment of the breakdown of the lower line down (and when all trading conditions are met), a down ar
    Gold n XAU
    Pavel Verveyko
    The trading system is designed to work with gold on time periods: 30M, 1H. The indicator allows you to adjust to the market situation. Parameters for 1H :   PERIOD=9F ,   FILTER=300 .   Parameters for  30M :   PERIOD=22B ,   FILTER=450 .   A small adjustment to a specific broker is allowed .   If you change the amount of history displayed, you may also need to adjust the parameters. The indicator is not redrawn.     "Gold n XAU" uses different rules for entering a trade and different rules fo
    The indicator builds "psychological levels": levels of round numbers and intermediate levels of round numbers. Round numbers play an important role in forming support and resistance levels. There is a pattern in which the decline or growth of the price can stop at round numbers. The level whose price ends at 0 is the level of a round number of the first order. Intermediate level, this is the level between two round levels, for example, between 10 and 20 this is level 15. In the " Num_Zeros "
    Ichimoku Map
    Pavel Verveyko
    Ichimoku Map (instant look at the markets) - built on the basis of the legendary Ichimoku Kinko Hyo indicator. The task of the Ichimoku Map is to provide information about the market strength on the selected time periods and instruments, from the point of view of the Ichimoku indicator. The indicator displays 7 degrees of buy signal strength and 7 degrees of sell signal strength. The stronger the trend, the brighter the signal rectangle in the table. The table can be dragged with the mouse. The
    The indicator displays a stock chart of a non-standard type, in which the price and time have the same value. The usual chart of Japanese candlesticks does not take into account all the information that the time analysis can give. Renko charts do not use all the information that price can give in relation to time. The "Chart Price and Time" indicator takes into account price and time equally and shows the predominance of price or time. Taking into account price and time equally gives an idea
    The indicator tracks sharp volatility (moments when the market has shown increased activity and movement may occur), on the selected instruments and time periods. The information is displayed as colored rectangles. Thus, it is possible to assess at a glance which tool should be given priority attention. The indicator will be useful for scalpers when they need a quick reaction or for traders working with a large number of instruments. The indicator does not redraw. The indicator displays 8 degree
    Alert Creator
    Pavel Verveyko
    The Alert Creator indicator is designed to create alerts for selected conditions. You can select one or several indicators for the notification. If several conditions are selected, the alert is triggered when all the selected conditions are met. The signals can be configured separately for buying and separately for selling. Example, a buy alert: the closing price is above the moving average, the RSI is below 20. (In this example, 2 indicators are used to generate an alert: MA and RSI) At the
    Trend Arithmetic
    Pavel Verveyko
    The indicator determines the strength of the trend and its possible reversal points, based on the author's arithmetic approach . Each new peak or trough is a trend development. Such peaks and troughs are numbered so that the strength of the trend development can be seen. Attempts to change the trend are also numbered. This gives an understanding of a possible change in the direction of the trend. Indicator signals are generated when trying to change the trend . In the settings, it is possible
    Level Predictor
    Pavel Verveyko
    该指标绘制可能成为未来显着支撑位和阻力位的潜在水平。 该线越长,在该水平击穿后价格反转或价格变动增加的可能性就越高。 随着电平形成概率的降低,线的长度减小。 该指标不需要调整。 在设置中,您可以更改指示器的设计。 " Line_Length "按钮放置在图表上以调整线的长度(为了便于感知指标)。 所选的" Line_Length "设置将为每个时间段和仪器保存。 " Line_Length "按钮可以用鼠标拖动。 当悬停在按钮的左边缘时,它会用选定的颜色突出显示,按下时,数字会减少,指示线会缩短。 当您将鼠标悬停在按钮的右边缘时,它会以选定的颜色突出显示,按下时,数字会增加,指示线会延长。 _________________
    Jumping along Levels is dedicated to the most important aspect of trading: support and resistance levels. This indicator is built using a unique technology based on proprietary development and testing algorithms. The indicator has a built-in intelligent market situation assessment system. It can automatically adjust to varying market volatility. Jumping along Levels simultaneously displays levels from different time periods on the current chart. It has a graphical table for working with comple
    筛选:
    krisnara123
    2210
    krisnara123 2020.12.11 14:22 
     

    用户没有留下任何评级信息

    回复评论