Signal Auditor MT5
- Utilities
- Version: 2.2

Signal Auditor MT5 — checks whether an indicator's signals actually work and whether it changes them after the fact
Signal Auditor MT5 is a free utility for MetaTrader 5 that checks the signals of another indicator. It answers two questions worth asking before you buy an indicator or trade with it.
The first question: do the signals work, that is, does price move in the arrow's direction more often than after an entry at random? If it does not, the indicator has no advantage: entering on its arrows is the same as entering at random moments.
The second question: does the indicator repaint? Repainting means that the indicator removes, moves or adds arrows on bars that have already closed. On history such arrows look very accurate, but in live trading they were not there at those places.
The auditor works on a chart with your indicators and in the Strategy Tester with demo versions of Market indicators, so you can check an indicator before you buy it. No programming or setup is needed: the auditor finds the signals by itself and shows the result in a panel on the chart.
WHO IT IS FOR
- Indicator buyers: check a demo version before buying.
- Traders: find out whether a familiar indicator gives an advantage on your symbol and timeframe, and compare several indicators or settings under the same conditions.
- Developers: check your own indicator before publishing it: whether its signals have an advantage and whether it repaints.
FEATURES
- Finds the signals by itself: arrows in the indicator's buffers; arrows drawn as objects on the chart, including Wingdings symbols, text arrows and BUY and SELL labels; trend changes when there are no arrows: two lines on opposite sides of price, a line or candles that change colour, separate candles for up and down moves.
- Compares the signals with random candles and shows whether they have an advantage that luck cannot explain.
- Trades the signals with three targets and shows the win rate, profit factor and average result after spread.
- Watches for repainting on the chart and in the tester.
- Checks demo versions of Market indicators in the Strategy Tester.
- Marks every counted signal with a gold dot on the chart, so you can see whether the auditor has read the indicator correctly.
- Saves the summary and a table of all signals with their outcomes to a file.
- Works on any symbol and timeframe, with indicators in the main window and in a subwindow.
HOW THE CHECK WORKS
For each signal the auditor looks at where price went first: 1 ATR in the signal's direction or the same distance against it. ATR(14) is the average bar range over the last 14 bars, so the check suits any symbol and timeframe equally well. The auditor waits up to 50 bars for the answer. Then it measures the same thing from three random earlier candles from the same stretch of history, in the same direction. The comparison with random candles matters because in a rising market almost any buy looks good, and in a falling market almost any sell does. The difference between the signals and the random candles shows what the indicator itself adds.
The luck margin is the difference that plain luck can produce with this number of signals (at 95% probability). If the signals' advantage is larger than the margin, the verdict is beyond luck; if it is smaller, the verdict is within luck. A verdict is given once at least 100 signals have an outcome.
The second check trades the signals: entry at the next bar's open, a stop 1 ATR away, a target 1, 2 or 3 times the stop distance (1R, 2R and 3R, where R is the stop size), and a time exit after 50 bars. If the stop and the target are both reached within one bar, the stop is counted. Each bar's spread is taken from history; commission is not included. Next to it is the result of the same trades from random candles.
Repainting is checked like this: the auditor remembers each bar's signal at the moment the bar closes and compares it on the following bars. A signal that vanished, changed direction or appeared on an already closed bar counts as repainting. Signals that appeared on the open bar and were gone by its close are counted separately: they do not spoil the history, but in live trading you could enter on such a signal.
Arrows on consecutive bars count as one signal, and the dot is placed on the first of them. When the signals come from trend changes, the signal is the first bar of the new direction.
HOW TO CHECK AN INDICATOR ON A CHART
1. Open a chart of the symbol and timeframe you need and attach the indicator you want to check, with your settings.
2. Attach Signal Auditor MT5 to the same chart. If there is only one indicator on the chart, leave Indicator to audit empty. If there are several, enter part of the name of the one you need, for example test_indicator.
3. Within a few seconds the panel shows the check on history, up to the last 20,000 closed bars. Compare the gold dots with the indicator's arrows: each dot is a counted signal.
4. Keep the chart open: the repaint watch starts when the auditor starts and runs for as long as it works. The more bars close, the more reliable the conclusion: on M1 the first results appear within a few minutes, on H1 within a few hours.
5. The history check is updated on every new bar. The table of signals with their outcomes is saved to the MQL5\Files\SignalAuditor folder of the terminal's data folder (File menu, Open Data Folder).
The panel can be dragged by its title bar, made more transparent, collapsed and closed with the buttons in its title bar. Its position on the chart is remembered.
HOW TO CHECK A MARKET DEMO IN THE TESTER
A demo version of a Market indicator runs only in the Strategy Tester, so the auditor checks it there and loads it by itself.
1. Download the demo version of the indicator from its product page in the Market. It appears in the Navigator in the Indicators folder, in the Market subfolder.
2. Open the Strategy Tester (Ctrl+R), choose the Indicator program type and select Signal Auditor MT5 in the list. Visual mode is turned on automatically when an indicator is tested.
3. Set the symbol, timeframe and test period, for example the last 3–6 months. Tick generation: 1 Minute OHLC. That is enough; real ticks take a long time to download and put a heavy load on the terminal.
4. On the Inputs tab, enter the path to the indicator in Indicator to audit as the Navigator shows it inside the Indicators folder, for example Market\Test Indicator. Your own indicator from the MyIndicators folder is entered like this: MyIndicators\test_indicator.
5. Start the test. Right after the start the panel shows the check on the year of history that the tester loads before the start date (the Before test row). During the run the auditor records the signals as they were at the close of each bar and switches the table to them (the Test row).
6. Every 50 bars the summary and the table of signals are saved to the MQL5\Files\SignalAuditor folder of the tester agent, so the result is kept even if you close the visualization window early.
The tester runs the demo with its default settings. In the tester the panel has no buttons, but it can be dragged by its title bar.
HOW TO READ THE PANEL
From top to bottom:
- Title bar: the overall result, one of signals beat random candles, no edge beyond luck, signals worse than random or too few signals to judge. A red REPAINTS label means repainting has been found.
- Indicator and Signals from: which indicator is checked and where the signals come from: arrow buffers, objects on the chart or trend changes.
- History (Before test and Test in the tester): which stretch of history was checked.
- Signals: how many buy and sell signals were found and how often they appear.
- The Does price go the signal's way first? table is the first check. The Signals and Random candles columns show how often price first moved 1 ATR in the signal's direction after the signals and after random candles, Difference shows the gap in percentage points, Luck the luck margin, and Verdict the conclusion. Rows: all signals (All), buys (Buy), sells (Sell), and the older and recent halves of history (Older half, Recent half). A stable advantage shows up in both halves.
- The Trading the signals table is the second check. For the 1R, 2R and 3R targets: the number of trades (Trades), the share of winning trades (Win), the profit factor (PF; above 1 means the trades are in profit), the average result per trade in R (Avg per trade) and the profit factor of the same trades from random candles (Random PF). The line below shows the spread that was included.
- Repaint watch: since when the watch has been running, how many bars have been checked, how many signals on closed bars vanished, changed direction or appeared later, and how many signals flickered on the open bar.
Example. Signals 56.0%, Random candles 50.0%, Difference +6.0 pts, Luck 4.2: the difference is larger than the margin, so the verdict is beyond luck, and after the signals price moves their way more often than after random candles. With Difference +2.0 pts and the same margin the verdict is within luck: chance alone produces such a difference.
INPUT PARAMETERS
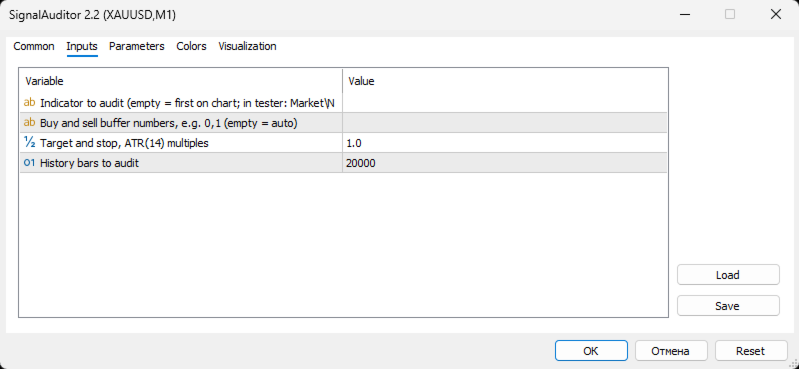
- Indicator to audit (empty = first on chart; in tester: Market\Name): which indicator to check. On a chart, leave it empty (the first indicator on the chart) or enter part of its name. In the tester, enter the path inside the Indicators folder, for example Market\Test Indicator.
- Buy and sell buffer numbers, e.g. 0,1 (empty = auto): the numbers of the buffers with signals. Usually the field stays empty; fill it in if the auditor did not find the signals by itself or read them incorrectly. Formats:
0,1 — buy arrows in buffer 0, sell arrows in buffer 1;
2 — one buffer for both directions: the direction is taken from the arrow's position relative to price or from the sign of the value;
0,4 — if the buffers are filled on more than 30% of bars, they are read as buy and sell states, and a change of state is the signal;
8:2,8:1 — colour numbers in a colour buffer: colour 2 in buffer 8 means buy, colour 1 means sell.
- Target and stop, ATR(14) multiples: the target and stop size in both checks, in ATR(14) units, 1.0 by default. A larger value checks longer moves.
- History bars to audit: how many of the last closed bars of history to check, 20,000 by default.
All the indicator's buffers and how the auditor has read them are listed in the journal: the Experts tab on a chart, the Journal tab in the tester.
RECOMMENDATIONS
- Check the indicator with the settings you are going to trade with: on a chart the auditor works with the settings of the indicator on that chart.
- A reliable conclusion needs at least 100 signals. If there are fewer, increase History bars to audit, choose a lower timeframe or take a longer test period.
- Check the indicator on two or three symbols and timeframes: an advantage on just one of them may be chance.
- Compare the gold dots with the indicator's arrows. If they do not match, enter the buffers manually.
- In the tester, use 1 Minute OHLC. With Open Prices Only, signals flickering on the open bar are not checked, and indicators that use data from lower timeframes may not work.
FAQ
Why compare the signals with random candles?
In a rising market almost any buy wins, and in a falling market almost any sell does. Random candles from the same stretch of history and in the same direction go through the same check, so the difference shows what the indicator adds rather than what the market gave.
What does within luck mean?
The difference between the signals and the random candles is smaller than plain luck can produce with this number of signals. It does not prove that the indicator is bad, but the check sees no advantage in its entries.
Does the auditor take into account the exits, filters and rules of the indicator's author?
No. All signals are checked as entries under the same conditions. This makes a fair comparison between different indicators possible, but it is not a test of the author's complete trading system.
Why do the Before test and Test rows differ in the tester?
Before test shows the signals on history as the indicator displays them now. Test shows the signals as they were at the close of each bar, which is what a trader would have seen in live trading. If the history looks noticeably better, the indicator most likely repaints.
The auditor found no signals or the wrong ones. What should I do?
Open the journal: it lists all the indicator's buffers and how the auditor has read them. Enter the right numbers in Buy and sell buffer numbers.
Does the auditor work with oscillators?
Only if the oscillator has arrows or colour states. Level crossings, exits from a zone and divergences are different strategies, and the auditor does not check them.
Does the free version have any limitations?
No, this is the full version without limitations.
LIMITATIONS
The result applies to the symbol, timeframe and period that were checked. The spread is taken from history; commission is not included. Past results do not guarantee future results.
SUPPORT
Send questions and suggestions via private messages or in the product comments on MQL5.com.