PullbackScanner MT5
- Indicators
- Version: 1.4
- Activations: 10

PullbackScanner MT5 — a rollback scanner in the US market
PullbackScanner MT5 is an indicator scanner for MetaTrader 5. He follows the four major U.S. indexes and the largest U.S. stocks and finds short pullbacks within steady growth. One chart shows where the entrance is today, where the exit is, which deals are open and at what price today's closing will give a new signal. For each symbol, the indicator shows how such signals have worked in the history of your broker, taking into account its spreads and swaps.
THE PRINCIPLE OF OPERATION
- The indicator works on daily bars: the signal appears at the close of the day, the entrance — at the opening of the next. The timeframe of the chart does not matter.
- Only purchases and only in an uptrend. When the market is falling, there are no signals.
- Each trade has a clear exit: the panel shows the level above which today's closing completes the transaction, as well as the deadline for holding.
- The signals generated at the close of the day are not redrawn.
- The IN ZONE NOW status warns in advance: if the day closes in the price range shown, there will be entry tomorrow. This is a preliminary status, and it may disappear before the day closes.
- The indicator does not trade itself, does not load other indicators and does not draw anything on the chart except for its panel.
THE RESULTS OF THE HISTORY CHECK
The MetaQuotes-Demo server, daytime bars. The costs are laid down with a margin: double the typical spread, 6% per annum for the transfer of a position, for shares — another commission of 0.02% per side.
US indices (S&P 500, Dow 30, Nasdaq 100, Russell 2000), 2013-2026:
391 signals, profitable 74%;
- average transaction result +0.35% after expenses, since mid-2019 +0.41%;
- 10 out of 14 years have been profitable.
Stocks — 54 largest S&P 500 companies at the end of 2012 (the list was taken at the beginning of the audit, not according to today's leaders), 2010-2026:
- 5,978 signals, 64 profitable%;
- average result +0.17% after expenses, since mid-2019 +0.12%;
- the result varies greatly from stock to stock: 37 out of 54 are positive.
According to the indices, signals are rare — about 28 per year for all four. On average, about 7 signals per week come with stocks.
INPUT PARAMETERS
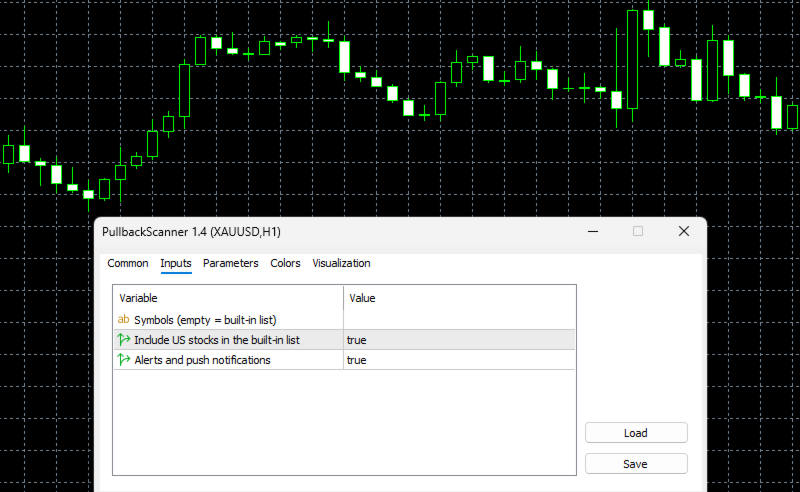
- Symbols, comma-separated (empty = built-in) — its own comma-separated list of symbols, for example: US500, AAPL, MSFT. The indicator also understands the semicolon. If the field is empty, the built-in list is used.: four U.S. indexes and 56 major stocks. The indicator finds the names of the symbols at the broker itself (US500, SPX500, US500.cash, #AAPL, AAPL.NAS and the like).
- Include US stocks in the built-in list — whether to add stocks to the built-in list. The parameter has no effect on its own character list.
- Alerts and push notifications — notifications in the terminal and on the phone about entrances and exits. Each notification comes once, at the beginning of a new day.
THE PANEL
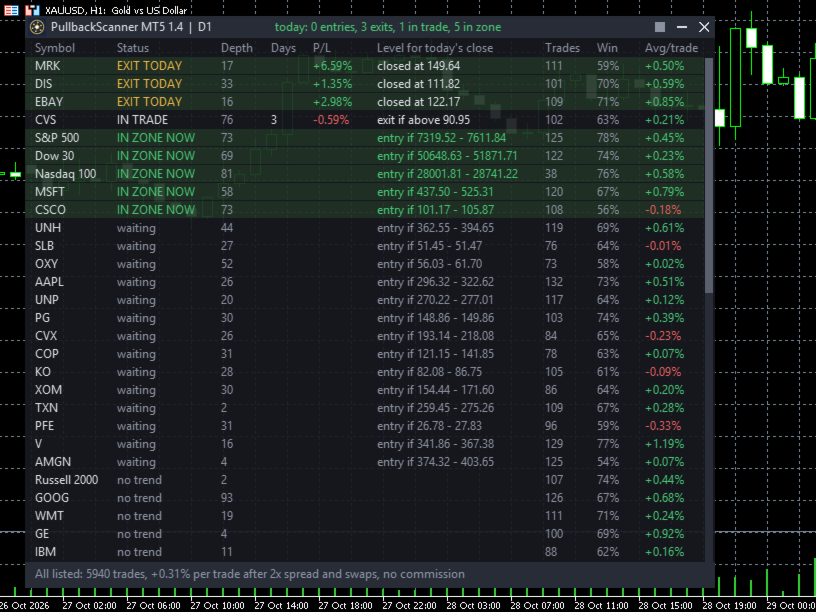
The lines are ordered by importance: today's entries and exits, open trades, then the symbols that are closest to the signal. There is a summary of the day in the title, and it remains visible in the minimized window.
Statuses:
- ENTRY TODAY is a signal for closing the previous day, entry today is for opening.
- EXIT TODAY — the deal is closed today at the opening, the exit price and the result are shown.
- IN TRADE — an open transaction. The panel shows the level: if the day closes above it, the exit is tomorrow at the opening. The time exit at next open sign means that the deal has reached the deadline and will close at the next open.
- IN ZONE NOW — the price is now in the range of the signal: if the day closes in it, entry is tomorrow.
- waiting — the price range is shown, the closing of which will give a signal; now the price is outside it.
- no trend — there can be no signal today.
- loading... — the symbol's history is still loading.
Columns:
- Depth — the depth of the current rollback on a scale from 0 to 100: the higher the number, the deeper the rollback.
- Days — how many days the transaction lasts.
- P/L — the current result of an open transaction or the result of a closed one.
- Level for today's close — exit level for an open trade, entry range for pending symbols, exit price for a deal closed today.
- Trades, Win, Avg/trade — the number of trades in the history, the share of profitable trades and the average result after double spreads and broker swaps, without commission.
- The bottom line is the total for all characters in the list.
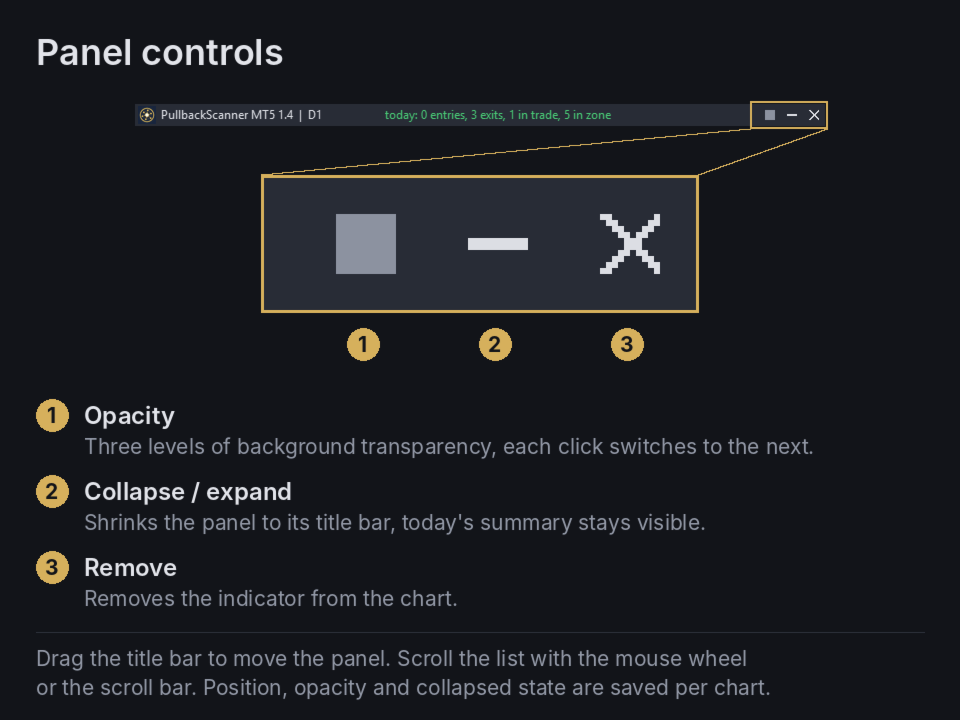
Buttons in the window header, from left to right:
- Square — background transparency: three degrees, each tap turns on the next one. The text remains clear.
- Dash — minimize the window to the title. With the minimized window in its place, plus, it expands the window back.
- Cross — remove the indicator from the chart.
The window is dragged behind the header. The list is scrolled with the mouse wheel (while the cursor is above the window, the graph does not scroll) and the scroll bar: the slider can be dragged. The position, transparency, and minimization of the window are remembered for each chart. The colors adjust to the light and dark background of the graph.
recommendations
- Instruments: US indices and stocks (CFDs or exchange-traded). The indicator skips the symbols that the broker does not have and reports this at the bottom of the panel.
- Timeframe of the chart: any.
- Costs: The panel's statistics take into account the broker's spread and swaps, but not the commission. If the broker charges a commission, subtract it from the average result. In stocks, the advantage is small, and high costs can completely eat it up.
- Before trading, look at the statistics of your symbols on the panel: it is calculated according to the history and conditions of your broker.
FREQUENTLY ASKED QUESTIONS
Does the indicator redraw the signals?
No. Entry and exit are determined at the close of the day and do not change after that. Only the preliminary IN ZONE NOW status can change before the day closes.
Why are there few signals on the indexes?
The indicator is only looking for pullbacks within growth, and on indexes such situations occur on average once every few weeks. Stocks add signals, but their advantage is more modest.
Why are there no signals at all in some periods?
In a falling market, the indicator does not give buy signals. During such periods, the symbols indicate the no trend status.
Is it possible to use other symbols?
Yes, add them to Symbols. The indicator has been developed and tested for the US market. The European and Asian indexes did not show a stable advantage, so they are not included in the built-in list.
Is this a trading advisor?
No, it's an indicator: it shows signals and statistics, and you make decisions about trades.
support
Write your questions and suggestions in private messages or in the product comments on MQL5.com .
RISK WARNING
Trading in financial markets involves the risk of capital loss. The results of a history check are not a guarantee of future profitability. Use only those funds that you can afford to lose, and choose the risk wisely.