Expert Advisor Live Audit
- Utilities
-
Mikoto Hamazono
 AI Trader Kyo | MQL Developer & Forex Innovator
As an MQL developer and a passionate innovator in FX, I build cutting-edge trading solutions that make full use of artificial intelligence. - Version: 1.0
- Activations: 10
Expert Advisor Live Audit answers the question every EA user asks sooner or later: is my Expert Advisor broken, just unlucky, or eaten by costs? It reads the trade history of this account, groups it by magic number and shows, for each EA, its real edge, how it compares with its backtest, and what execution really cost.
It is an indicator: it never opens, modifies or closes a trade. No DLL, no web requests, no external services.
What you see
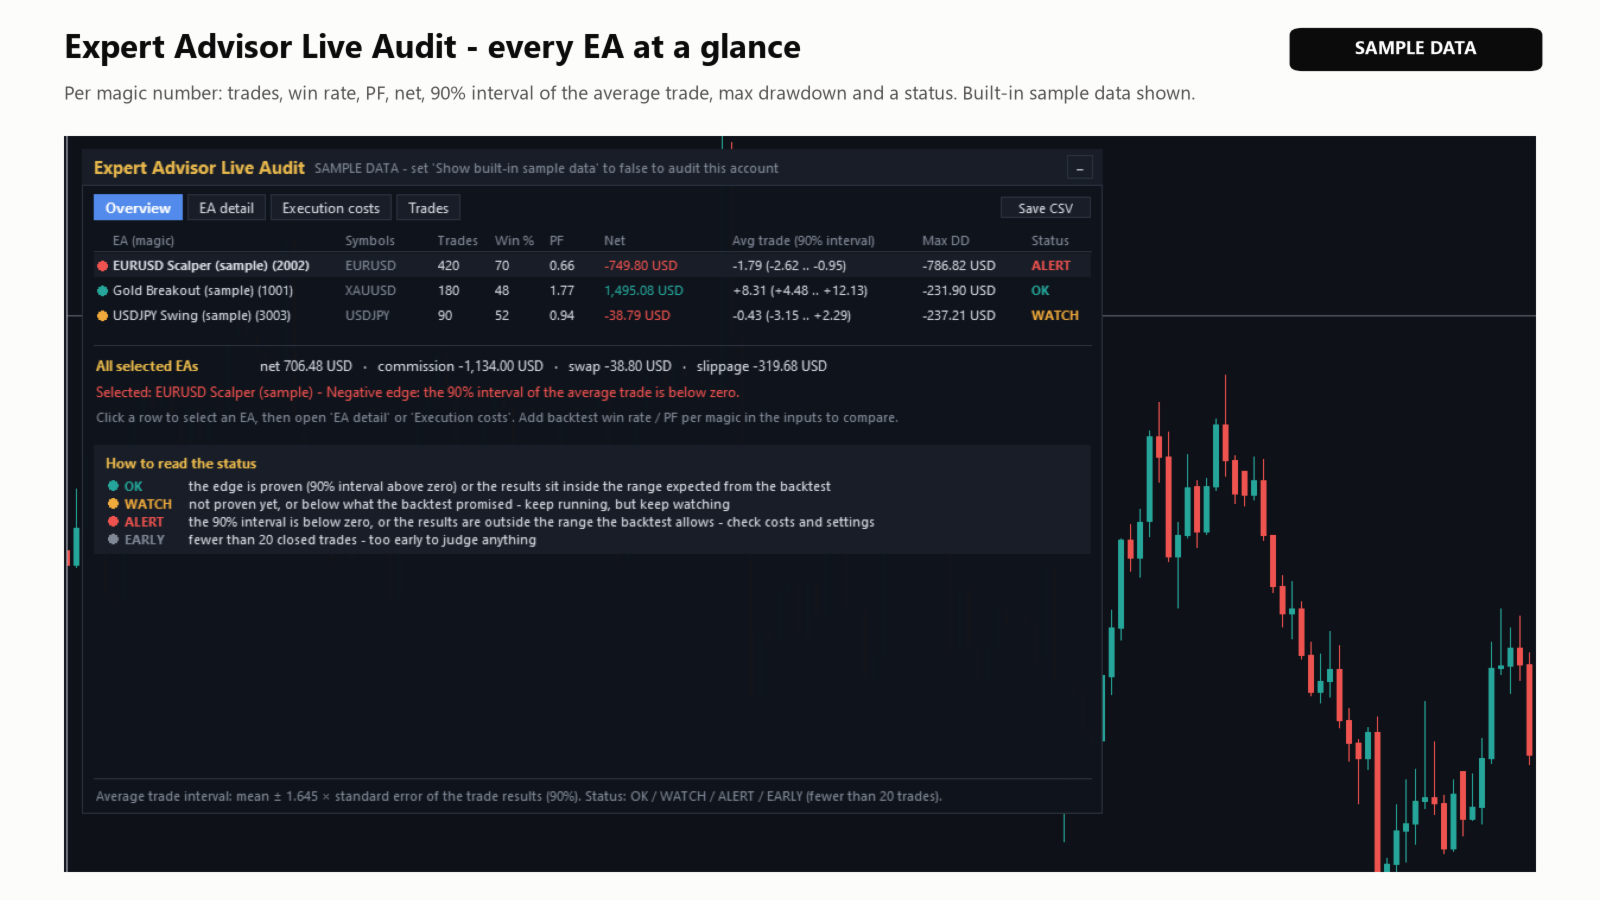
- Overview: every EA on the account with trades, win rate, profit factor, net result, maximum drawdown, the 90% interval of the average trade and a status: OK, WATCH, ALERT or EARLY (fewer than 20 trades).
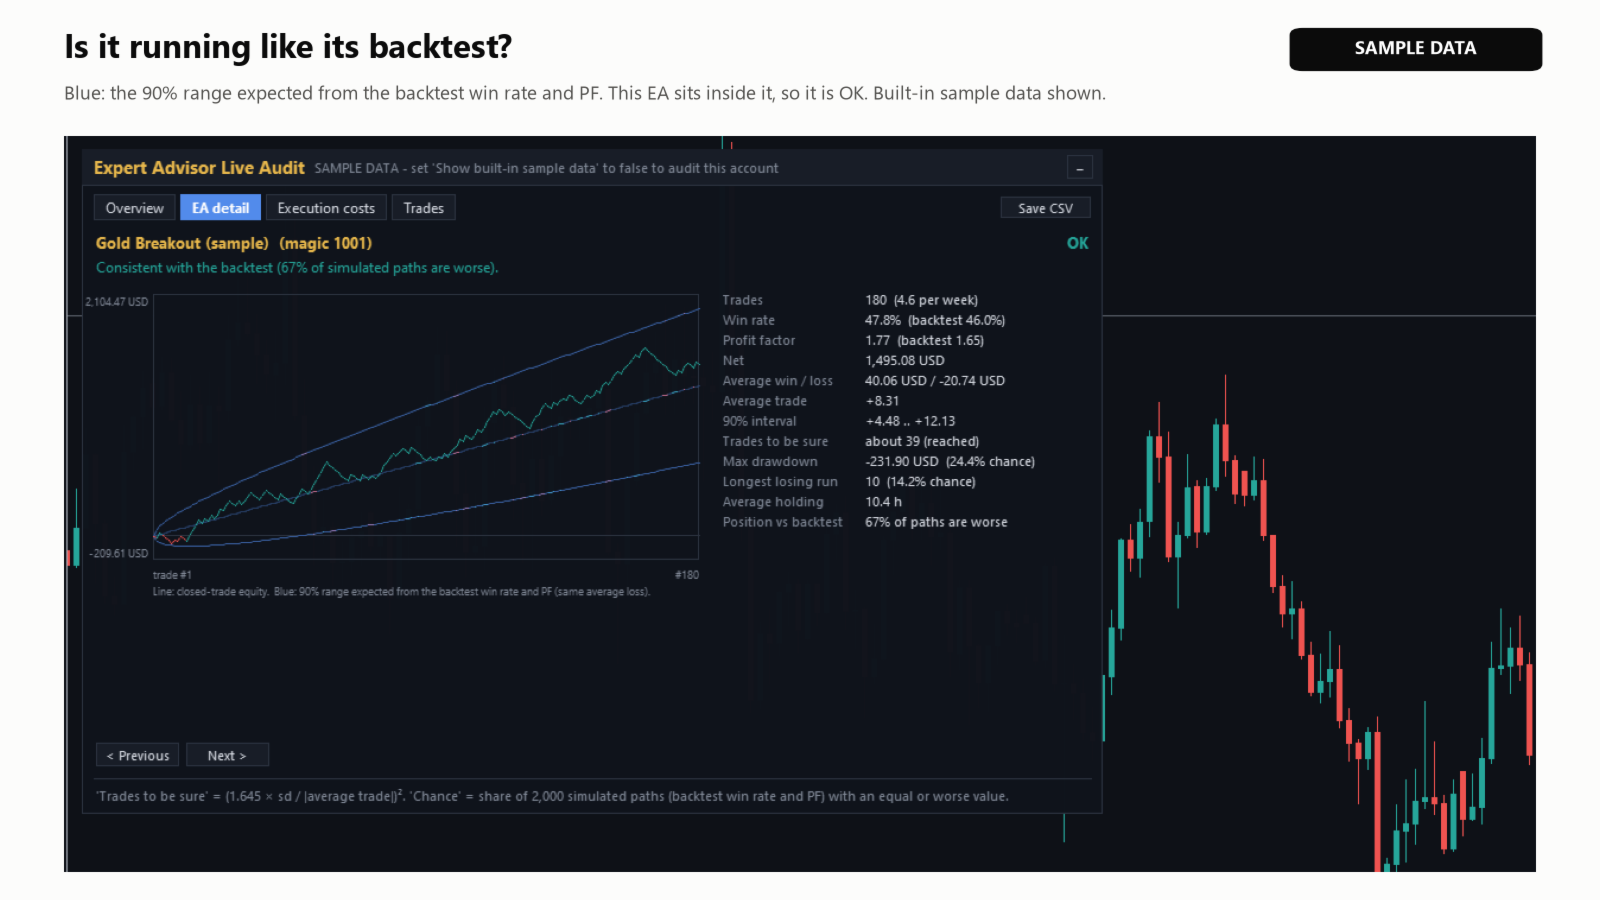
- EA detail: the closed-trade equity line. Enter the backtest win rate and profit factor, and a blue band shows the range expected from the backtest (90%). You also see how many simulated paths are worse than your live result, and how unusual your drawdown and your longest losing run are.
- Trades to be sure: how many trades are needed before the average trade is statistically different from zero at the EA's current volatility. EAs are often judged after 20 or 30 trades; this number shows when a judgement starts to make sense.
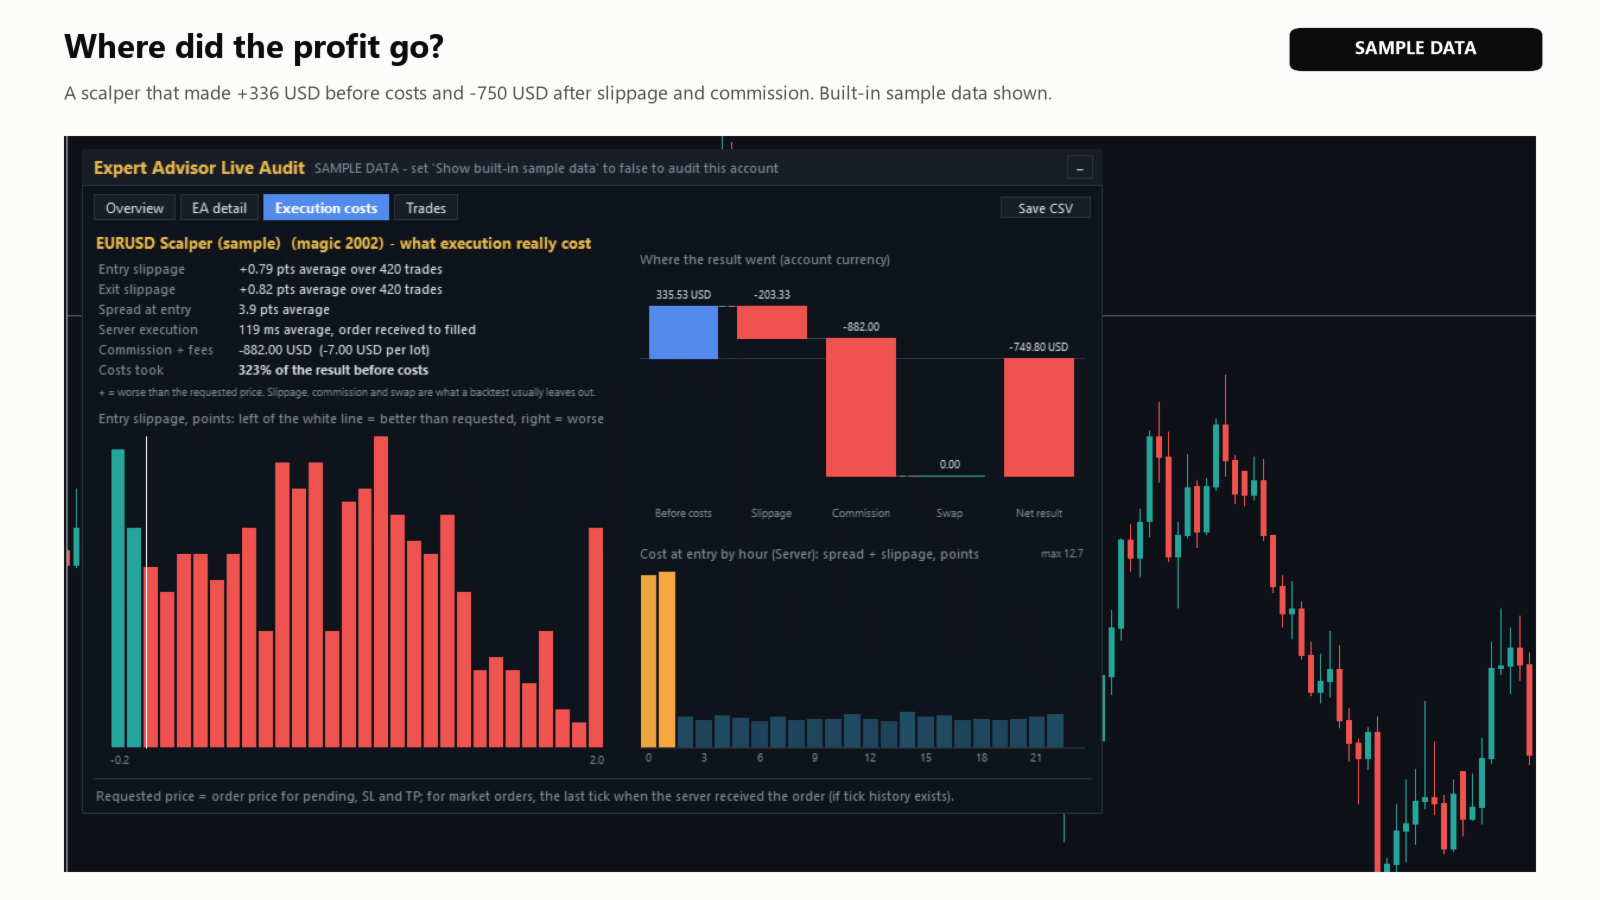
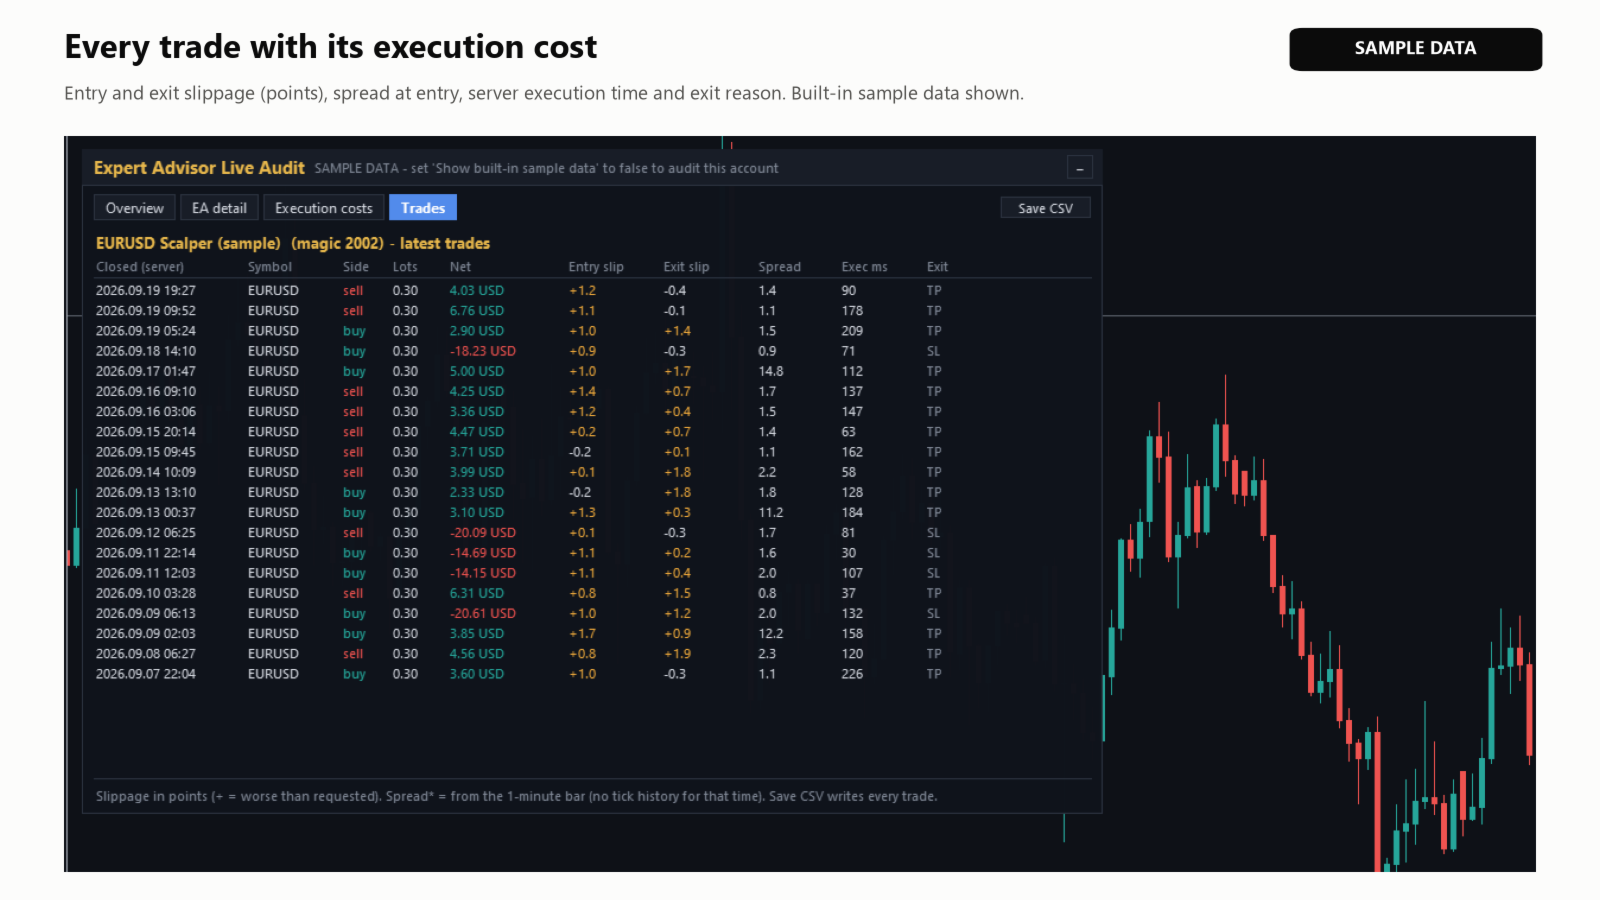
- Execution costs: entry and exit slippage against the requested price, spread at entry, server execution time, commission and swap, the cost by hour of entry, and a waterfall from "before costs" to "net result".
- Trades: the latest trades with their own costs. "Save CSV" writes every trade and the summary for Excel, Python or an AI assistant.
How the costs are measured
- Pending orders, stop-loss and take-profit: the order price is compared with the fill price.
- Market orders: MetaTrader does not store the requested price, so the fill is compared with the last tick at the moment the server received the order (when the terminal has tick history for that time).
- Spread at entry: from tick data, otherwise from the 1-minute bar (marked with *).
- Server execution time: from "order received" to "filled" in the order history.
Comparing with the backtest
Write one entry per EA in the input "Backtest expectations": magic=winrate/PF, for example 1001=62/1.45; 2002=48/1.8. You can read the win rate and the profit factor in any Strategy Tester report. The comparison uses your live average loss as the scale, so it works with any lot size.
Things to know
- Only positions closed inside the look-back period are analysed. Open positions are not included.
- The Strategy Tester has no account history, so the free demo shows built-in sample data (marked SAMPLE DATA). You can preview the same sample on a live chart with the input "Show built-in sample data".
- All numbers describe the past. A status of OK does not mean that an EA will stay profitable.
Inputs
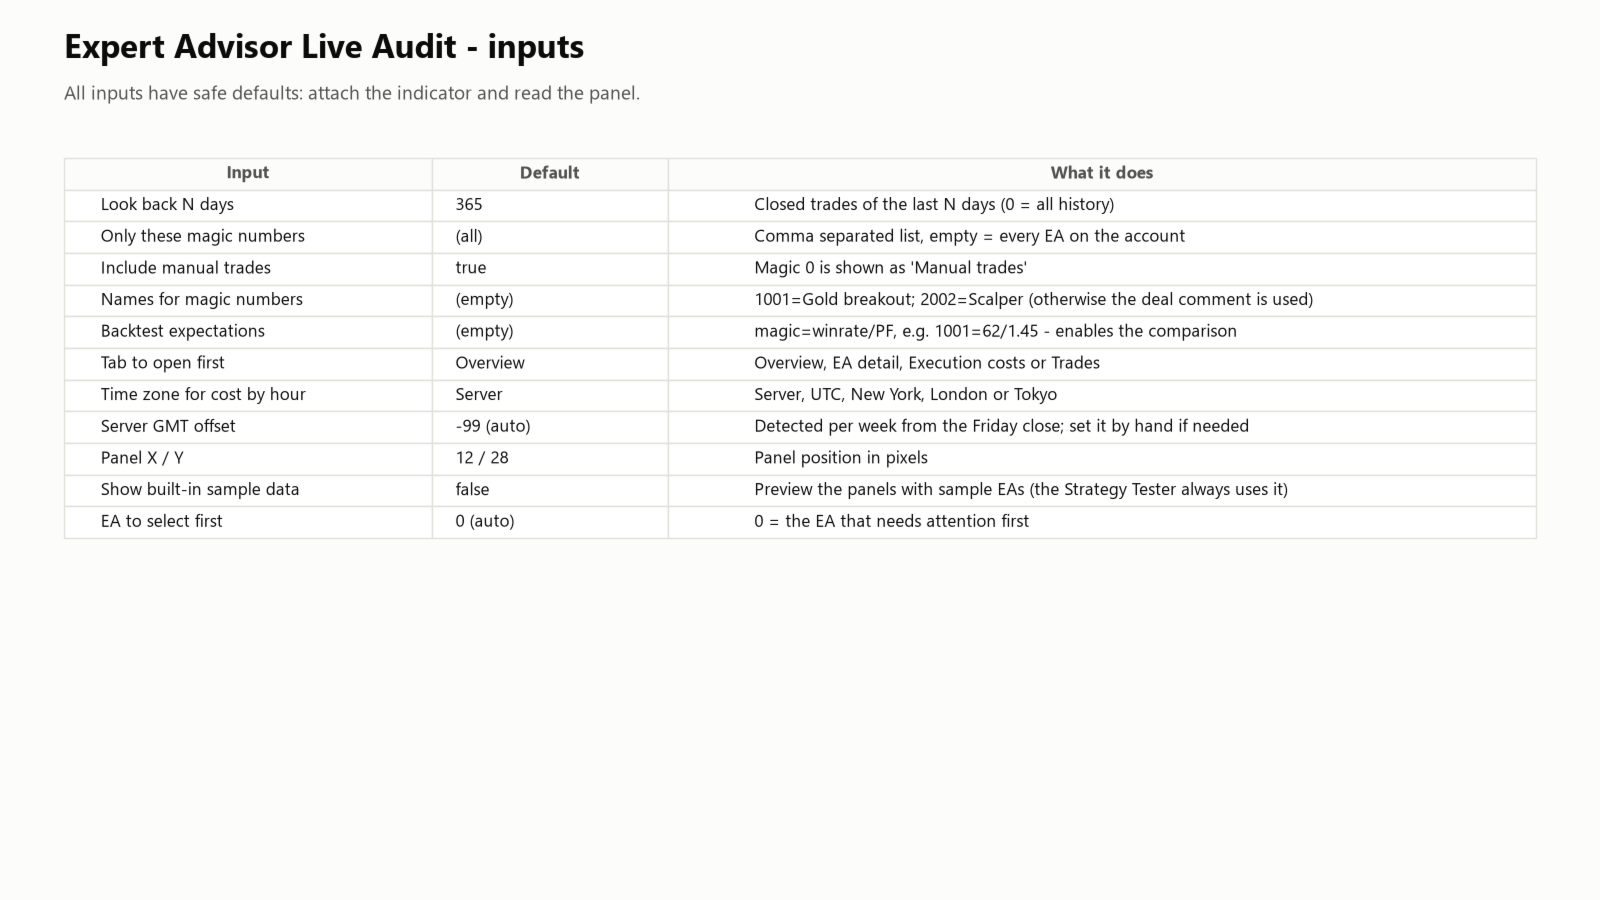
- Look back N days (365): closed trades of the last N days. 0 = all history.
- Only these magic numbers (empty): comma separated list. Empty = every EA.
- Include manual trades (true): magic 0 is shown as "Manual trades".
- Names for magic numbers (empty): for example 1001=Gold breakout; 2002=Scalper. Without it, the deal comment is used.
- Backtest expectations (empty): magic=winrate/PF per EA, separated by ";".
- Tab to open first, time zone for "cost by hour", server GMT offset (-99 = automatic), panel position.
- Show built-in sample data (false), EA to select first (0 = the one that needs attention).
Support
If anything is unclear, please send me a private message on MQL5.
Trading leveraged products carries a high risk of loss.