Seasonality and Session Lab
- Utilities
-
Mikoto Hamazono
 AI Trader Kyo | MQL Developer & Forex Innovator
As an MQL developer and a passionate innovator in FX, I build cutting-edge trading solutions that make full use of artificial intelligence. - Version: 1.0
- Activations: 10
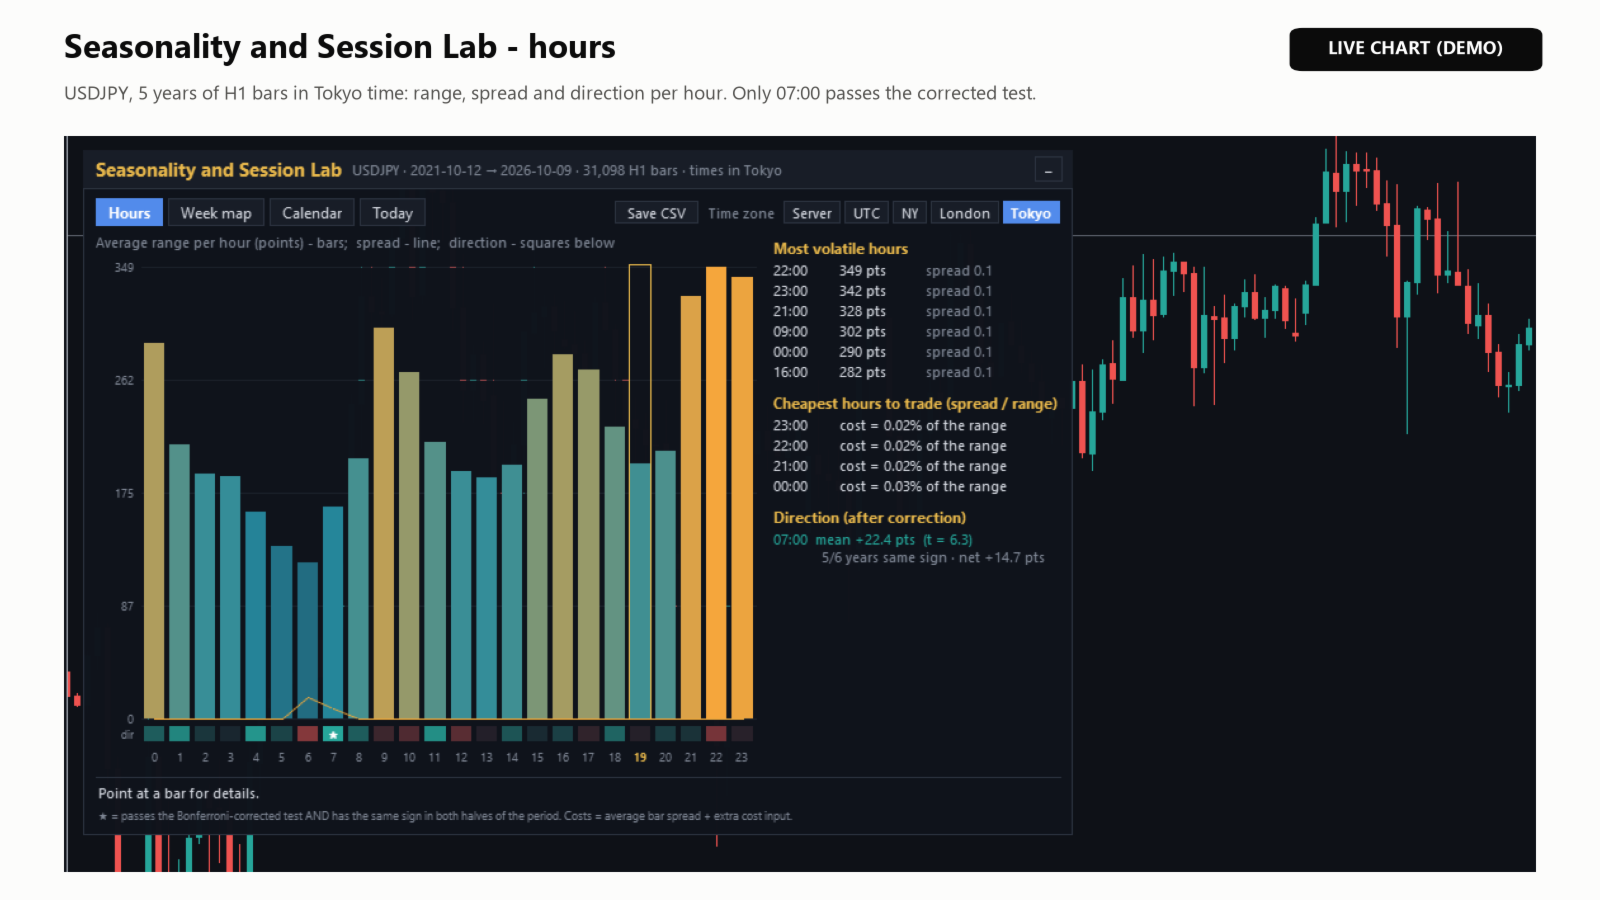
Seasonality and Session Lab shows how this symbol behaves by hour, weekday, day of month, month and special days (gotobi, month end, first Friday) - and which of those patterns survive an honest statistical test.
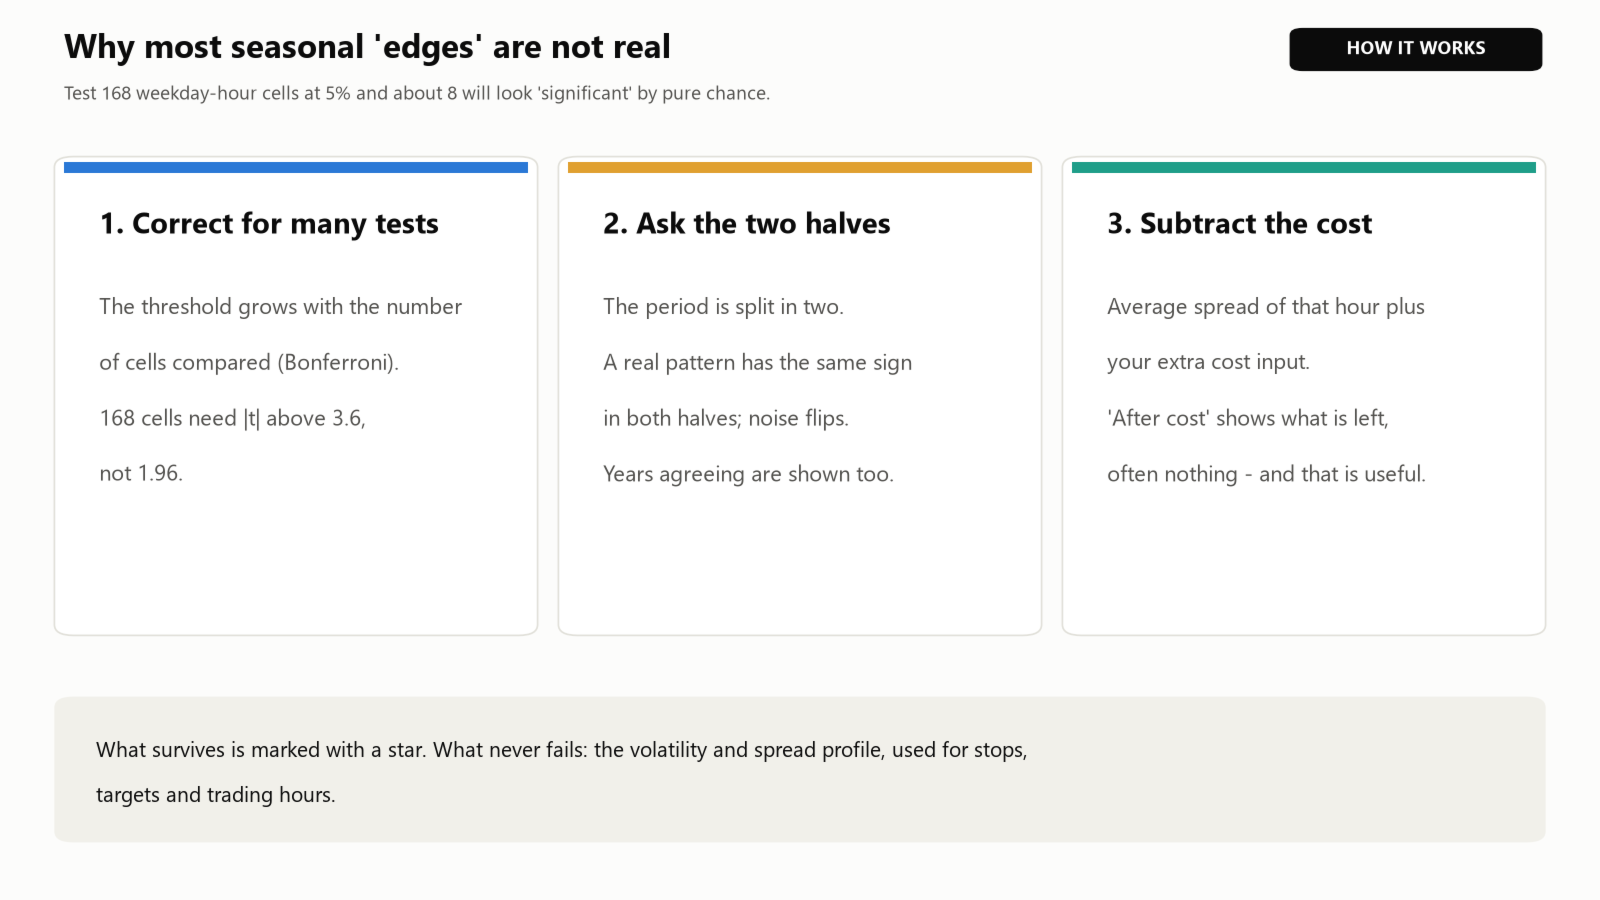
Most seasonal "edges" are noise: compare 168 weekday-hour cells and about eight of them will look significant by pure chance. This indicator corrects for that, checks both halves of the period and subtracts the cost. What it shows with confidence is the volatility and spread profile of every hour, which you can use for stops, targets and trading hours.
Indicator only: no trades, no DLL, no web requests. It works on any symbol and timeframe.
Tabs
- Hours: average range per hour (bars), spread (line) and direction (squares), with lists of the most volatile hours, the cheapest hours to trade (spread as a share of the range) and the hours whose direction passes the test.
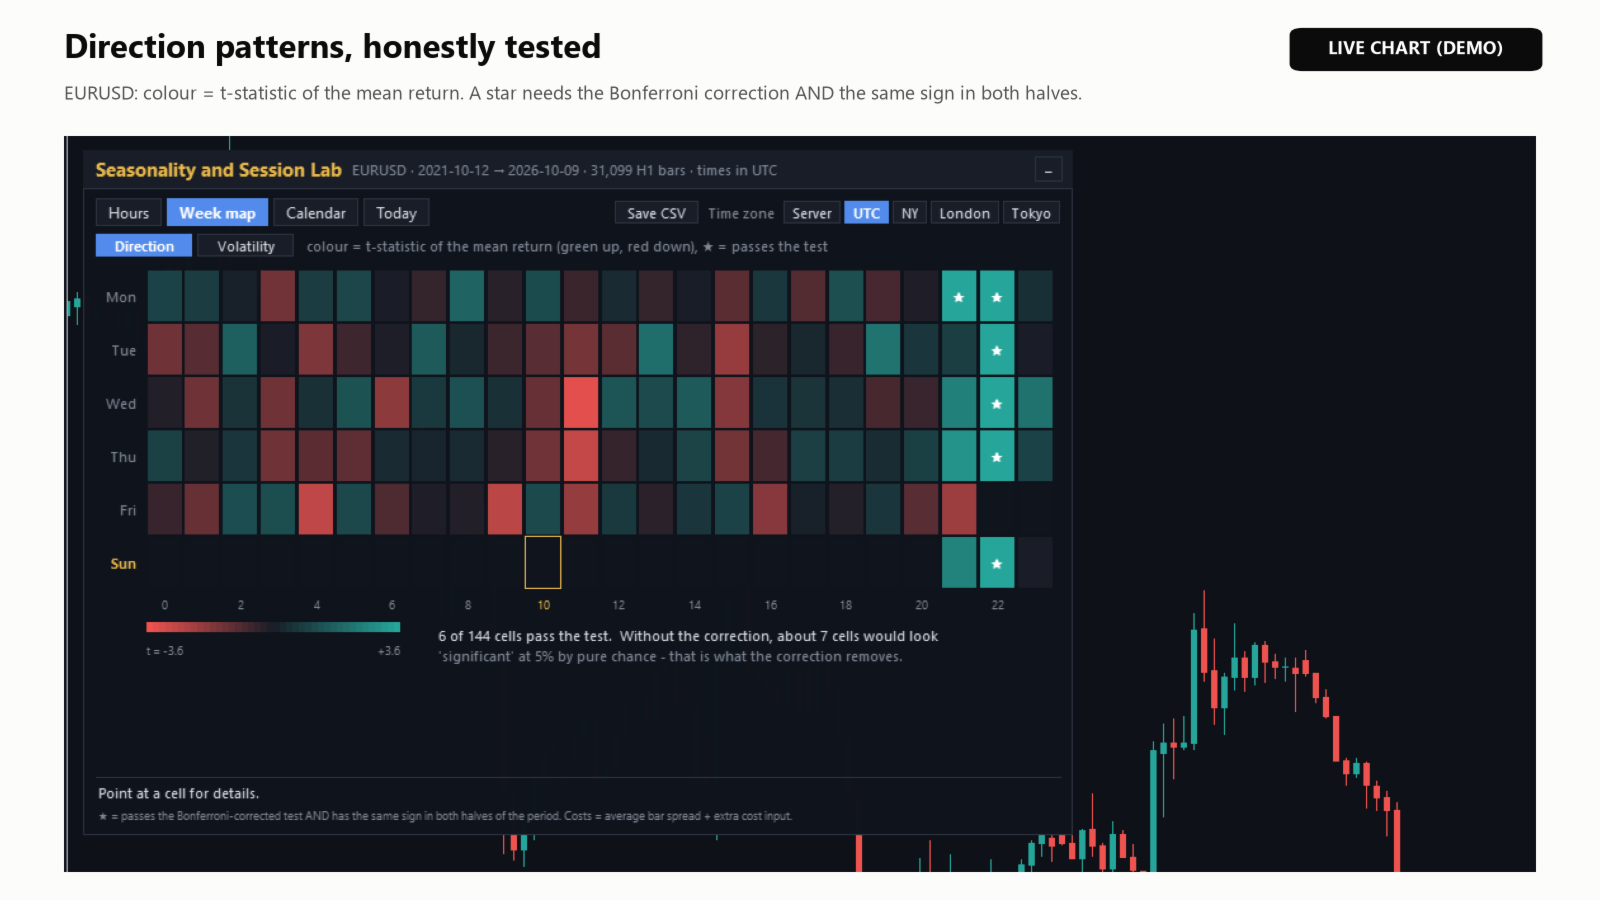
- Week map: weekday x hour heat map of direction (t-statistic) or volatility (average range).
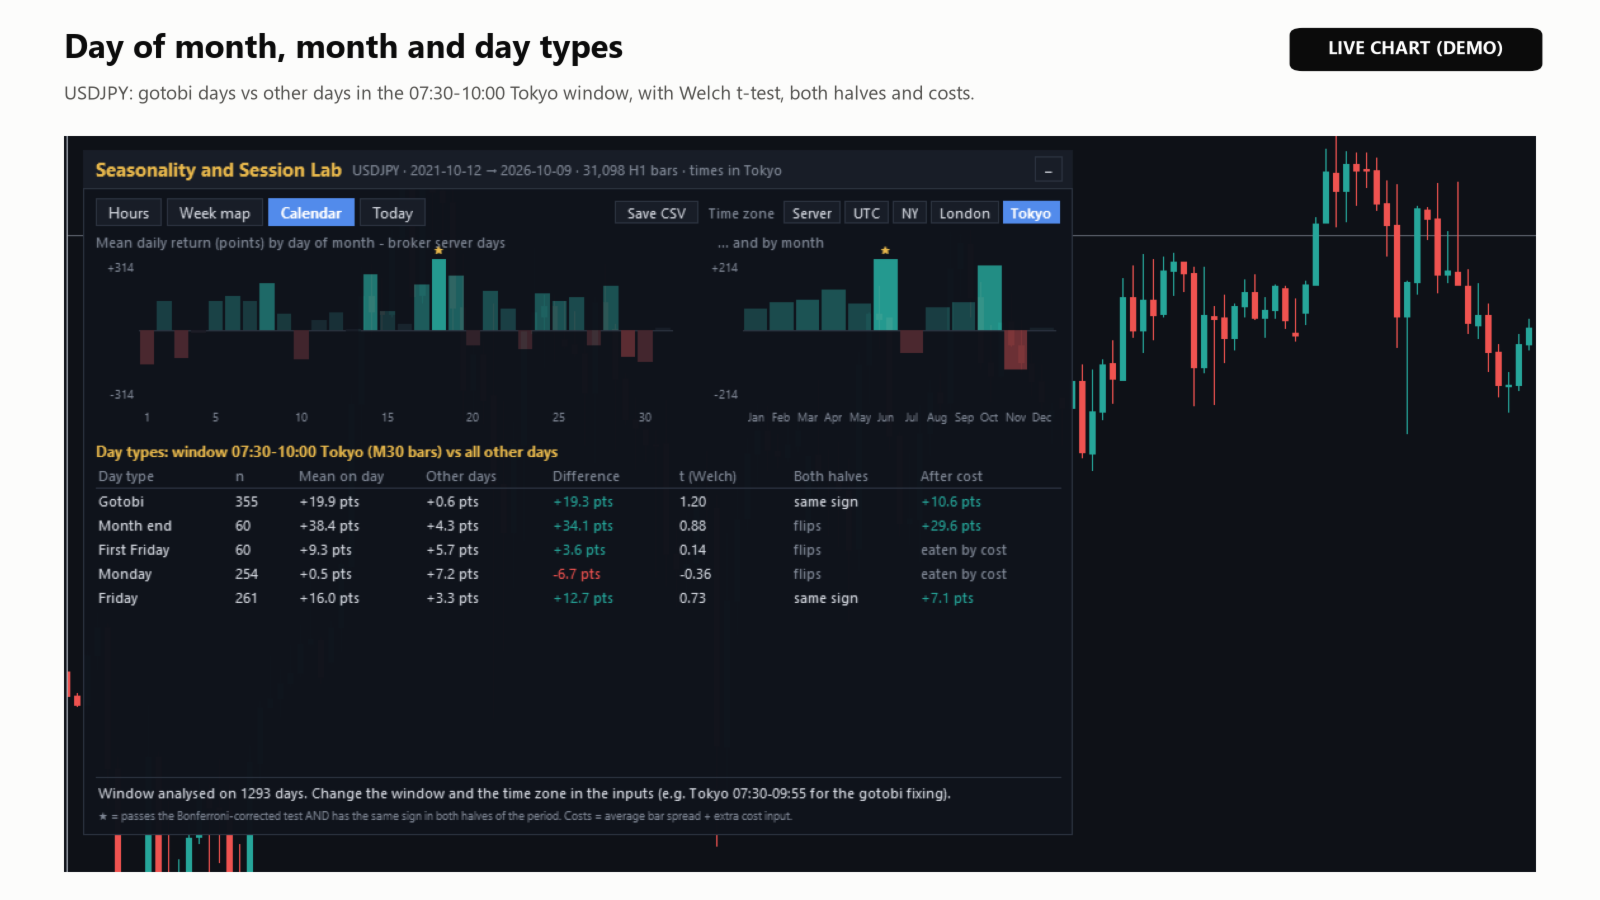
- Calendar: mean daily return by day of month and by month, and a day-type comparison for a time window you choose (for example 07:30-09:55 Tokyo for the gotobi fixing): gotobi days, month end, first Friday, Monday and Friday against all other days, with a Welch t-test.
- Today: today's range so far against history, the typical range left until the end of the day, and the next high-volatility hours.
When a pattern gets a star
- Its t-statistic passes the Bonferroni-corrected threshold for the number of cells compared (for 168 cells, about 3.6 instead of 1.96).
- The mean has the same sign in the first and in the second half of the period.
- It has at least 30 observations.
"After cost" subtracts the average spread of that hour and your extra cost input. Often nothing is left - that is worth knowing before you build a strategy on a pattern.
Time zones
Server, UTC, New York, London or Tokyo, switchable on the panel. The broker's server offset is detected for every week from the Friday close of a forex symbol, so daylight-saving changes of the server are handled. You can also set it by hand.
Things to know
- History depth is limited by "Max bars in chart" (Tools - Options - Charts). 100,000 H1 bars cover more than ten years.
- The results are statistics of your broker's past prices. They are not trading signals and do not predict the future.
- "Save CSV" writes the hour, week-map and day-type tables.
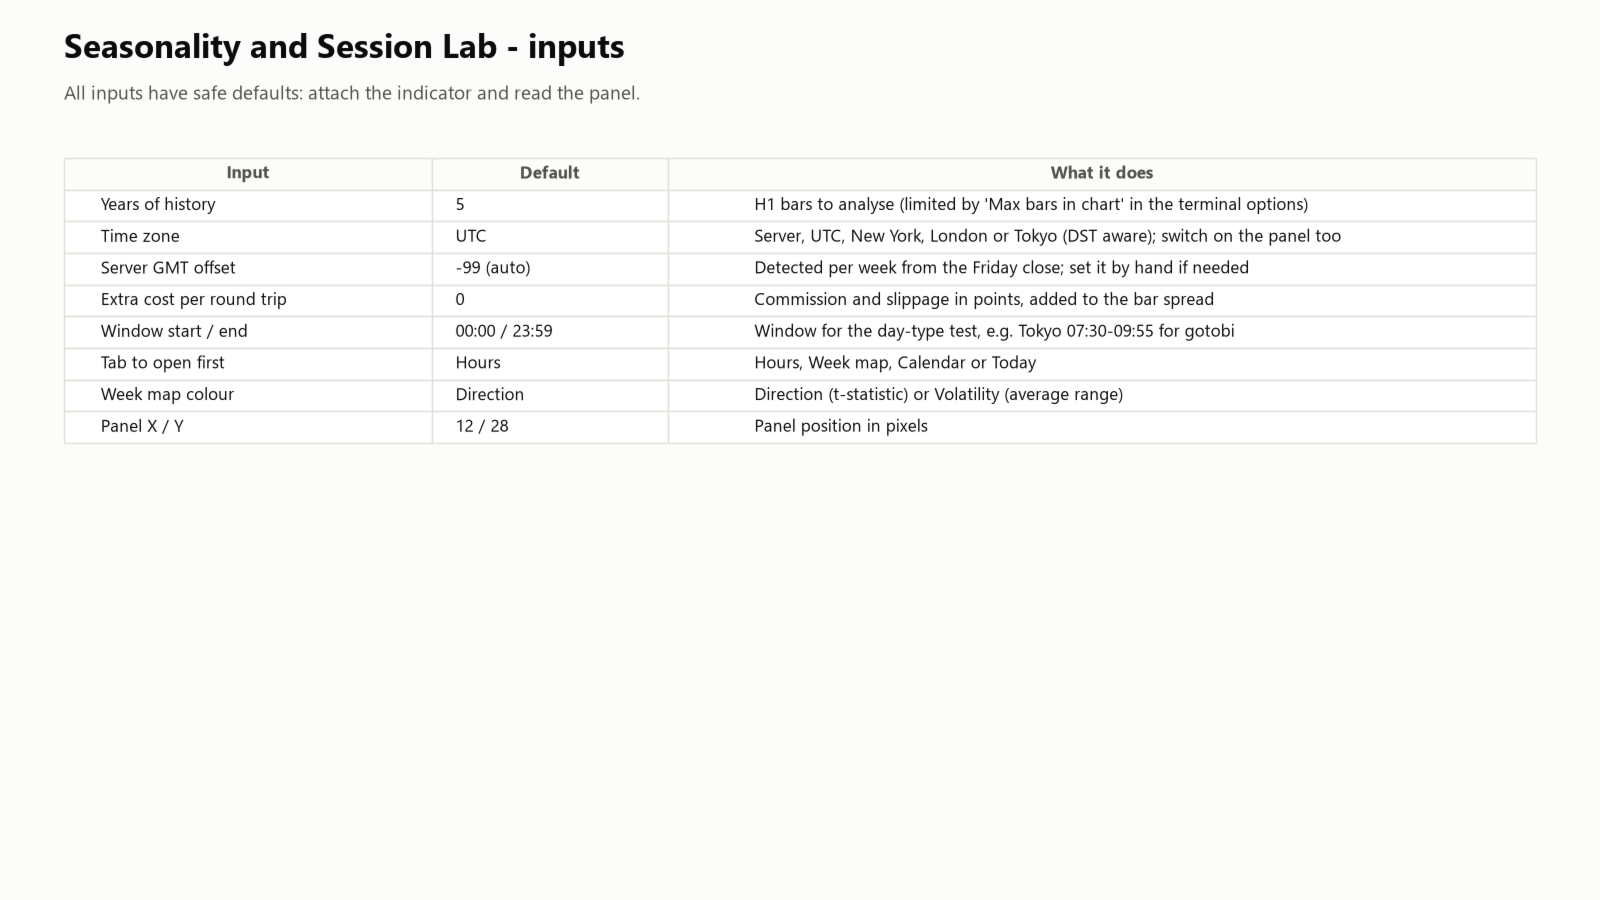
Inputs
- Years of history (5), time zone (UTC), server GMT offset (-99 = automatic).
- Extra cost per round trip in points (0): commission and slippage, added to the bar spread.
- Window start and end (00:00 - 23:59): the window for the day-type comparison, in the selected time zone.
- Tab to open first, week map colour (direction or volatility), panel position.
Support
If anything is unclear, please send me a private message on MQL5.
Trading leveraged products carries a high risk of loss.