News Impact Statistics
- Utilities
-
Mikoto Hamazono
 AI Trader Kyo | MQL Developer & Forex Innovator
As an MQL developer and a passionate innovator in FX, I build cutting-edge trading solutions that make full use of artificial intelligence. - Version: 1.0
- Activations: 10
News Impact Statistics measures how much the market really moves on each economic release - on this symbol, with your broker's prices - and shows the usual move of the next releases before they happen.
It uses the economic calendar built into MetaTrader 5 and the price history in your terminal. No web requests, no DLL, no external calendar feed. Indicator only: it never trades.
What you see
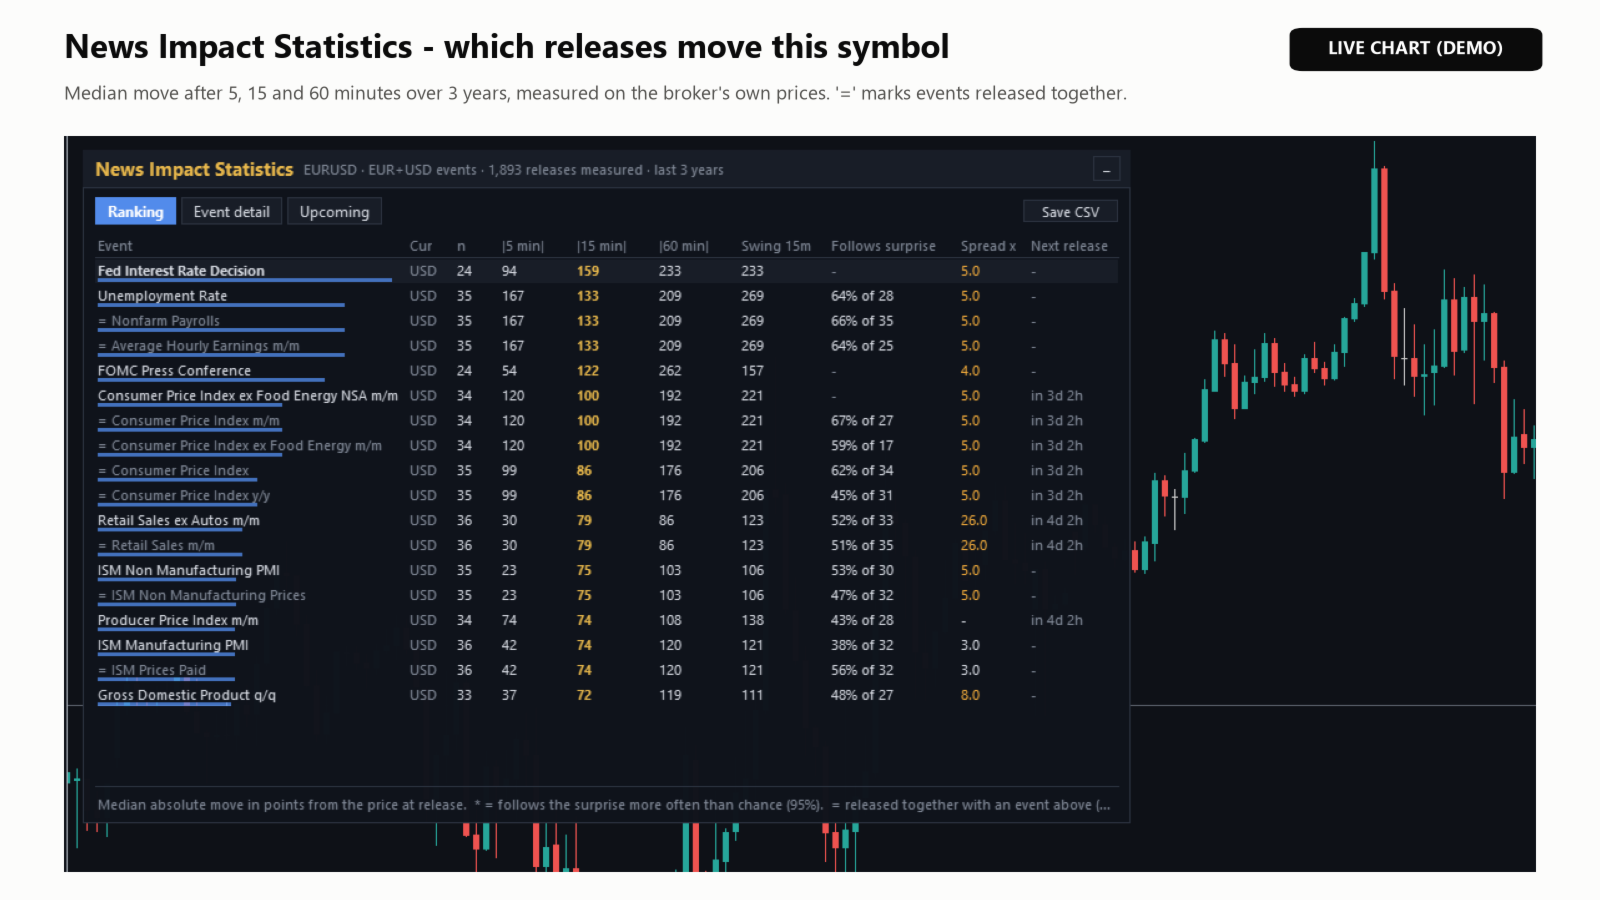
- Ranking: every high-importance release for the symbol's currencies over the last years, sorted by the median move after 15 minutes. Also the moves after 5 and 60 minutes, the 15-minute swing, how often the price followed the surprise, the spread widening and the time to the next release. Events released at the same moment (for example payrolls and the unemployment rate) are marked, so the same move is not counted as two signals.
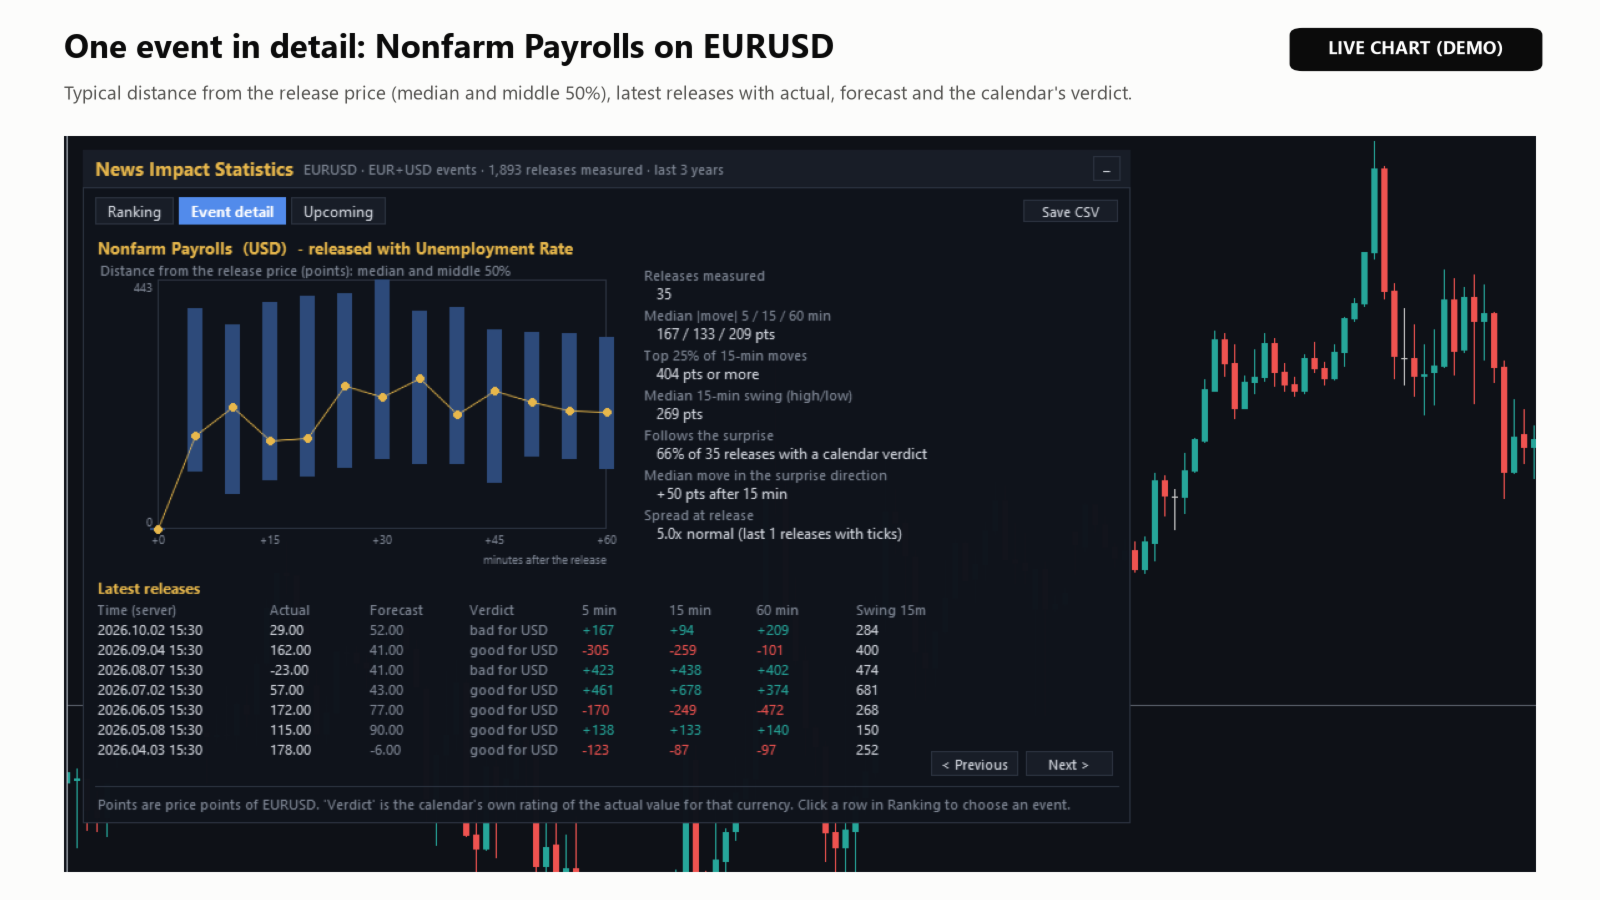
- Event detail: the typical path in the first hour (median and middle 50%), the top 25% of moves, and the latest releases with actual, forecast and the calendar's verdict.
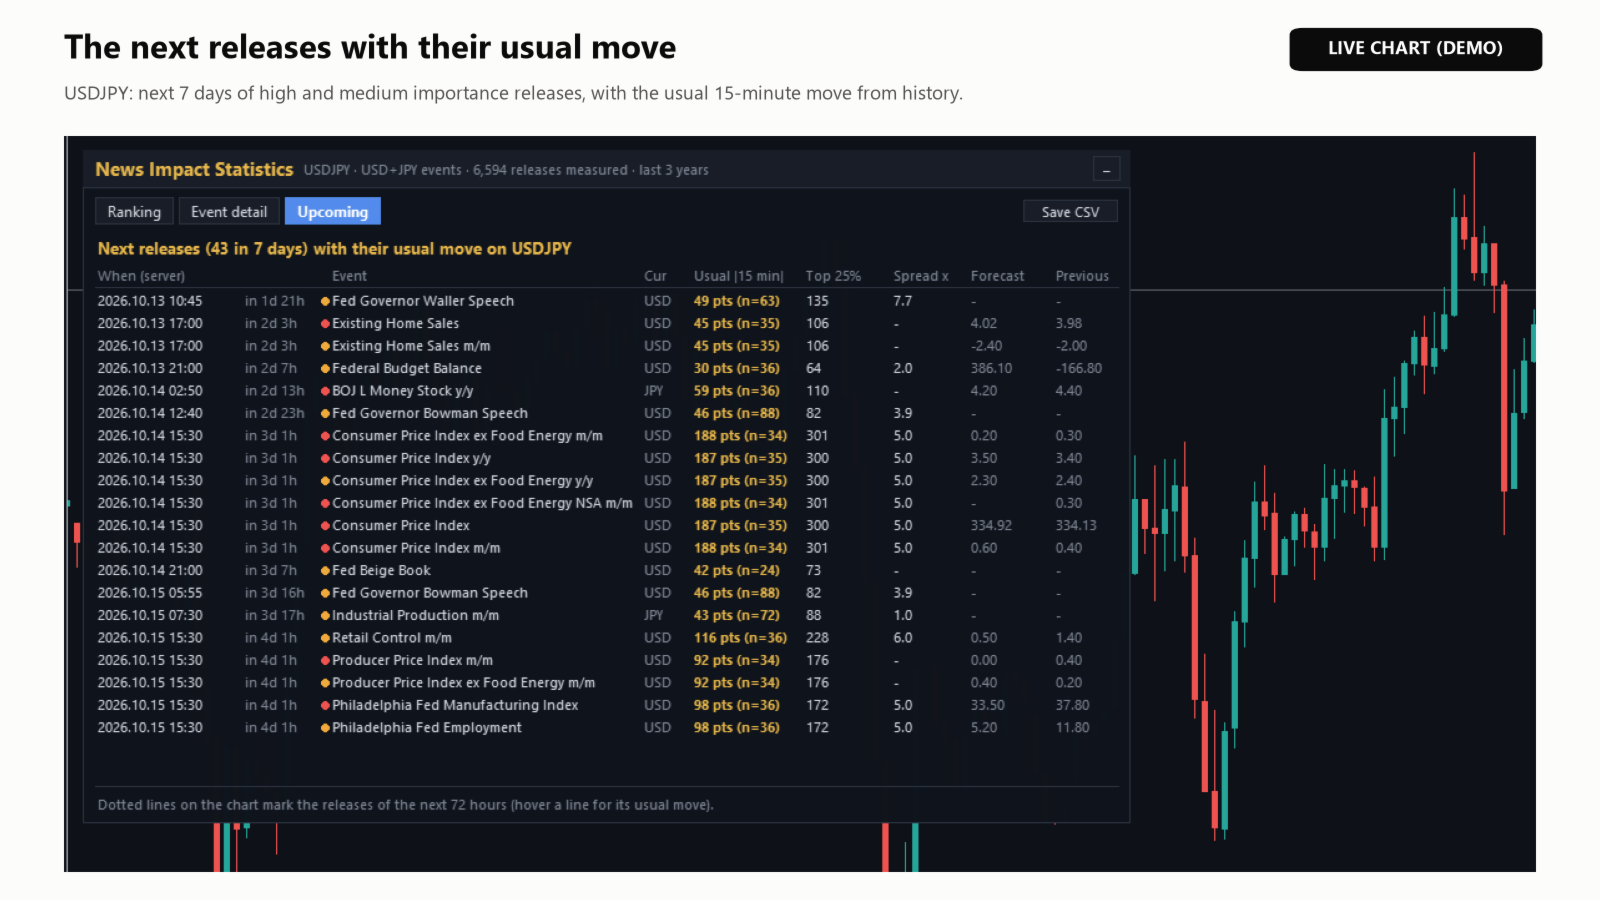
- Upcoming: the releases of the next 7 days with their usual 15-minute move, and dotted lines on the chart for the next 72 hours (hover a line to see the usual move).
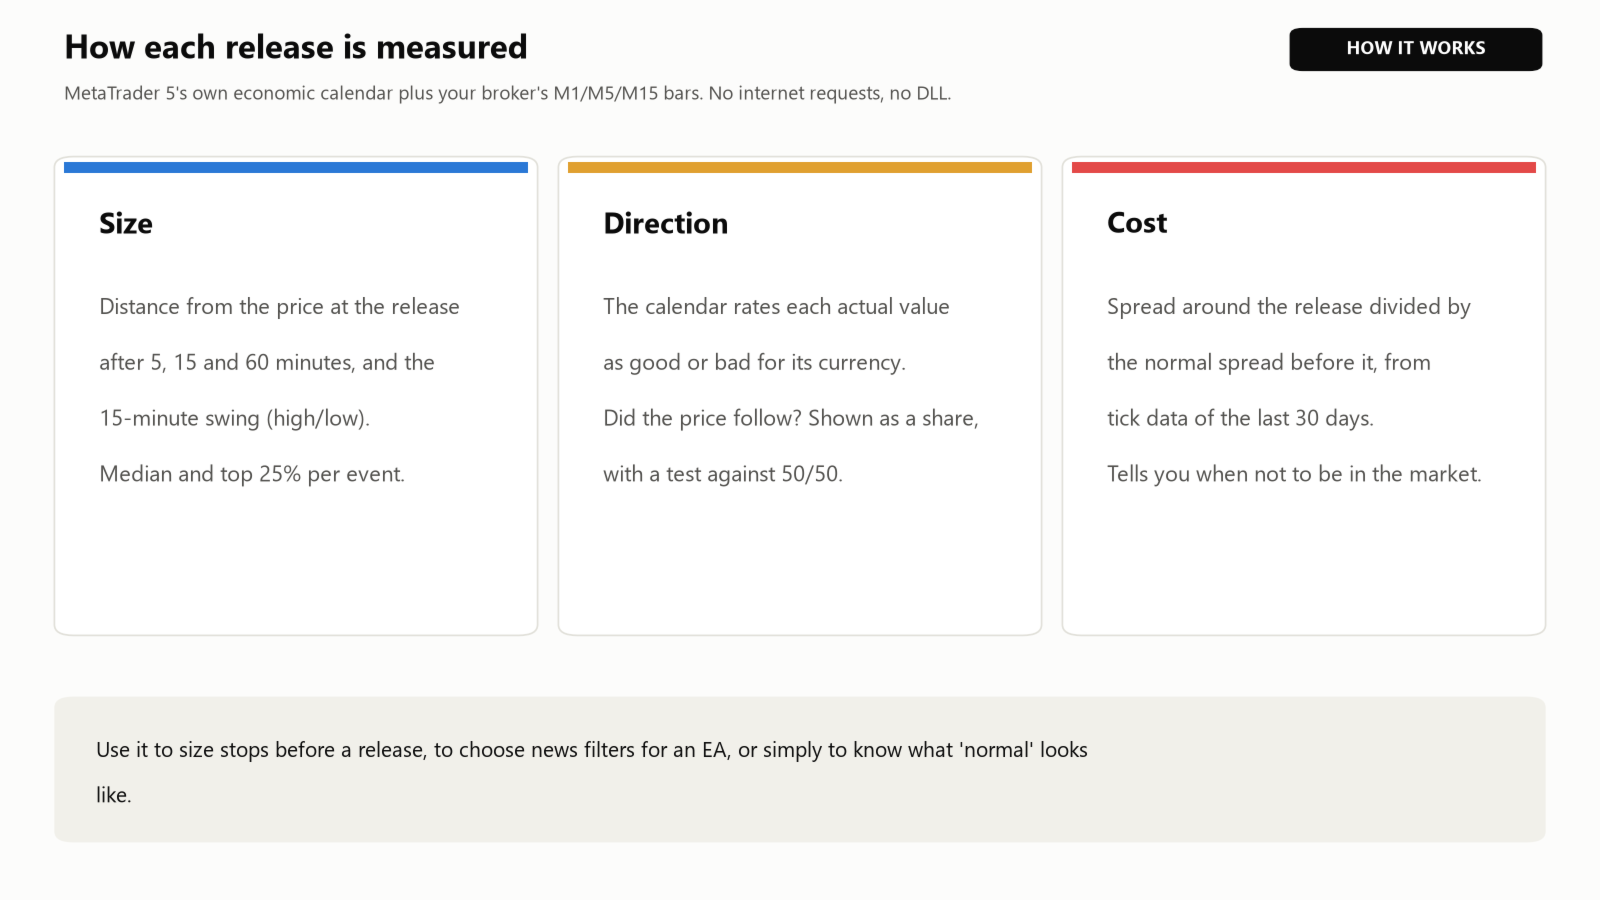
How it is measured
- Size: the distance from the price at the release time to the close after 5, 15 and 60 minutes, using the finest bars available for that date (M1, M5 or M15).
- Direction: the calendar rates every actual value as good or bad for its currency. The indicator checks whether the price moved that way after 15 minutes, with a binomial test against 50/50 (marked * when it is more than chance).
- Spread: the maximum spread around the release divided by the normal spread before it, from tick data of the last 30 days. Older releases are skipped on purpose, so the terminal does not download years of tick history.
What it is for
- Sizing stops and positions before a release.
- Choosing which events an EA's news filter should avoid - and which ones barely matter on this symbol.
- Knowing what a normal reaction looks like, so an abnormal one stands out.
Things to know
- Calendar times are in your broker's server time. Events without an exact time are skipped.
- The economic calendar is not available in the Strategy Tester, so the free demo shows built-in sample data.
- Moves are history, not forecasts. Spreads and slippage around releases differ between brokers.
- Price history depth depends on "Max bars in chart" (Tools - Options - Charts).
Inputs
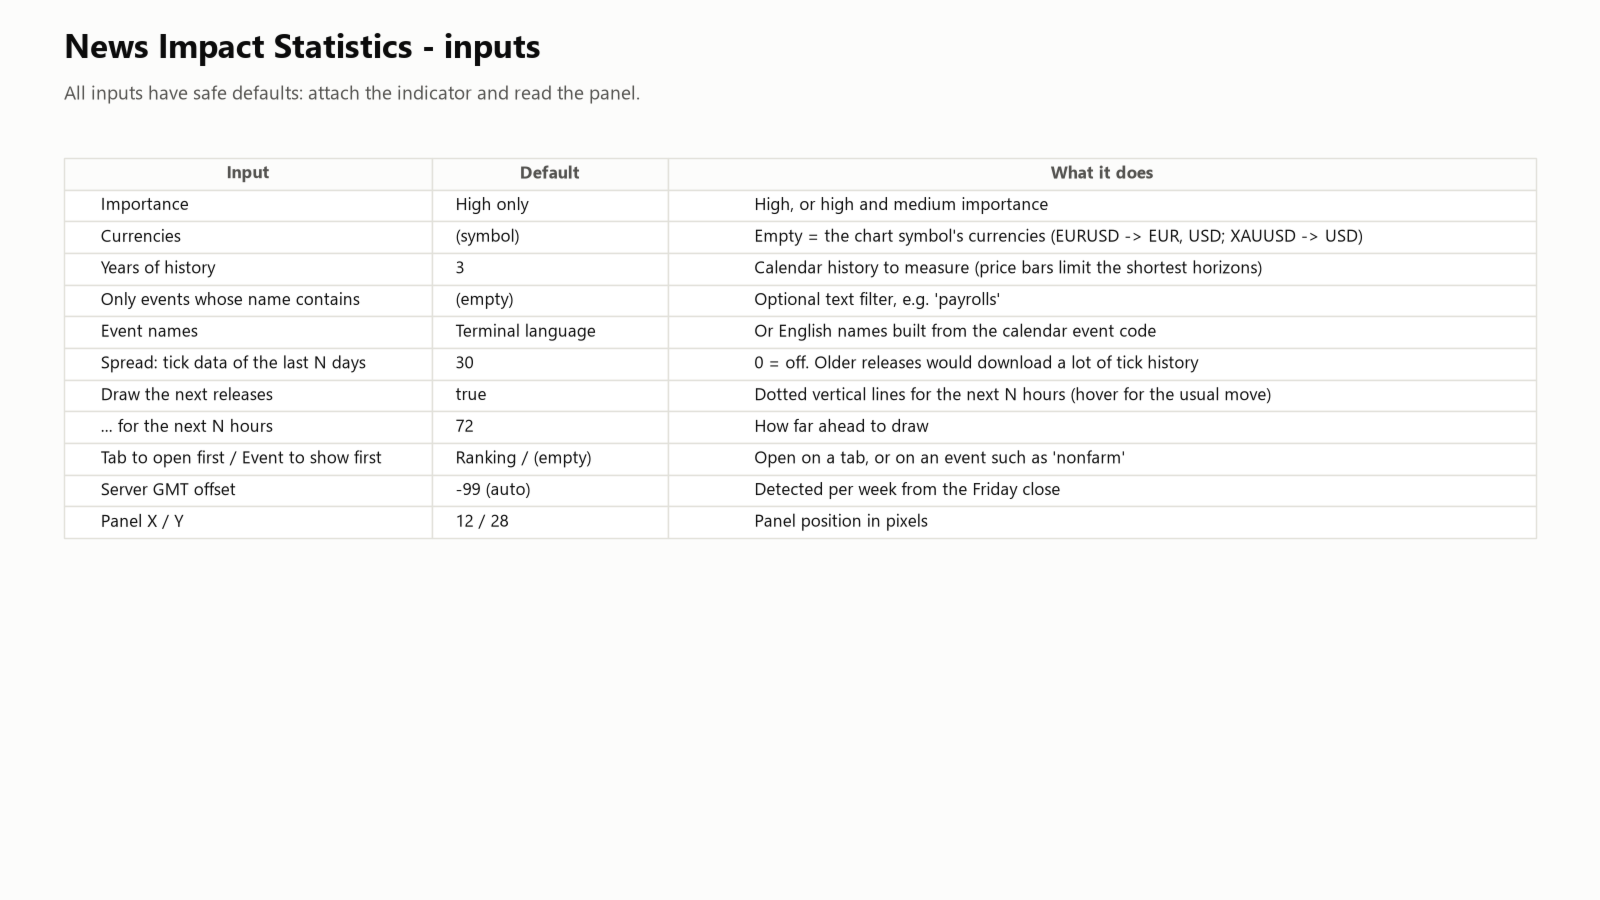
- Importance (high only), currencies (empty = the symbol's currencies), years of history (3), name filter.
- Event names: terminal language, or English names built from the calendar's event code.
- Spread from tick data of the last N days (30; 0 = off).
- Draw the next releases on the chart (true) for the next N hours (72).
- Tab to open first, event to show first (part of its name), server GMT offset (-99 = automatic), panel position.
Support
If anything is unclear, please send me a private message on MQL5.
Trading leveraged products carries a high risk of loss.