Advanced Risk Return Tool
- Utilities
- Version: 1.0
- Activations: 20

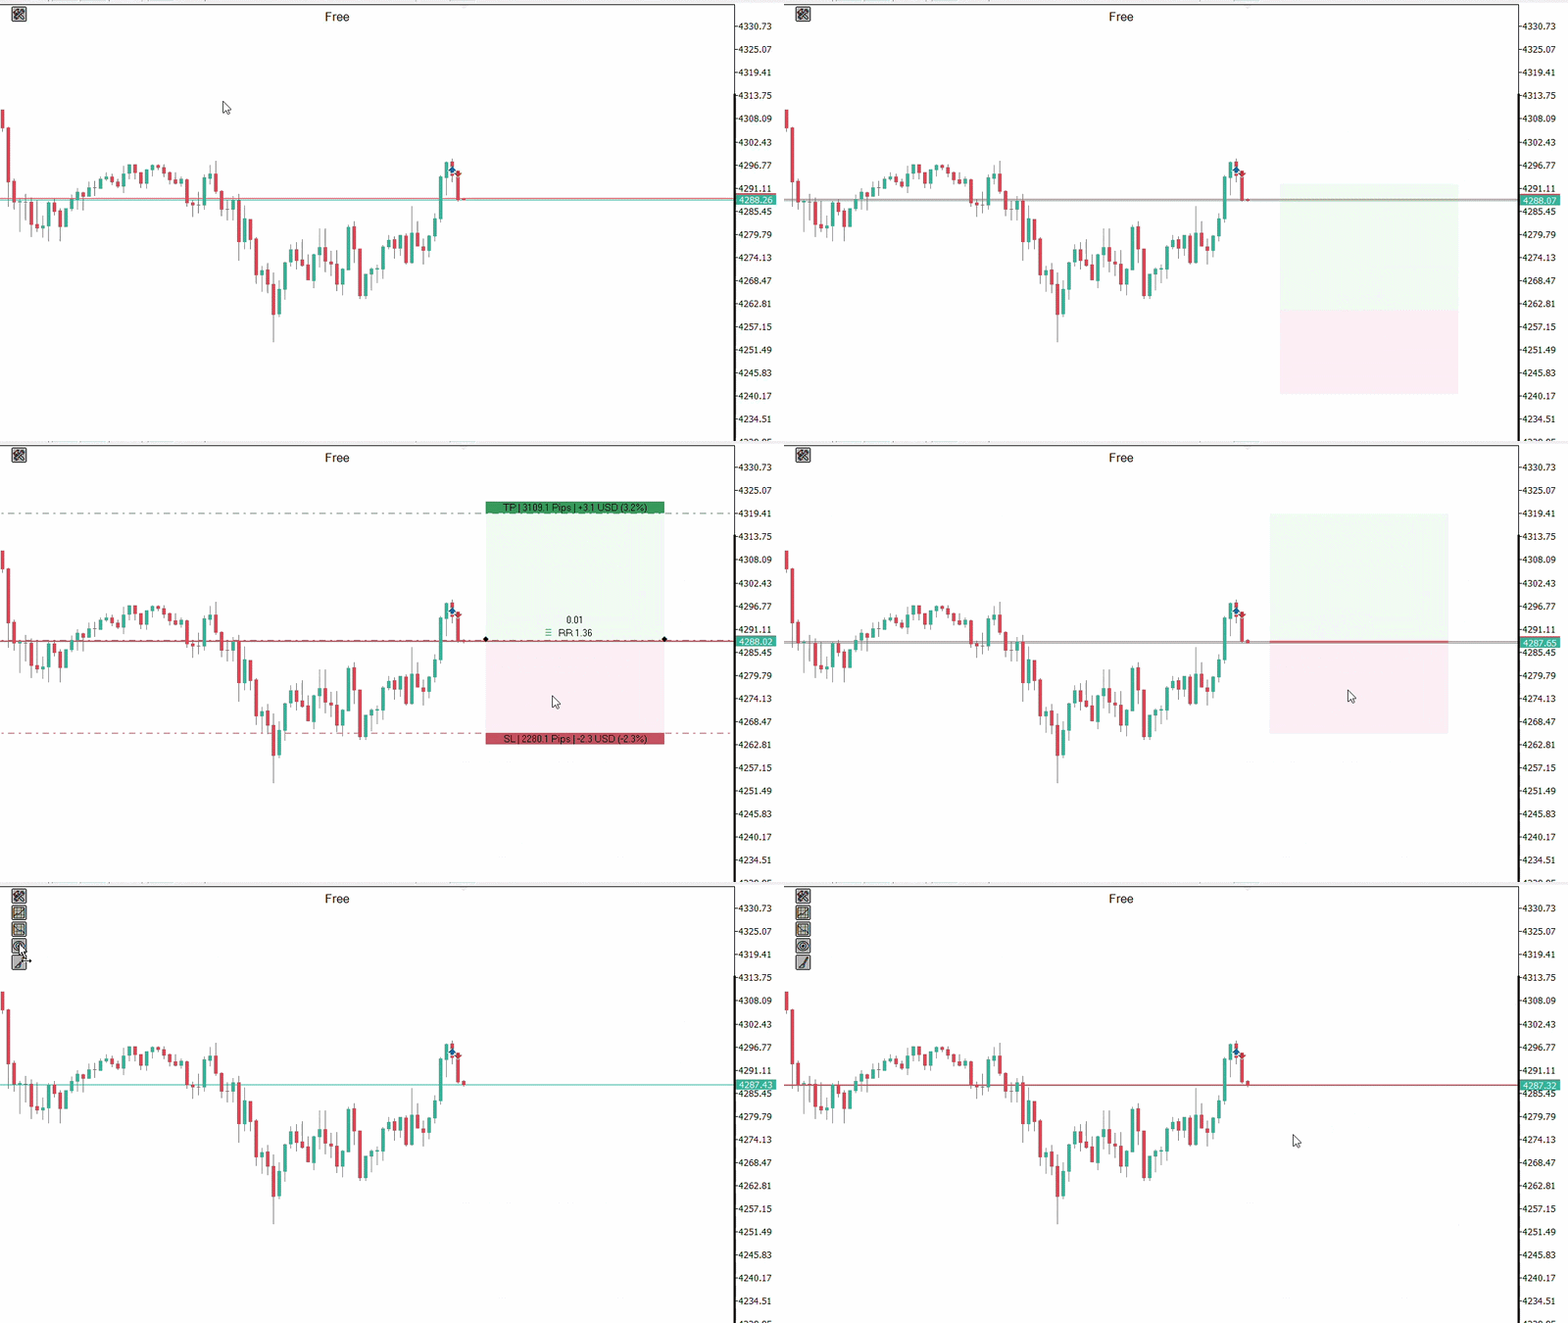
The tool allows you to create and manage Buy and Sell structures directly on the chart, visually positioning Entry, Target and Stop levels while displaying information such as the Risk/Return ratio, distance in pips, volume and financial values.
The structures are interactive and can be adjusted directly with the mouse, making trade planning and visual monitoring easier.
Main Features
Visual Risk/Return Structures
Create Buy and Sell structures directly from the tool panel.
Each structure displays relevant information for trade planning:
- Entry level
- Target level
- Stop level
- Risk/Return ratio
- Distances in pips
- Volume
- Estimated profit
- Estimated loss
The information is updated according to the levels defined on the chart.
Interactive Chart Editing
Structures can be visually manipulated using the mouse.
You can:
- Move the entire structure
- Adjust the Entry level
- Adjust the Target level
- Adjust the Stop level
- Change the horizontal length of the structure
- Select structures individually
- Work with multiple structures on the same chart
This allows you to analyze different scenarios without constantly changing the tool parameters.
Volume Control
The volume used in the calculations can be adjusted through controls available directly on the structure.
The displayed financial values are recalculated according to the selected volume and the distances between Entry, Target and Stop.
Integration with Orders and Positions
Advanced Risk Return Tool can track states related to trades on the current symbol.
The tool provides visual support for:
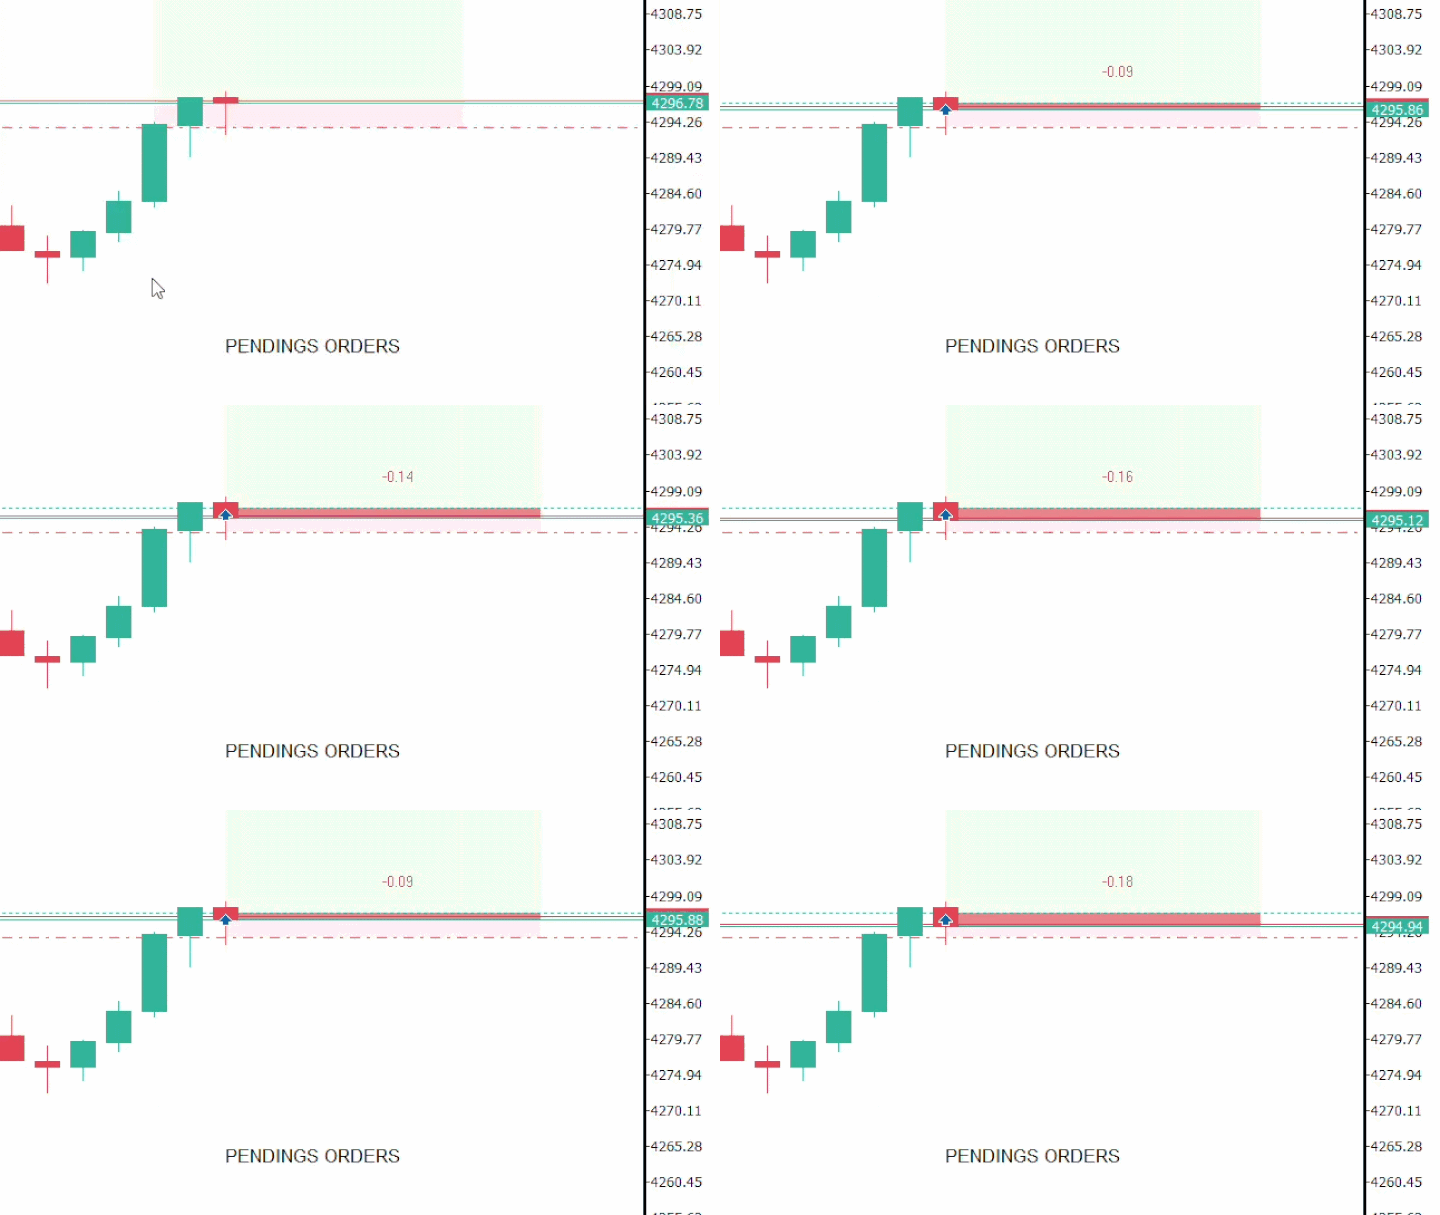
- Pending orders
- Open positions
- Completed trades
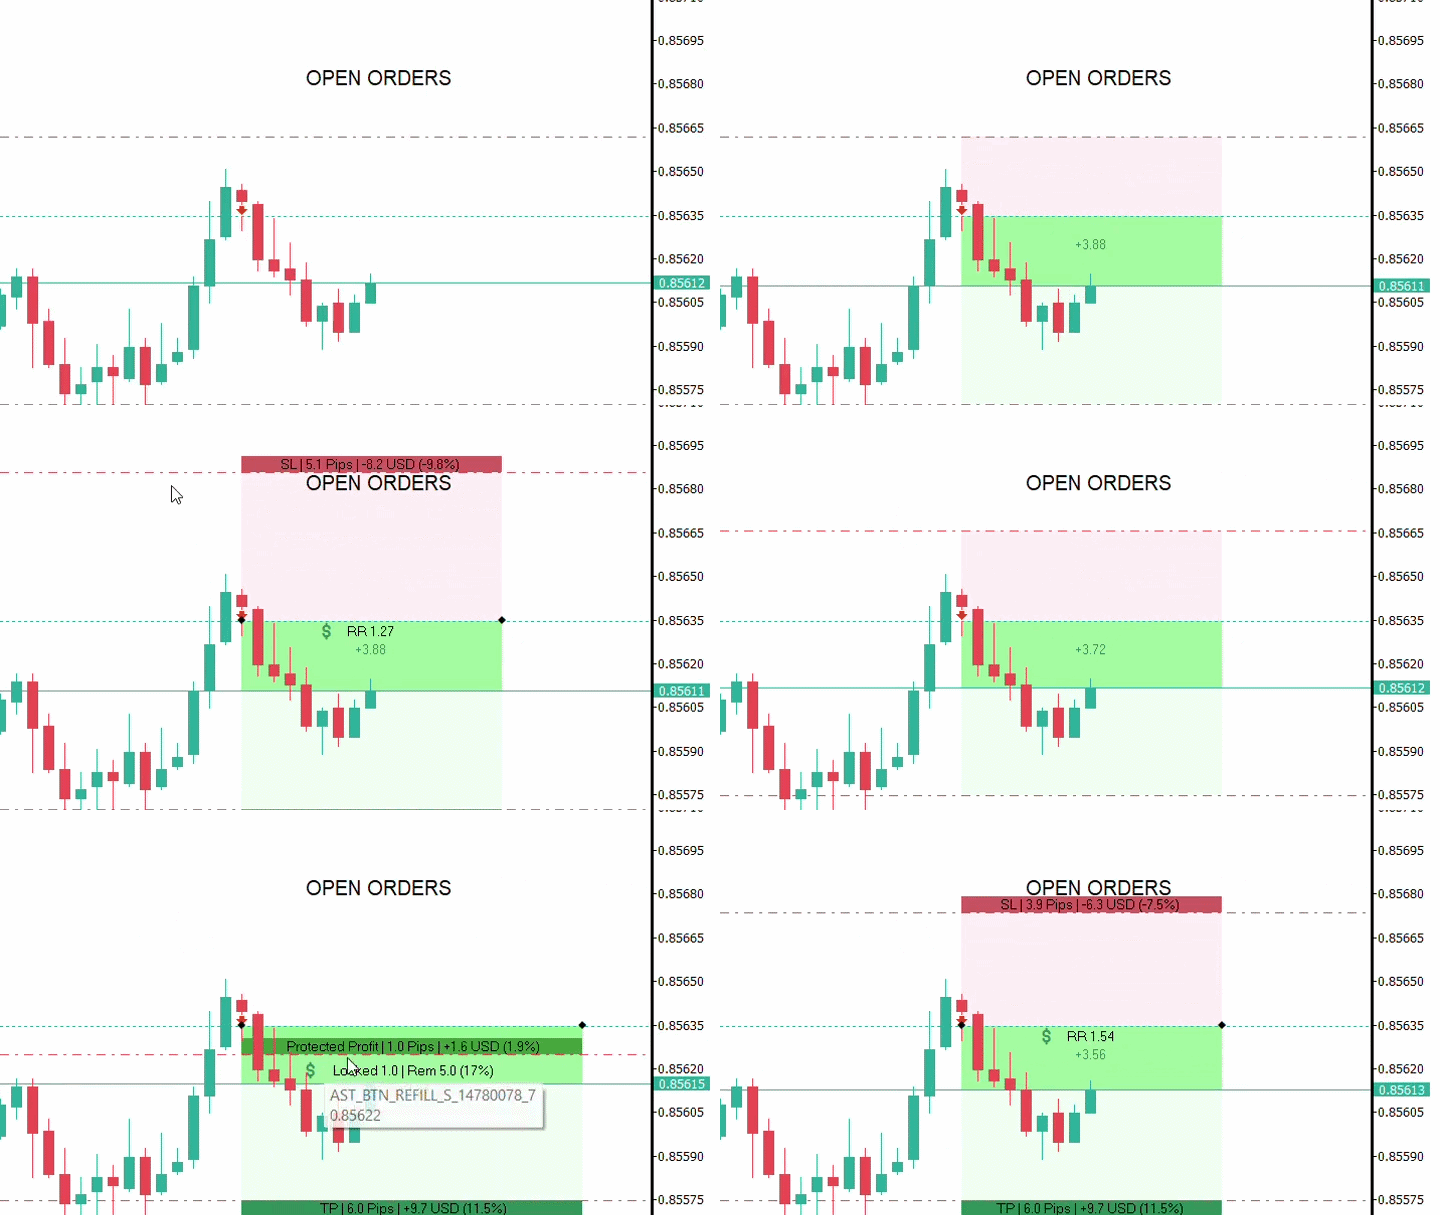
When a structure is associated with a trade, its visual information can follow the corresponding changes in the trading state.
Target and Stop Tracking
Target and Stop levels can be represented through the structure itself and reference lines.
When applicable, these levels can follow the corresponding levels of the associated trade, keeping the visual representation consistent with the trading state.
Trade Progress Visualization
After an entry is activated, the tool can visually represent the progress of the trade within the structure.
Areas corresponding to profit or loss development are displayed directly on the chart together with the respective financial information.
The structure can also remain available as a visual reference after the trade is completed.
Reference Lines
Lines corresponding to the structure levels can be displayed when required.
They provide additional references for:
- Entry
- Target
- Stop
The lines can be used during trade planning and monitoring.
Multiple Structures
Multiple independent structures can be maintained simultaneously on the same chart.
This feature allows you to:
- Plan different entries
- Compare different Risk/Return ratios
- Work with Buy and Sell structures
- Keep previous structures as visual references
Each structure can be selected and manipulated individually.
Compact Interface
The tool features a compact panel integrated into the chart for quick access to its main functions.
It allows you to:
- Create a Buy structure
- Create a Sell structure
- Show or hide structures
- Remove structures from the chart
The panel occupies minimal space, keeping the main chart area available for analysis.
Hotkeys
Advanced Risk Return Tool includes hotkeys for faster interface management.
V — Show/Hide Panel
Shows or hides the tool button panel.
F — Show/Hide Structures
Hides structures that are not selected or displays them again.
Delete — Delete Structure
Removes the currently selected structure.
The V and F keys can be changed in the tool parameters.
Persistence
Relevant structure and interface states are preserved, providing greater workspace continuity when the tool or chart is reinitialized.
This allows structures to remain part of the trade planning and monitoring environment.
Customization
Several elements can be configured in the parameters, including:
- Target area colors
- Stop area colors
- Colors used for profit and loss representation
- Text color
- Text size
- Key to show or hide the panel
- Key to show or hide structures
This allows the tool's appearance to be adapted to different templates and visual preferences.
How to Use
Open the tool panel and select Buy or Sell to create a new structure.
After creation, adjust the Entry, Target and Stop levels directly on the chart according to the scenario you want to analyze.
Set the volume used in the calculations and use the structure controls to manage the displayed levels and information.
Multiple structures can be maintained simultaneously on the chart.
Use F to quickly hide or show structures and V to show or hide the button panel.
Advanced Risk Return Tool is designed for planning, managing and visualizing Risk/Return structures in MetaTrader 5.
The tool does not provide trading signals and does not guarantee financial results.