Smart Data Export Indicator
- Utilities
-
Mikoto Hamazono
 AI Trader Kyo | MQL Developer & Forex Innovator
As an MQL developer and a passionate innovator in FX, I build cutting-edge trading solutions that make full use of artificial intelligence. - Version: 1.0
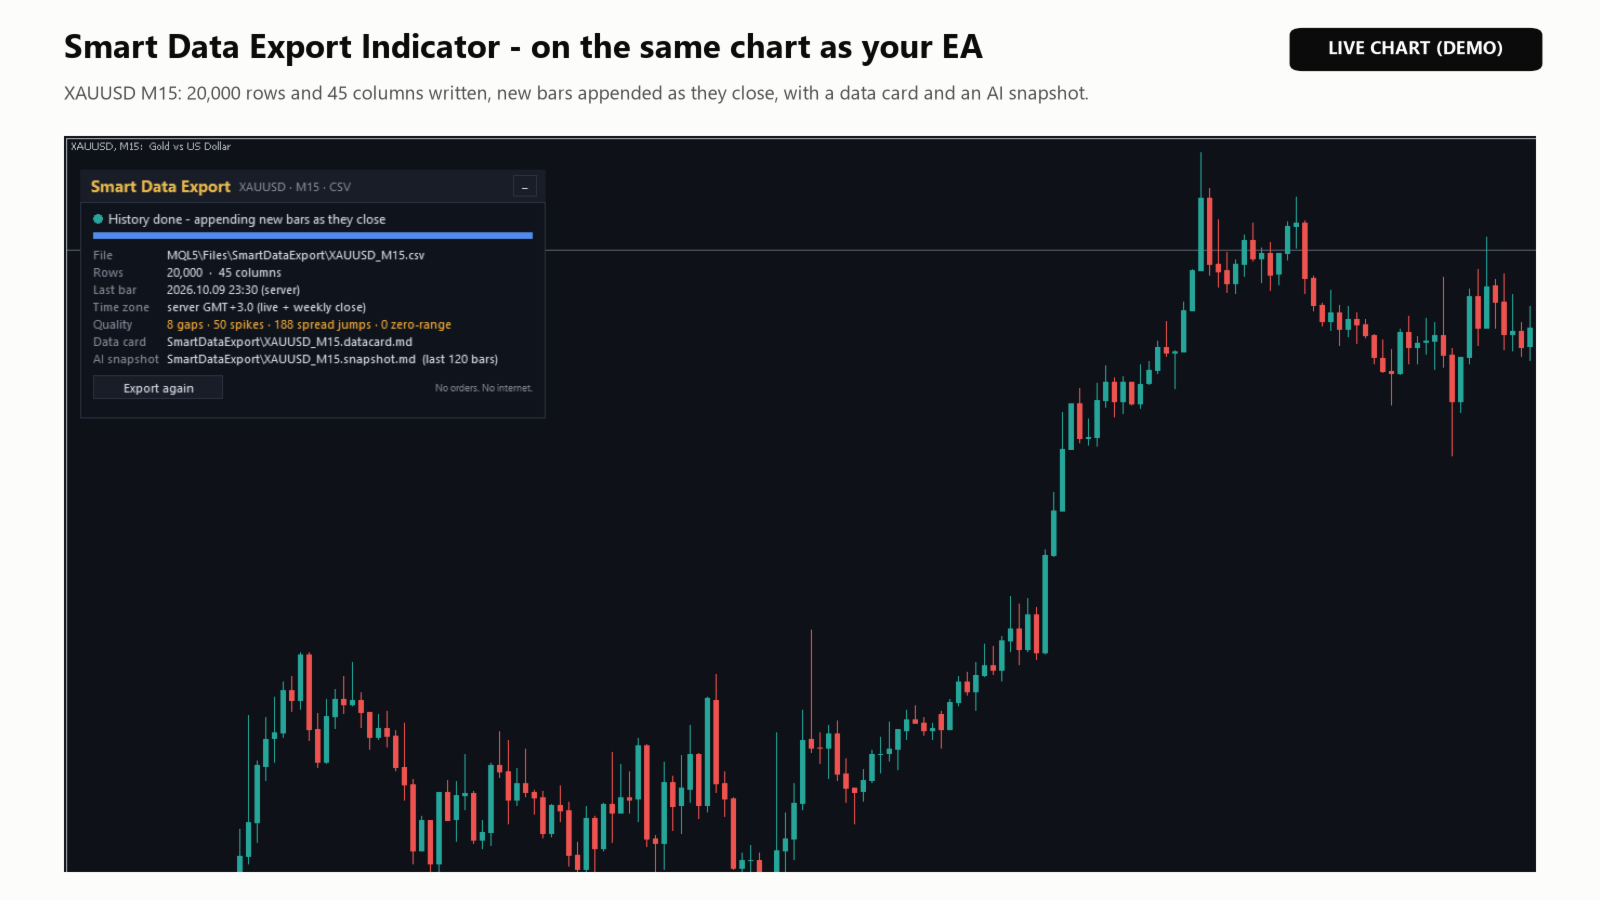
Smart Data Export Indicator writes clean market data from MetaTrader 5 to CSV or JSON Lines - with exactly the columns you choose, a data card that explains every column, and a paste-ready snapshot for ChatGPT, Claude or any other AI assistant.
It replaces my free SmartDataExportEa and is rebuilt as an indicator: it runs on the same chart as your Expert Advisor, and it never trades. No DLL, no web requests.
What it writes
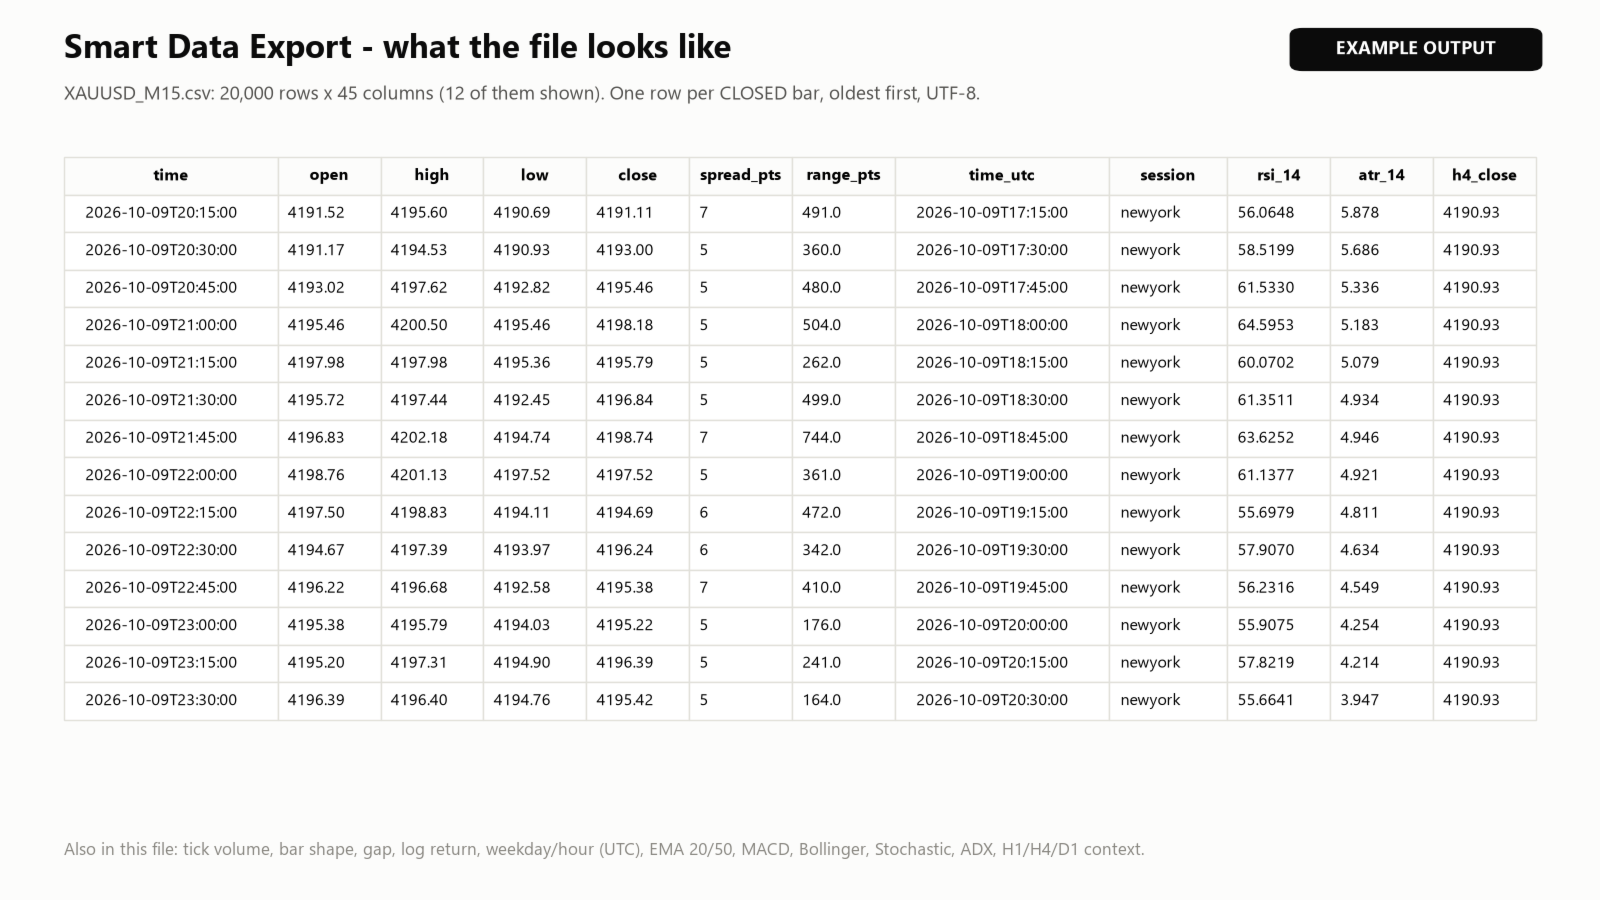
- Data file (CSV with comma or semicolon, or JSON Lines): one row per closed bar, oldest first, UTF-8. New bars are appended as they close; the file is never rewritten, so Python, Excel or Power BI can read it while it grows. If another program locks the file, the rows wait and are written later.
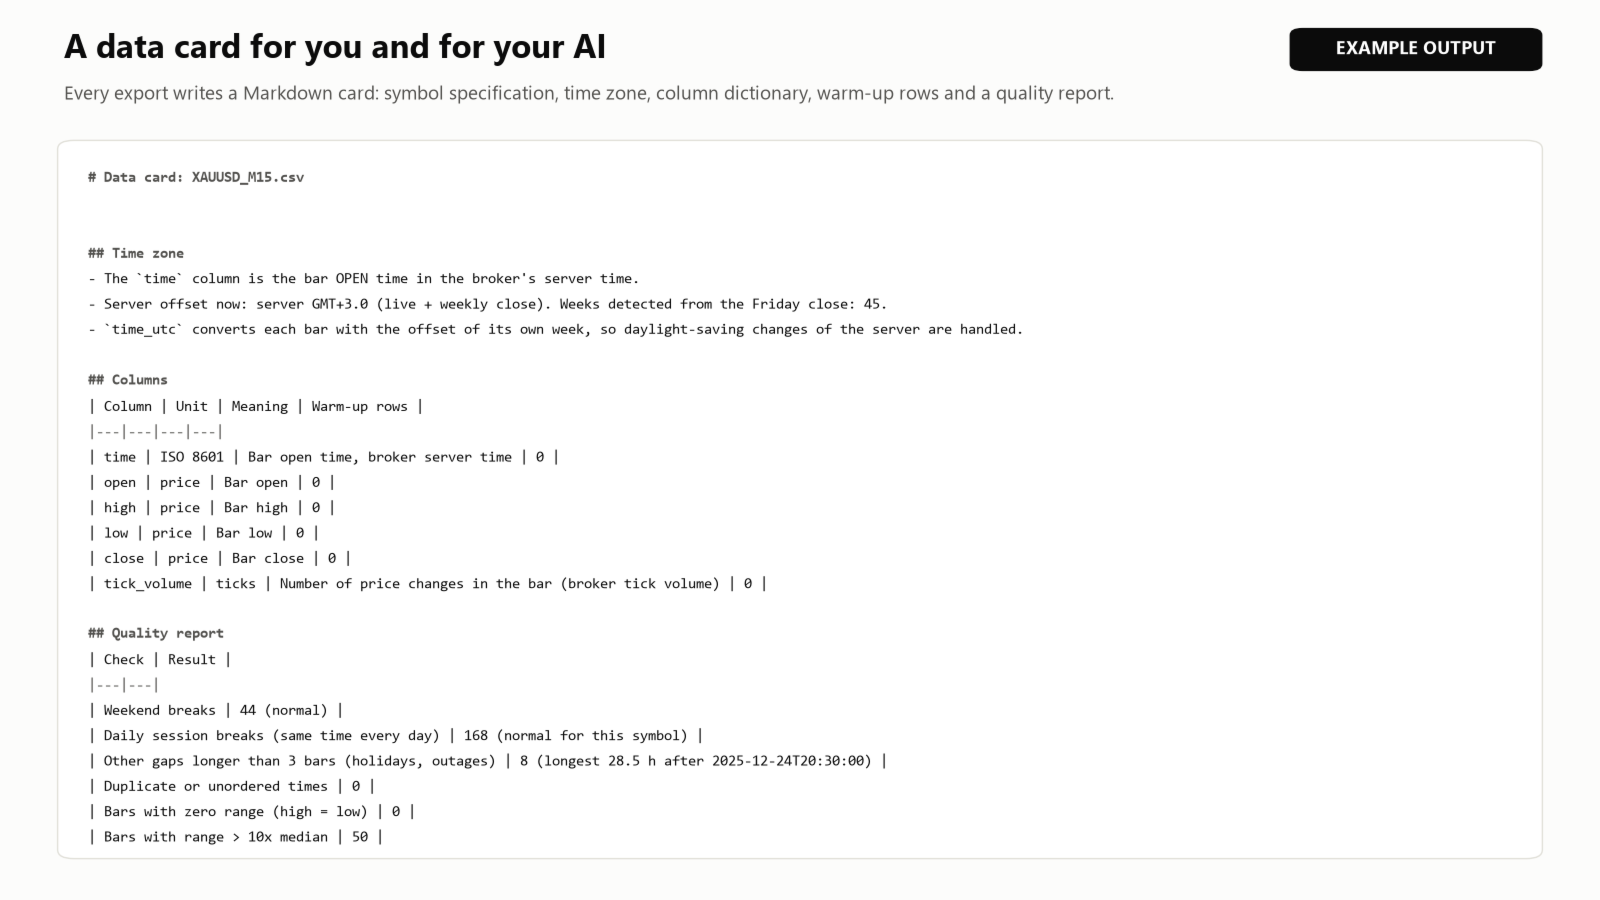
- Data card (.md): symbol specification, server time zone, a dictionary of every column with its unit and warm-up rows, and a quality report (weekend and daily breaks, real gaps, duplicate times, range spikes, spread jumps).
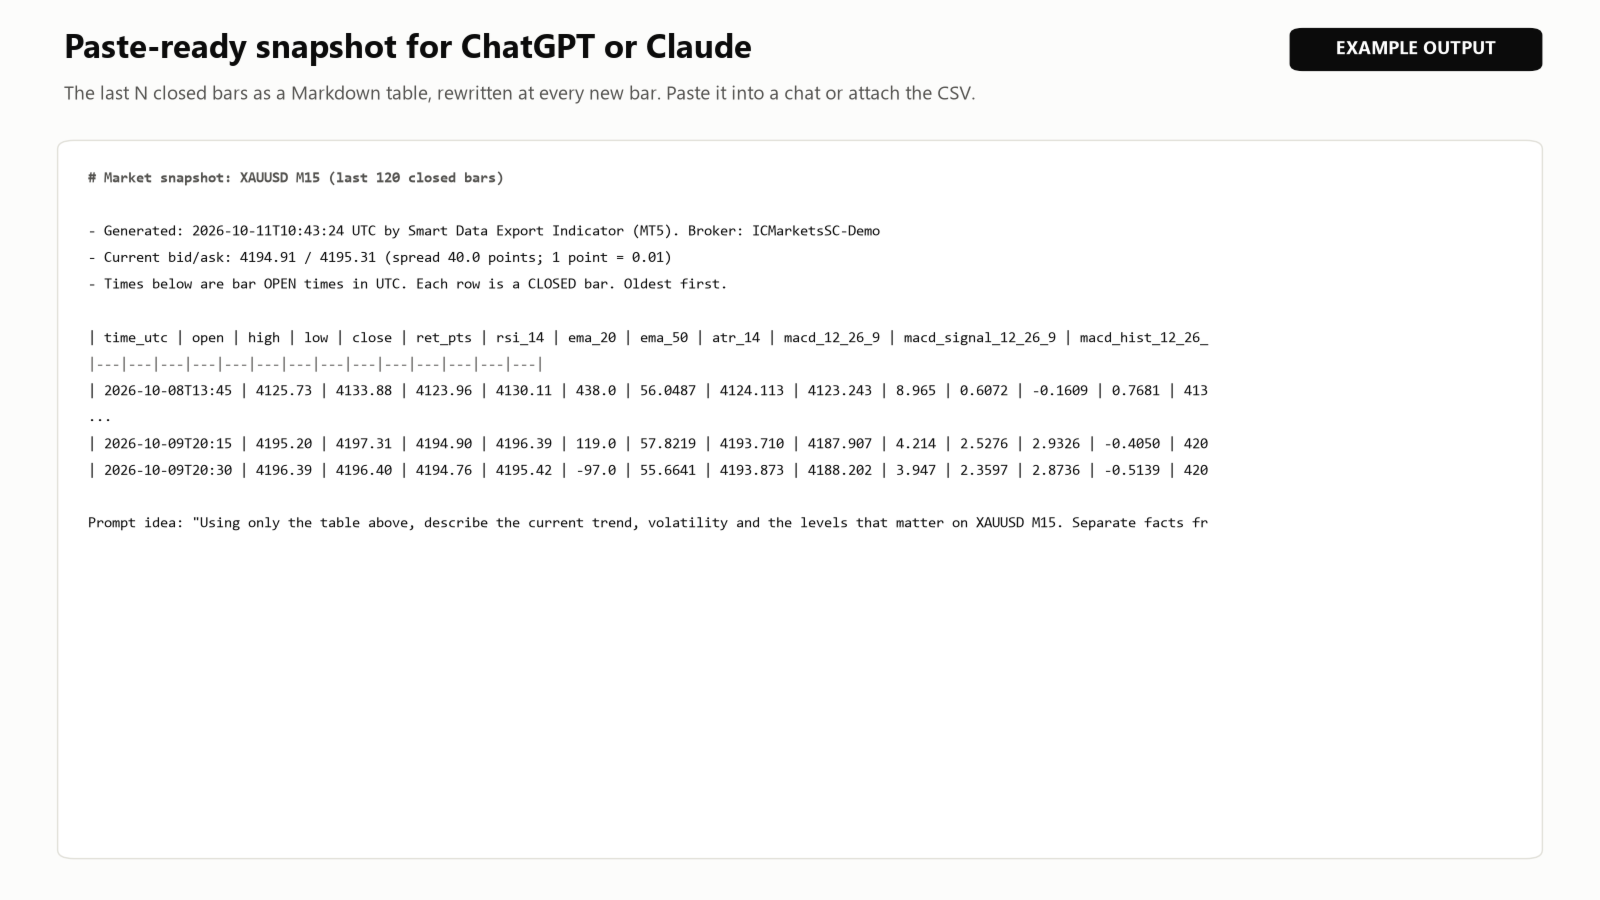
- AI snapshot (.md): the last N closed bars as a Markdown table, rewritten at every new bar - paste it into a chat.
- Deals (optional): this account's deals with magic number, commission, swap and exit reason.
Columns you can choose
- Price (open, high, low, close), tick volume and real volume, bar spread.
- Bar shape: return, range, body, wicks, gap and log return (in points).
- Time features: UTC time (the broker's offset is detected for every week), ISO weekday, hour and session label (Tokyo, London, New York, daylight-saving aware).
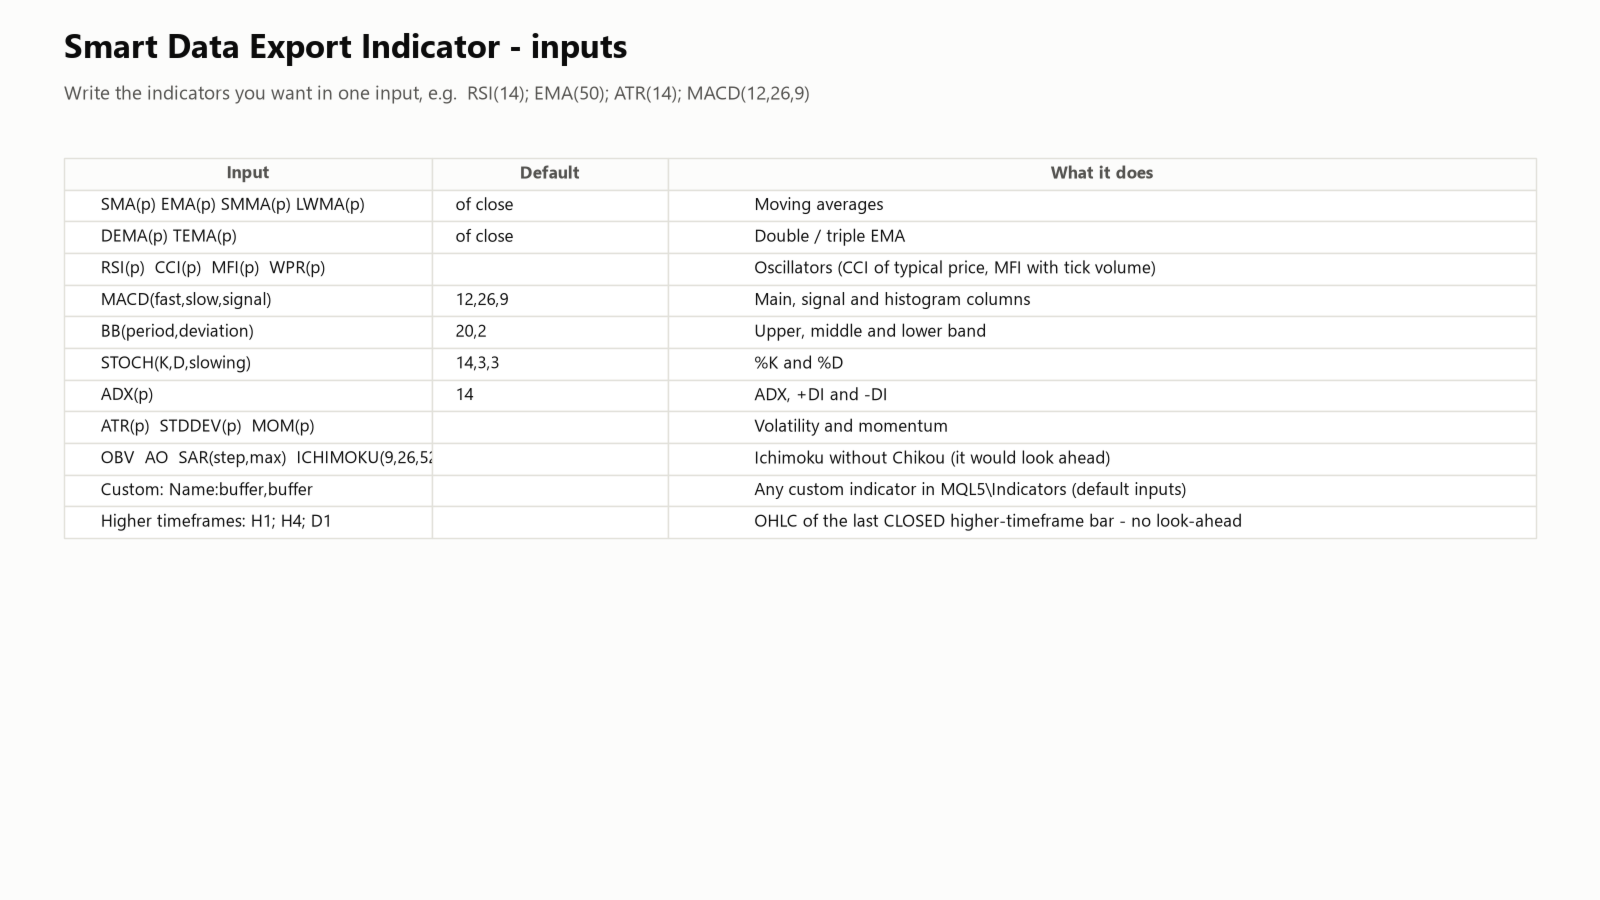
- Indicators by name in one input: RSI(14); EMA(50); ATR(14); MACD(12,26,9); BB(20,2); STOCH(14,3,3); ADX(14) - also SMA, SMMA, LWMA, DEMA, TEMA, CCI, MFI, WPR, MOM, STDDEV, OBV, AO, SAR and ICHIMOKU.
- Any custom indicator buffer: MyIndicator:0,1.
- Higher-timeframe context (H1, H4, D1 and others): open, high, low and close of the last bar that had already closed.
Safe for analysis
- Only closed bars are written; the bar still forming never is.
- Higher-timeframe values come from bars that had closed by the close of each row (no look-ahead). Ichimoku's Chikou line is not offered because it uses later bars.
- The warm-up rows of each indicator are listed in the data card.
Things to know
- Files are written to MQL5\Files\SmartDataExport, or to Terminal\Common\Files with the "common folder" option.
- History depth is limited by "Max bars in chart" (Tools - Options - Charts).
- In the Strategy Tester the files are written to the tester agent's folder.
Inputs
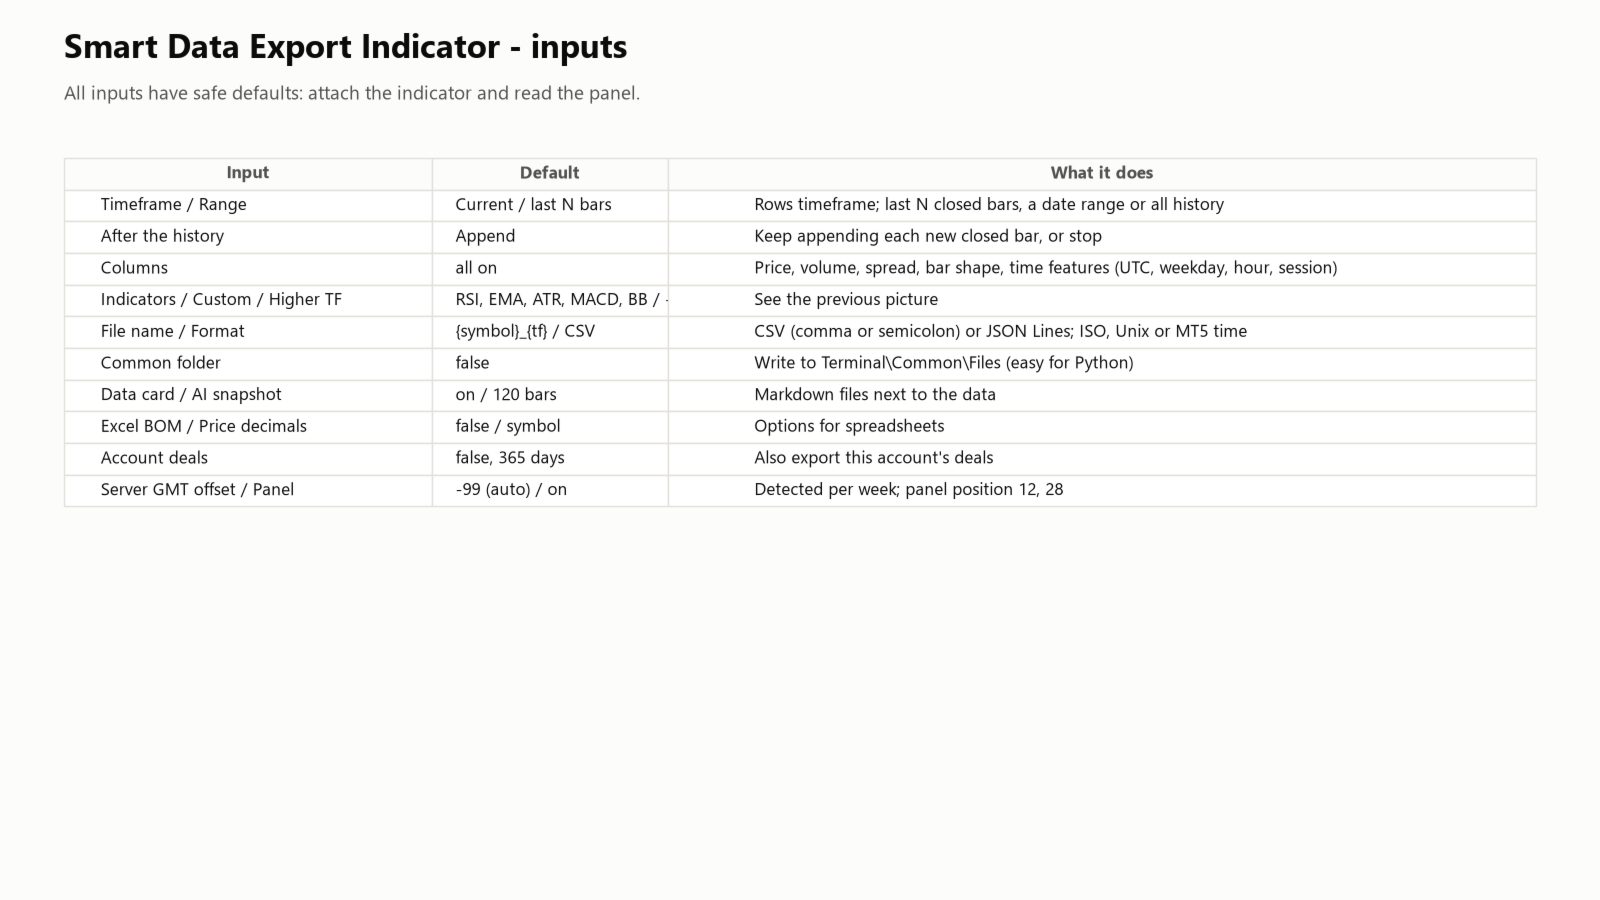
- Timeframe, range (last N bars, a date range or all history), what to do after the history (keep appending or stop).
- Columns: price, volume, spread, bar shape, time features; indicators; custom indicators; higher timeframes.
- File name ({symbol}, {tf}, {date}), format (CSV, CSV with semicolon, JSON Lines), time format (ISO 8601, Unix, MT5), common folder, data card, AI snapshot rows, UTF-8 BOM for Excel, price decimals.
- Account deals (off) for the last N days, server GMT offset (-99 = automatic), panel.
Support
If anything is unclear, please send me a private message on MQL5.