Fabii Memory Baseline
- 지표
-
Fabien Georges Andre Guillemaud
 저는 MetaTrader 5용 맞춤형 지표와 트레이딩 도구를 개발합니다.
저 역시 트레이더입니다. 수년 동안 저만의 시스템 트레이딩 전략을 구축하고 개선해 왔습니다. 지표를 처음부터 설계하고, 다양한 조합을 테스트하며, 리스크 관리 매개변수를 최적화하고, 실제 시장 환경에서 코드를 디버깅해 왔습니다. 이러한 실전 경험 덕분에 고객이 설명을 끝내기 전에도 무엇이 필요한지 정확히 이해할 수 있습니다.
개발 가능한 항목:
맞춤형 지표 — 오실레이터, 오버레이, 멀티 타임프레임 버전
MT4 → MT5 변환 - 버전: 1.32
- 업데이트됨: 6 10월 2026
- 활성화: 20
한 차트에서 현재 추세와 상위 타임프레임 추세를 함께 읽으세요. 선은 자신의 수준을 유지합니다. No repaint.
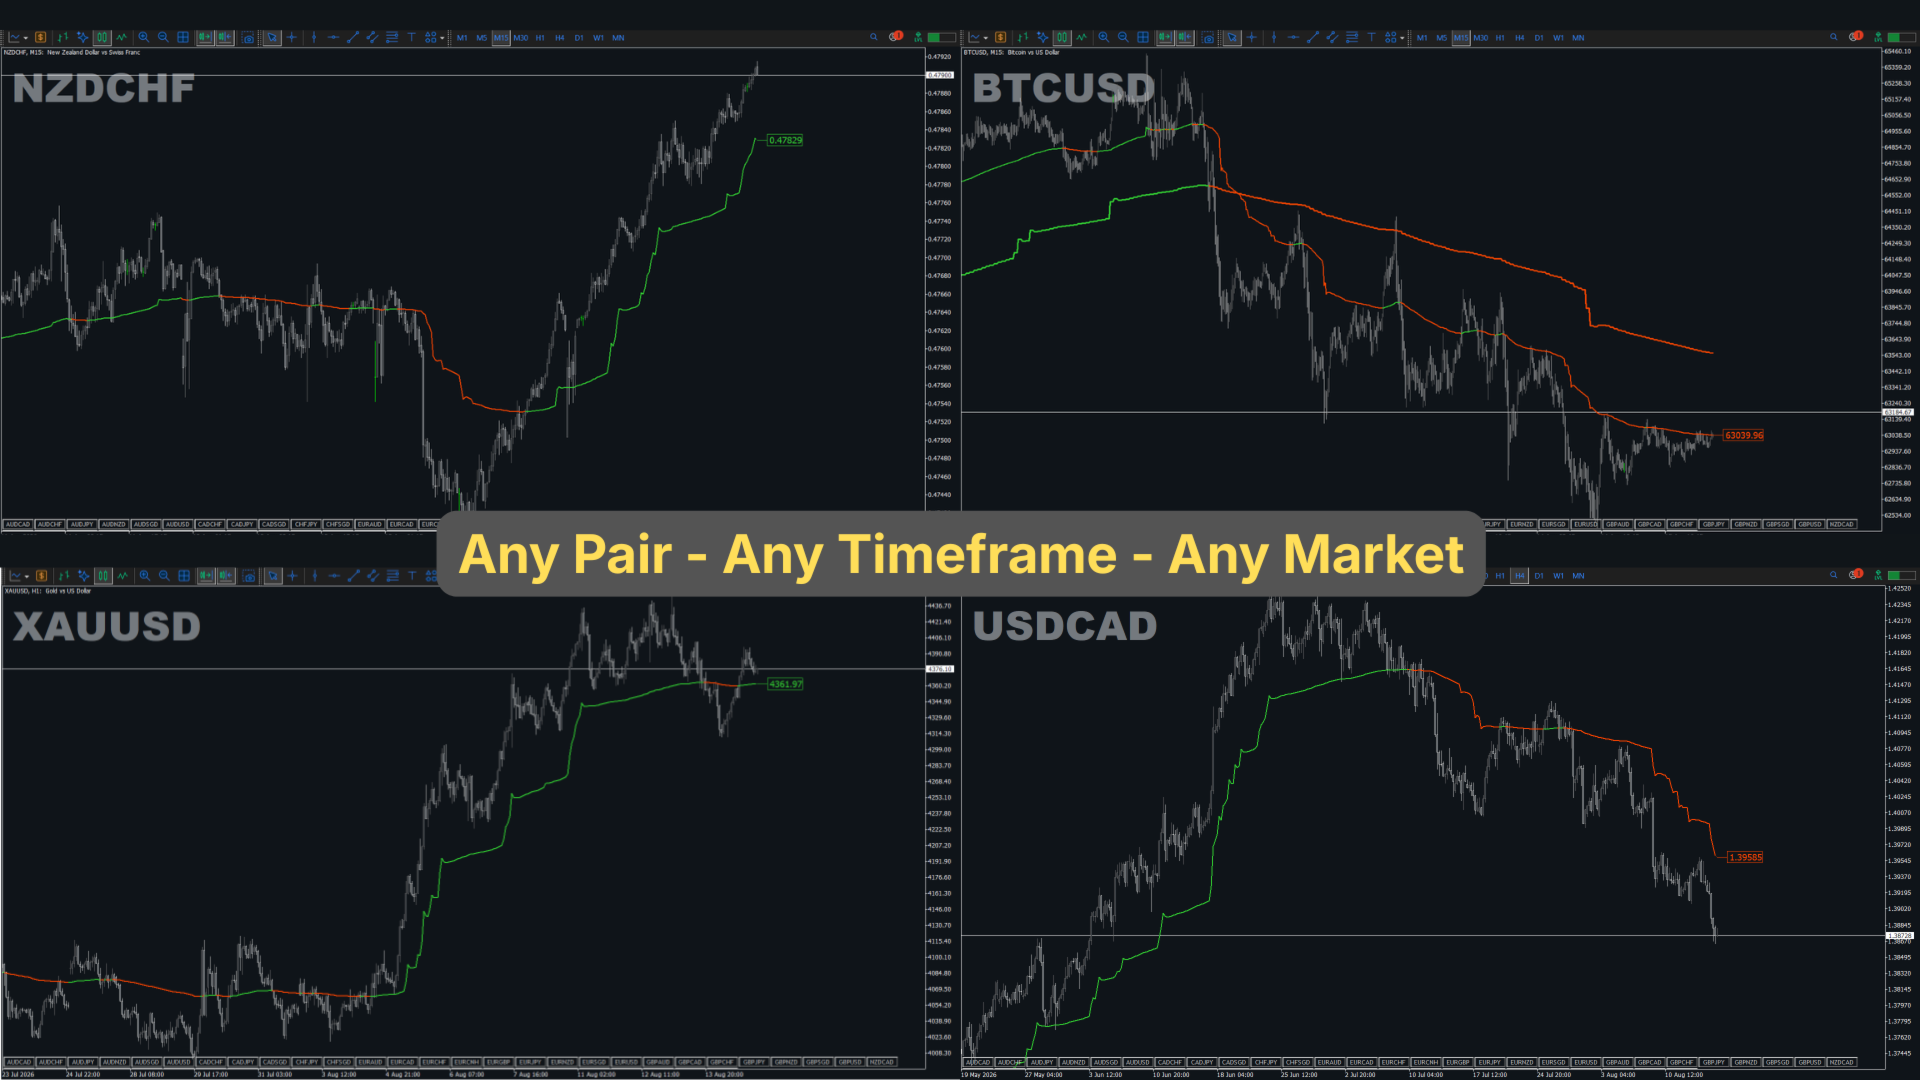
모든 통화쌍, 모든 타임프레임. 2분 안에 차트에 적용됩니다. Strategy Tester에서 무료 데모를 사용할 수 있습니다.
Get more indicators here
Baselines, volatility filters and oscillators. No repaint.
필요한 이유
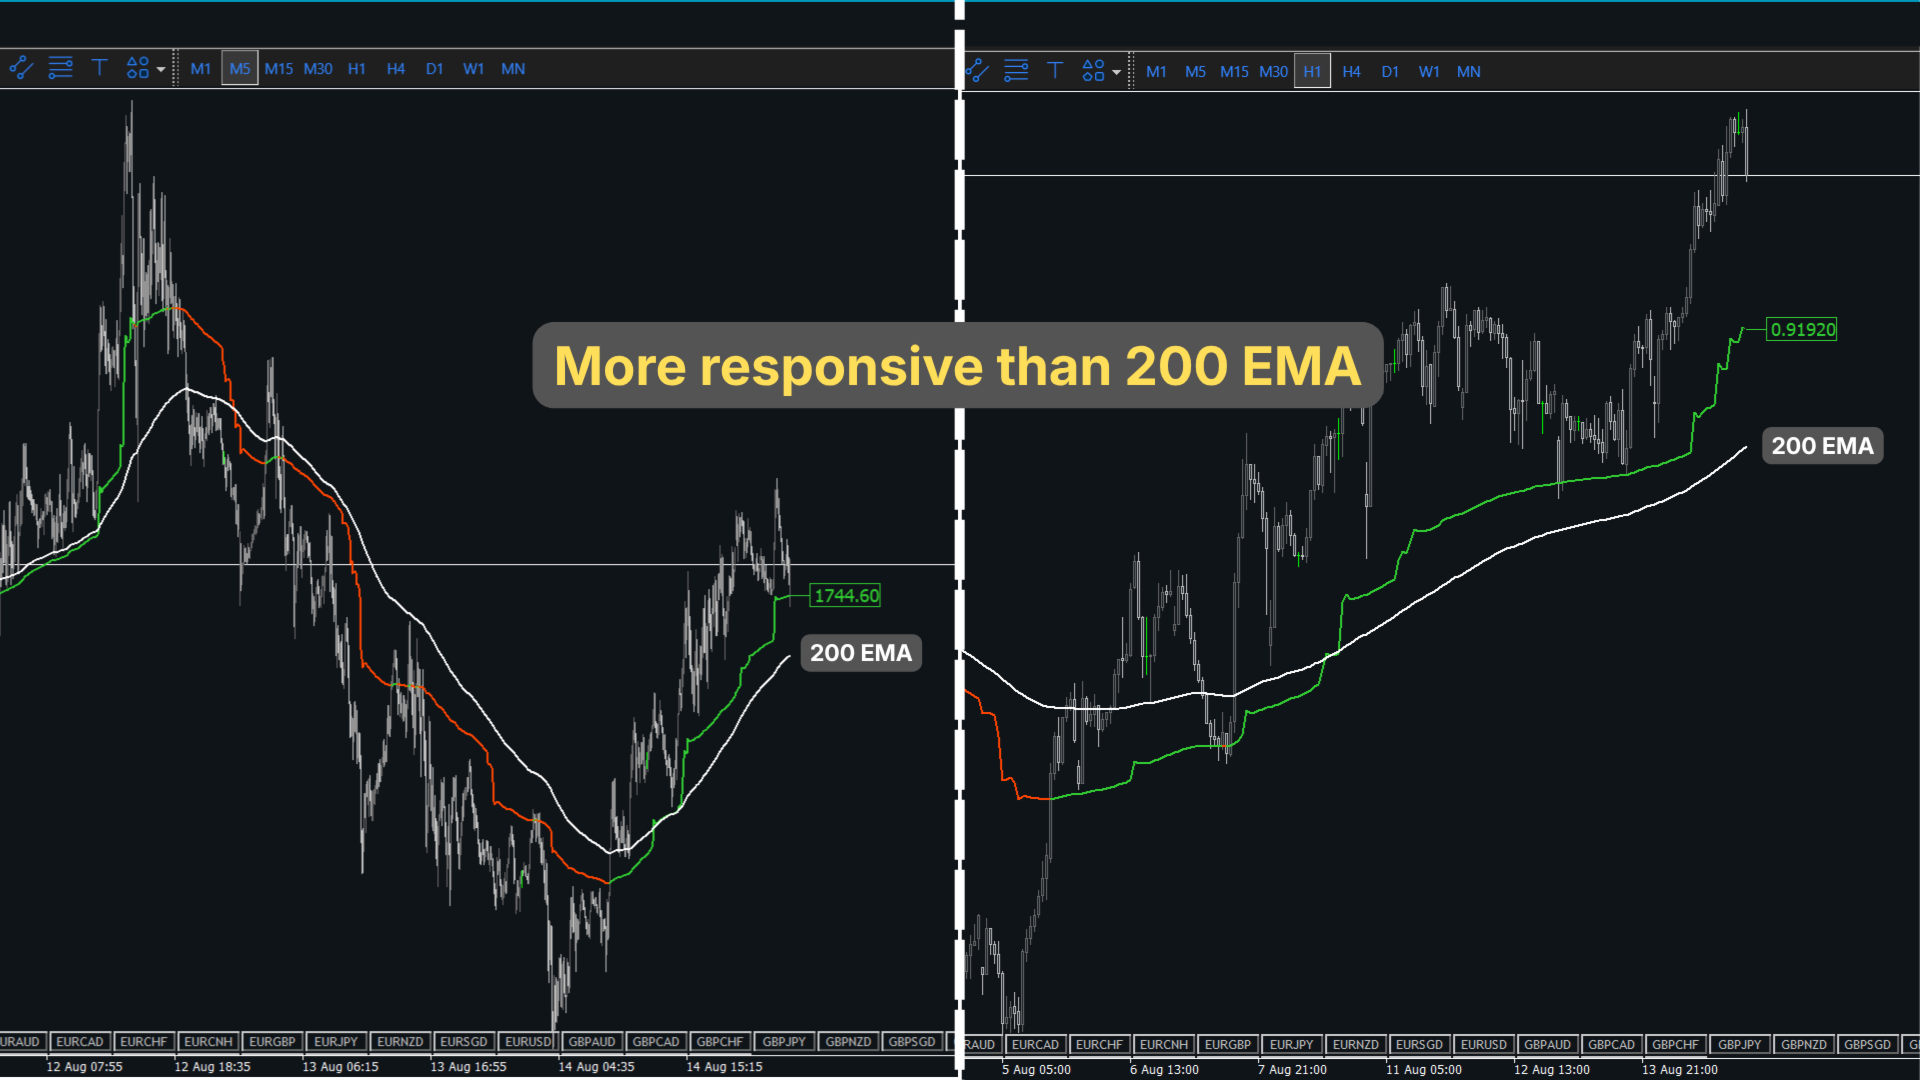
일반 이동평균선은 가격보다 늦습니다. 강한 움직임 뒤에는 선이 가격에서 멀리 떨어져 있습니다. 상위 타임프레임을 보려면 차트를 바꿔야 합니다.
가격이 이미 몇 개의 봉 전에 떠난 수준을 보고 거래하게 됩니다.
얻을 수 있는 것
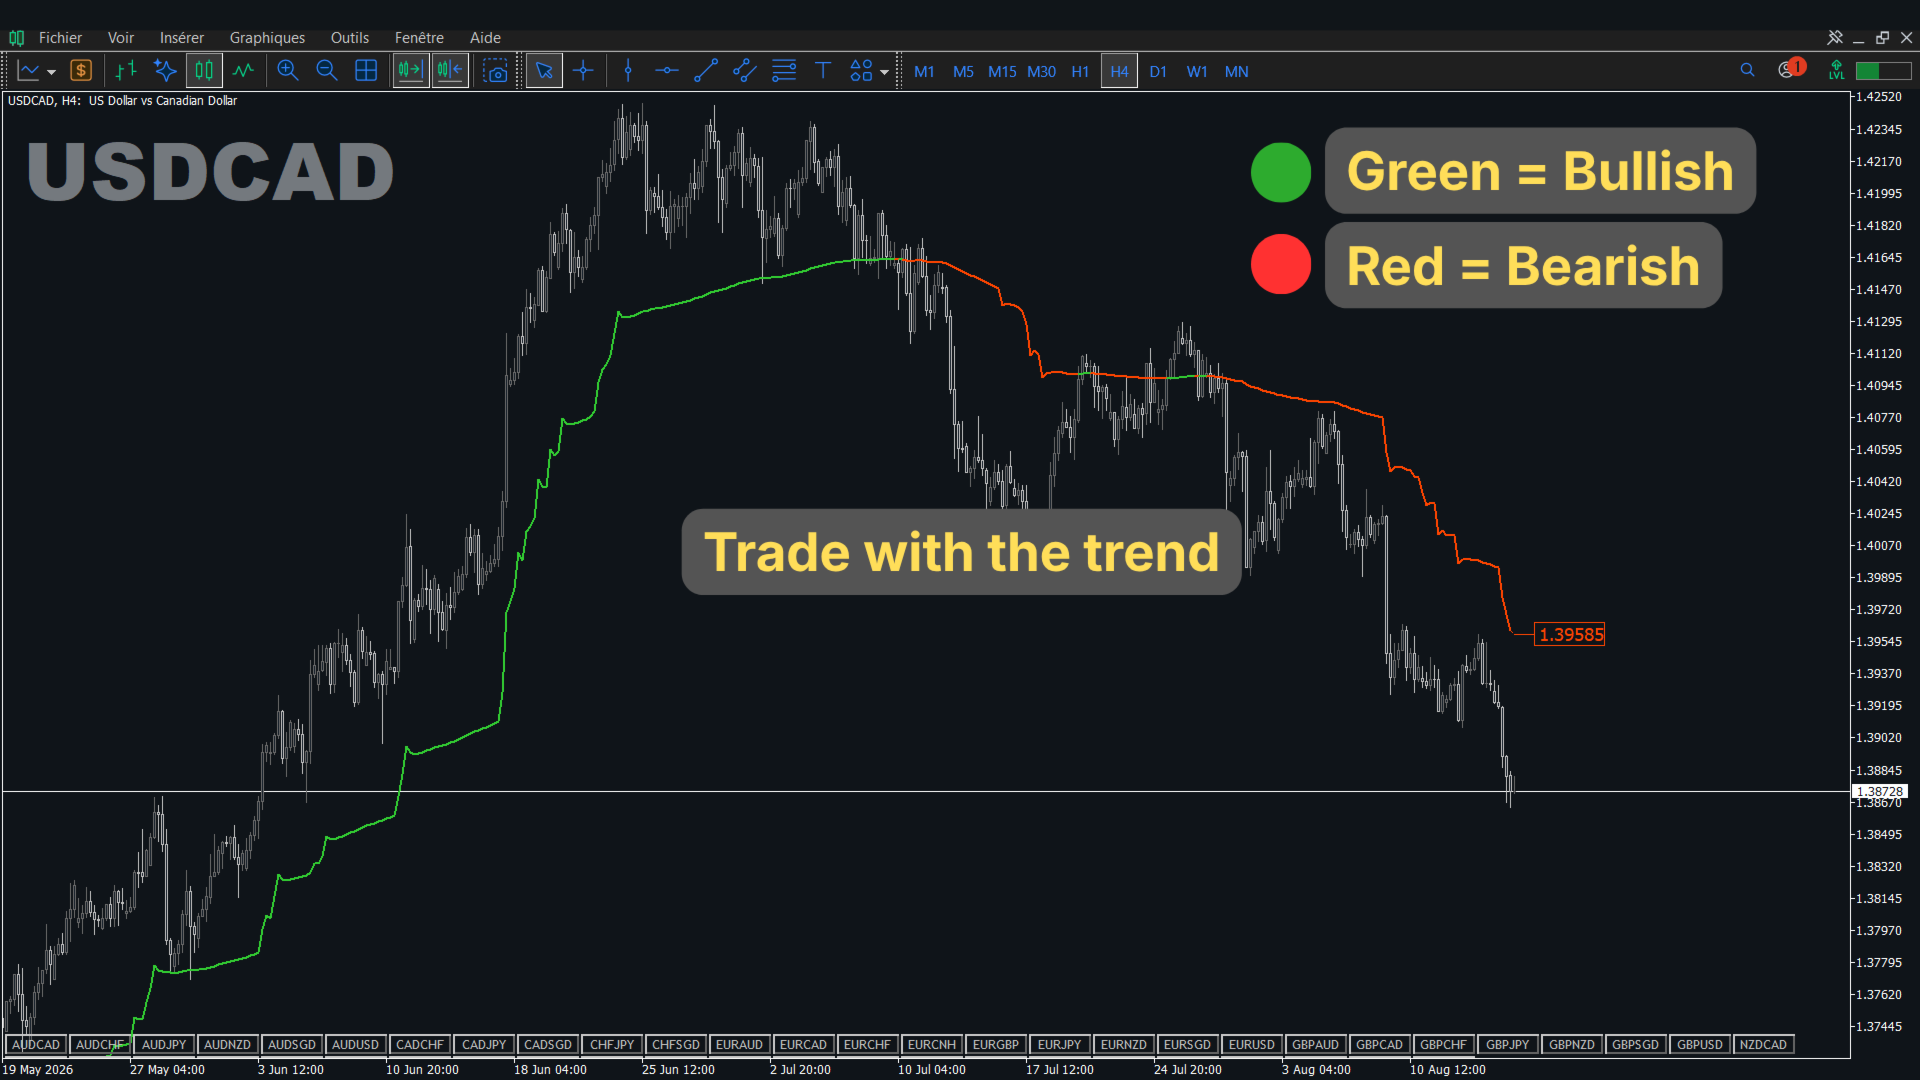
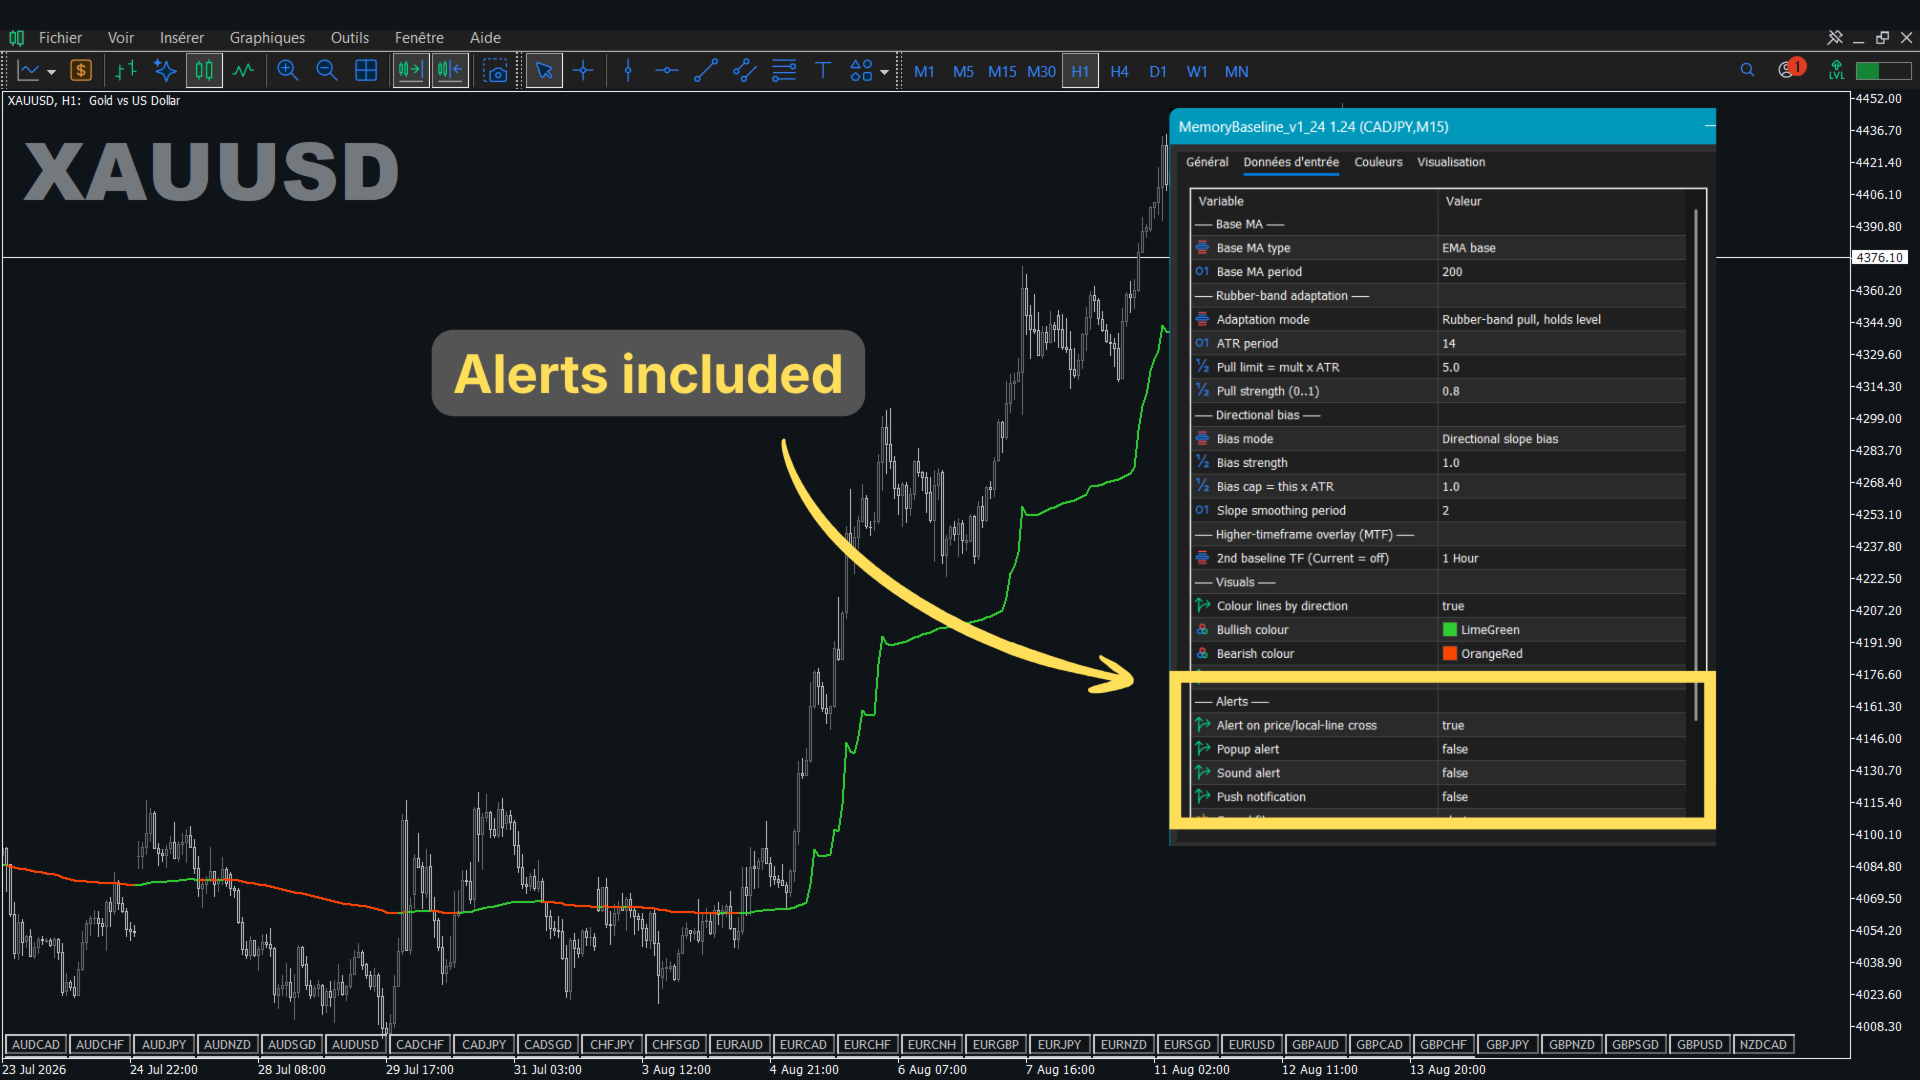
Fabii Memory Baseline은 이동평균선입니다. 강한 움직임에서는 가격을 따라가고 도달한 수준을 유지하므로, 한 개의 선으로 추세와 거리를 읽을 수 있습니다.
- 움직임이 크게 늘어나면 가격에 가까워지고 도달한 수준을 유지하므로, 쓸 수 있는 기준이 남습니다.
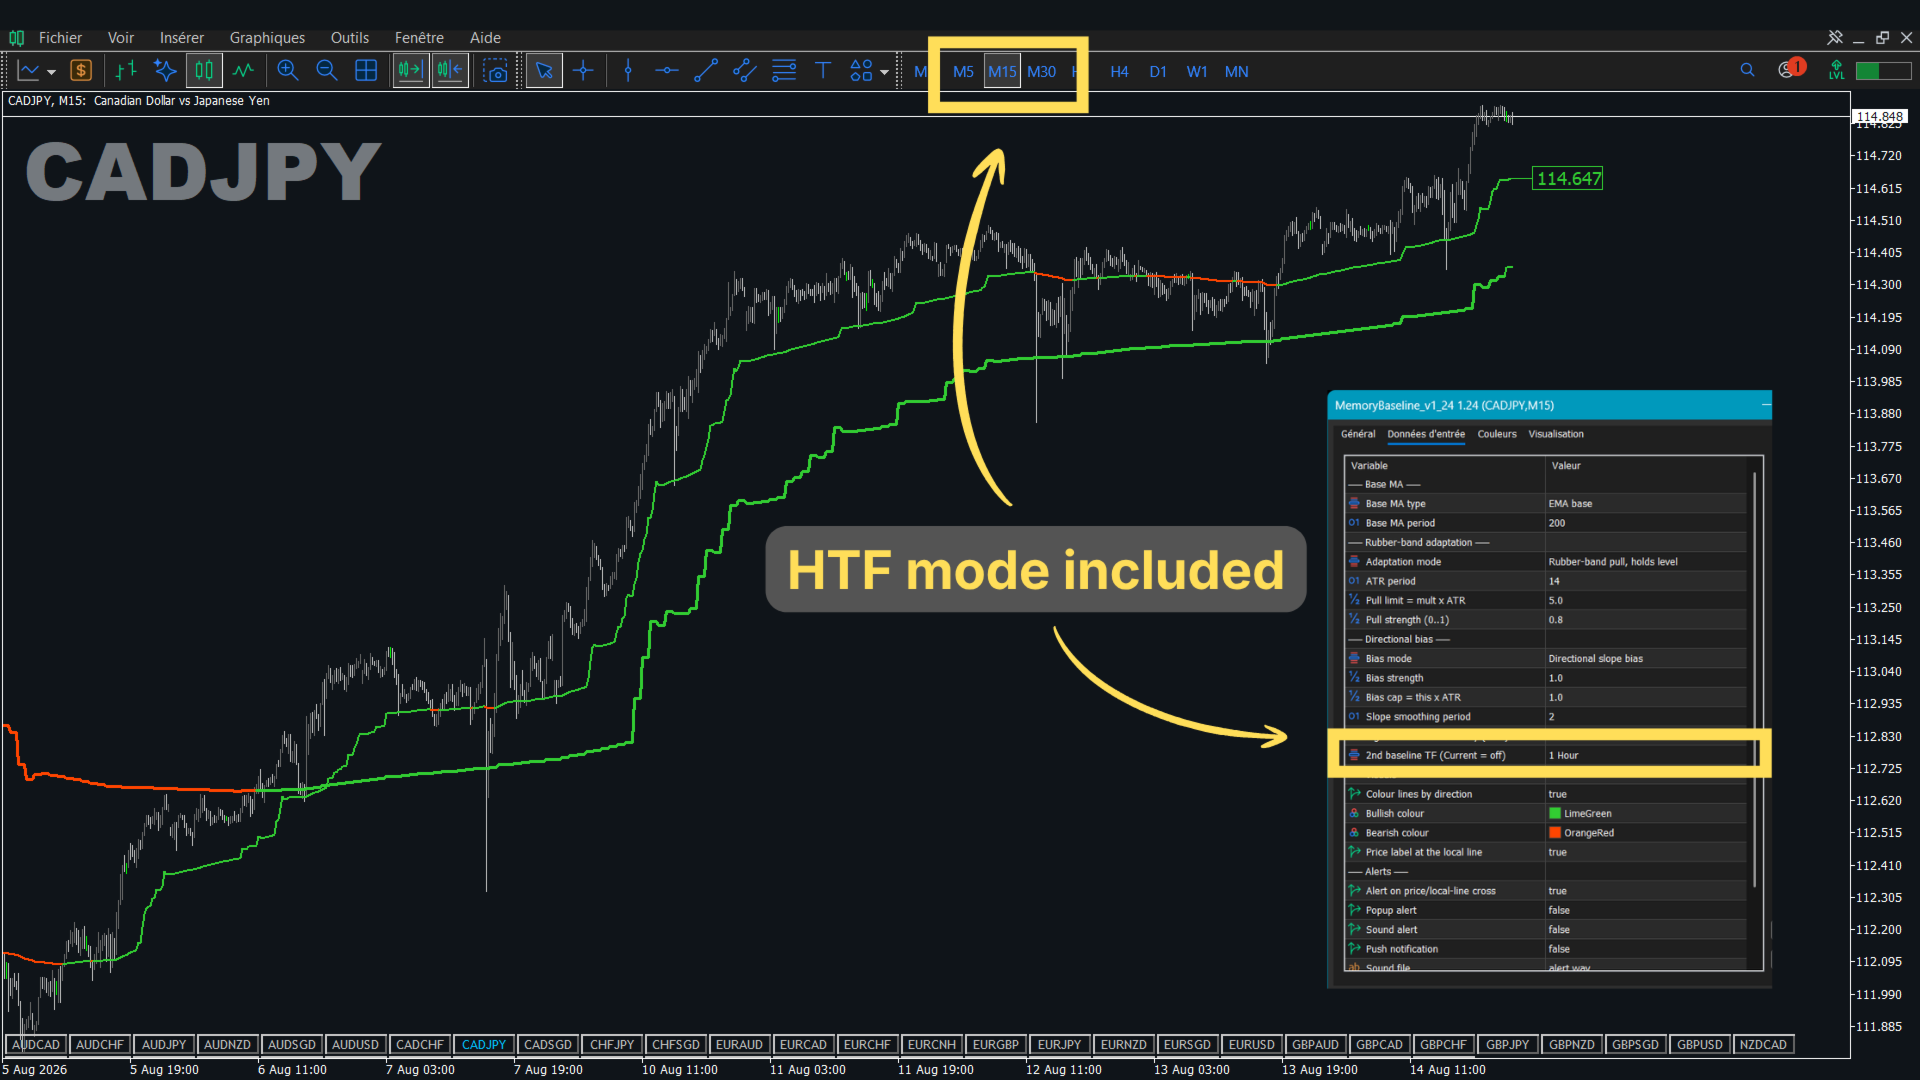
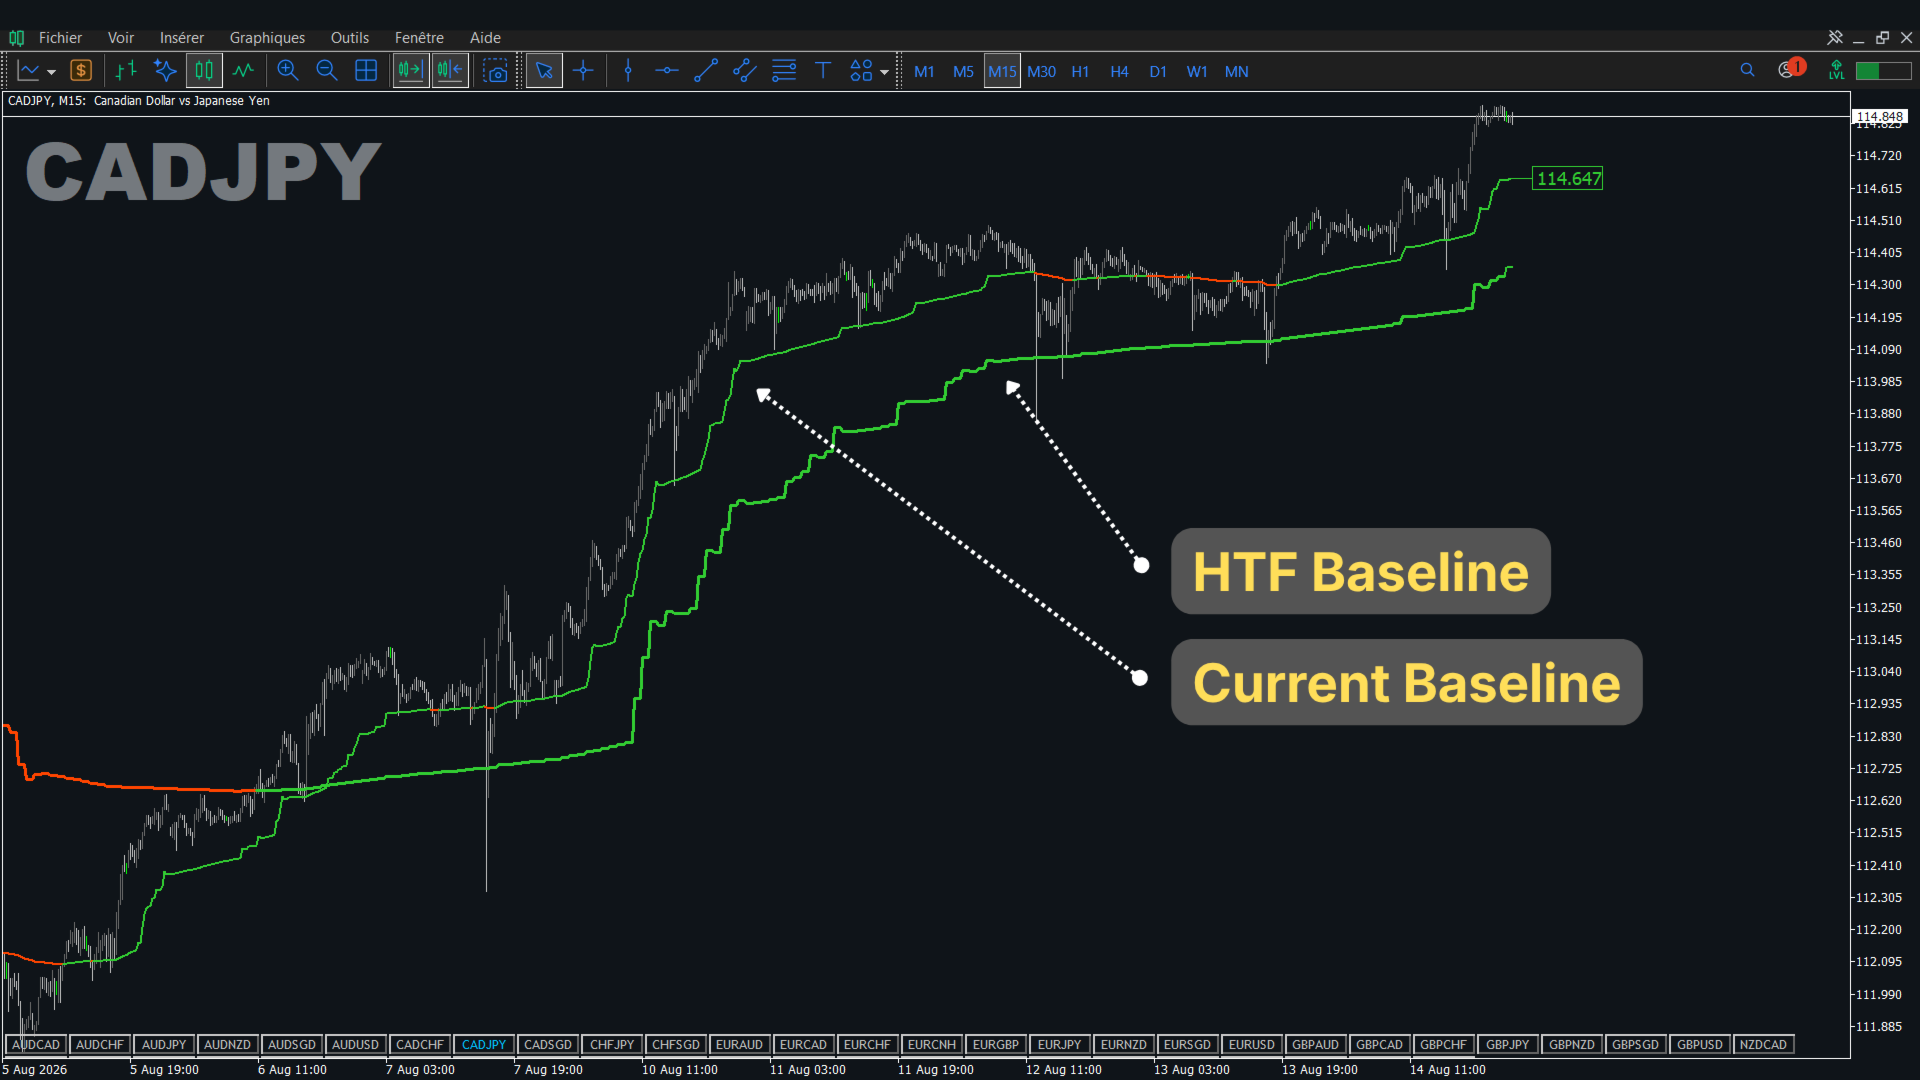
- 같은 차트에 상위 타임프레임의 두 번째 선을 표시하므로, 차트를 바꾸지 않고 큰 추세를 볼 수 있습니다.
- 두 선 모두 상승은 녹색, 하락은 빨간색이므로, 방향을 한눈에 읽을 수 있습니다.
- 로컬 선의 방향에 따라 캔들 색을 지정할 수 있으므로(선택), 가격 위에서 방향을 볼 수 있습니다.
- 가격 교차, 색 변화, 두 선의 일치를 알림으로 받으므로, 차트를 계속 볼 필요가 없습니다.
- 선의 현재 수준에 가격 라벨을 표시하므로, 값을 빠르게 읽을 수 있습니다.
작동 방식
선은 이동평균에서 시작합니다. 지수이동평균(EMA) 또는 단순이동평균(SMA)을 선택할 수 있습니다. Average True Range (ATR)는 가격의 일반적인 움직임 크기를 측정합니다. 가격이 평균에서 너무 멀어지면 선이 가격 쪽으로 당겨집니다. 새 봉은 이 값에서 시작하므로 선이 수준을 유지합니다. 선의 기울기로 방향 편향이 더해지며, ATR의 배수로 제한됩니다. 값은 마감된 봉으로 계산합니다. 현재 봉은 마감될 때까지 점선으로 표시됩니다. 두 번째 선은 선택한 상위 타임프레임에서 같은 계산을 사용합니다.
사용 방법
- 인디케이터를 아무 차트에나 적용합니다.
- 두 번째 선의 타임프레임을 차트보다 높게 선택합니다. 예를 들어 M15 차트에서는 H4입니다.
- 두 선의 색이 같을 때 그 방향의 진입을 찾습니다.
- 원하면 캔들 색 지정을 켭니다.
- 팝업, 소리 또는 푸시 알림을 켜서 알림을 받습니다.
주요 설정
| Setting | What it does | Default |
|---|---|---|
| Base MA type | Starting average, EMA or SMA | EMA base |
| Base MA period | Length of the starting average | 200 |
| Pull limit = mult x ATR | Distance from price, in ATR, beyond which the line is pulled toward price | 5.0 |
| Pull strength (0..1) | Share of the extra distance that the line recovers | 0.8 |
| Bias strength, Bias cap = this x ATR | Weight of the directional bias and its largest size, in ATR | 1.0, 1.0 |
| 2nd baseline TF (Current = off) | Higher timeframe of the second baseline | Current (off) |
| Colour candles by local direction | Colours the candles with the direction of the local line | false |
| Alerts | Price cross, colour change and alignment alerts; popup, sound and push delivery | Events on; popup, sound, push off |
다른 설정으로 색, 가격 라벨, 소리 파일, 계산할 봉의 수를 조정할 수 있습니다.
결정하기 전에 테스트
No repaint는 직접 확인할 수 있습니다. 봉이 마감될 때까지 기다린 뒤 Data Window의 값이 바뀌지 않는지 확인하세요. 테스트 방법: Free Demo를 클릭한 다음, Strategy Tester의 시각화 모드에서 사용하는 통화쌍과 타임프레임으로 실행하세요.
업데이트는 무료이며 포함되어 있습니다. 모든 버전은 이 페이지의 "What's new" 섹션에 기록됩니다.
더 많은 인디케이터를 준비하고 있습니다. 출시 알림을 받으려면 제 프로필을 팔로우하세요.
받아서 2분 안에 차트에 적용하세요.
댓글과 리뷰
질문이 있나요? 이 페이지에 댓글을 남기거나 메시지를 보내 주세요. 24시간 안에 답변을 받습니다.
이 인디케이터가 시간을 아껴 준다면, 사용하는 통화쌍과 타임프레임을 적은 짧은 리뷰가 다른 트레이더가 찾는 데 도움이 됩니다.
과거의 결과는 미래의 결과를 예측하지 않습니다. 이 인디케이터는 재무 조언을 제공하지 않습니다.