Fabii Memory Baseline
- Indicatori
-
Fabien Georges Andre Guillemaud
 Sviluppo indicatori personalizzati e strumenti di trading per MetaTrader 5.
 - Versione: 1.32
- Aggiornato: 6 ottobre 2026
- Attivazioni: 20
Leggi il trend e quello del timeframe superiore sullo stesso grafico, con una linea che mantiene il suo livello. No repaint.
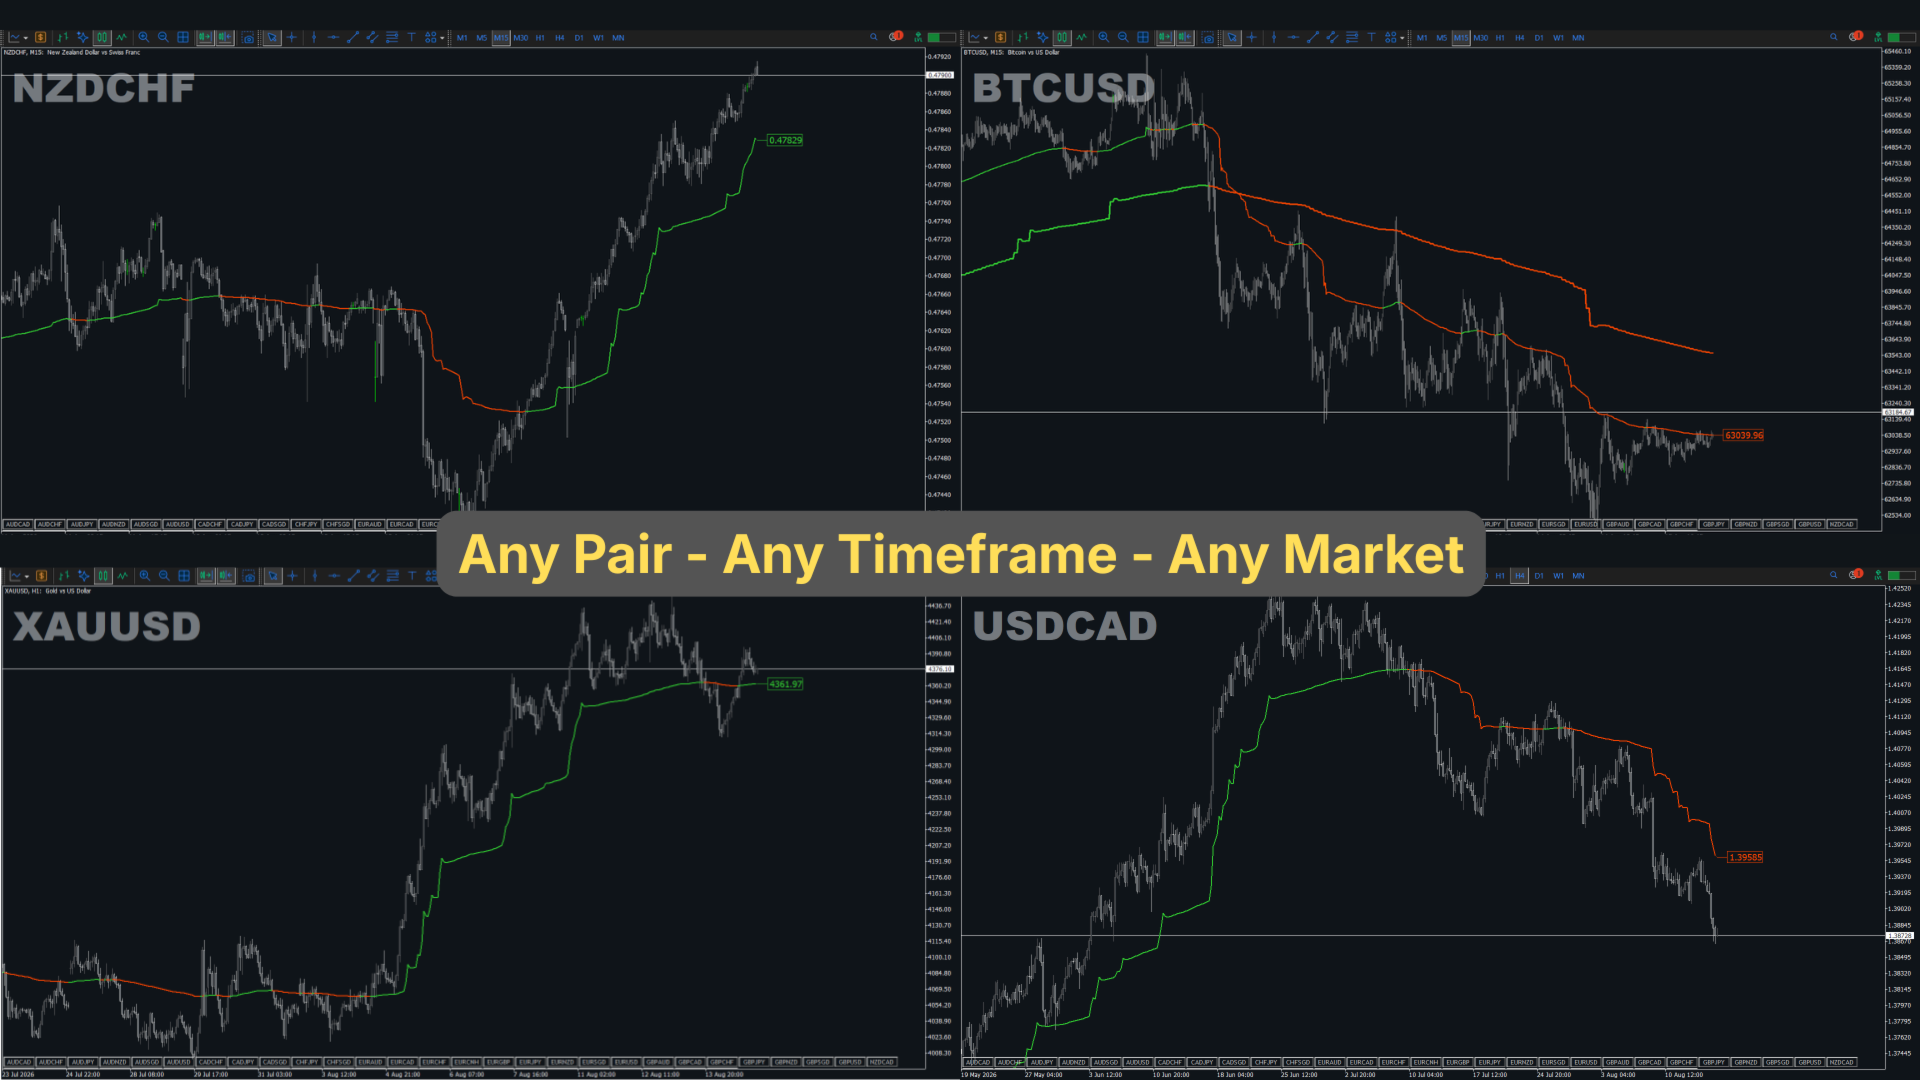
Qualsiasi coppia, qualsiasi timeframe. Sul tuo grafico in 2 minuti. Demo gratuita nello Strategy Tester.
Get more indicators here
Baselines, volatility filters and oscillators. No repaint.
Perché ti serve
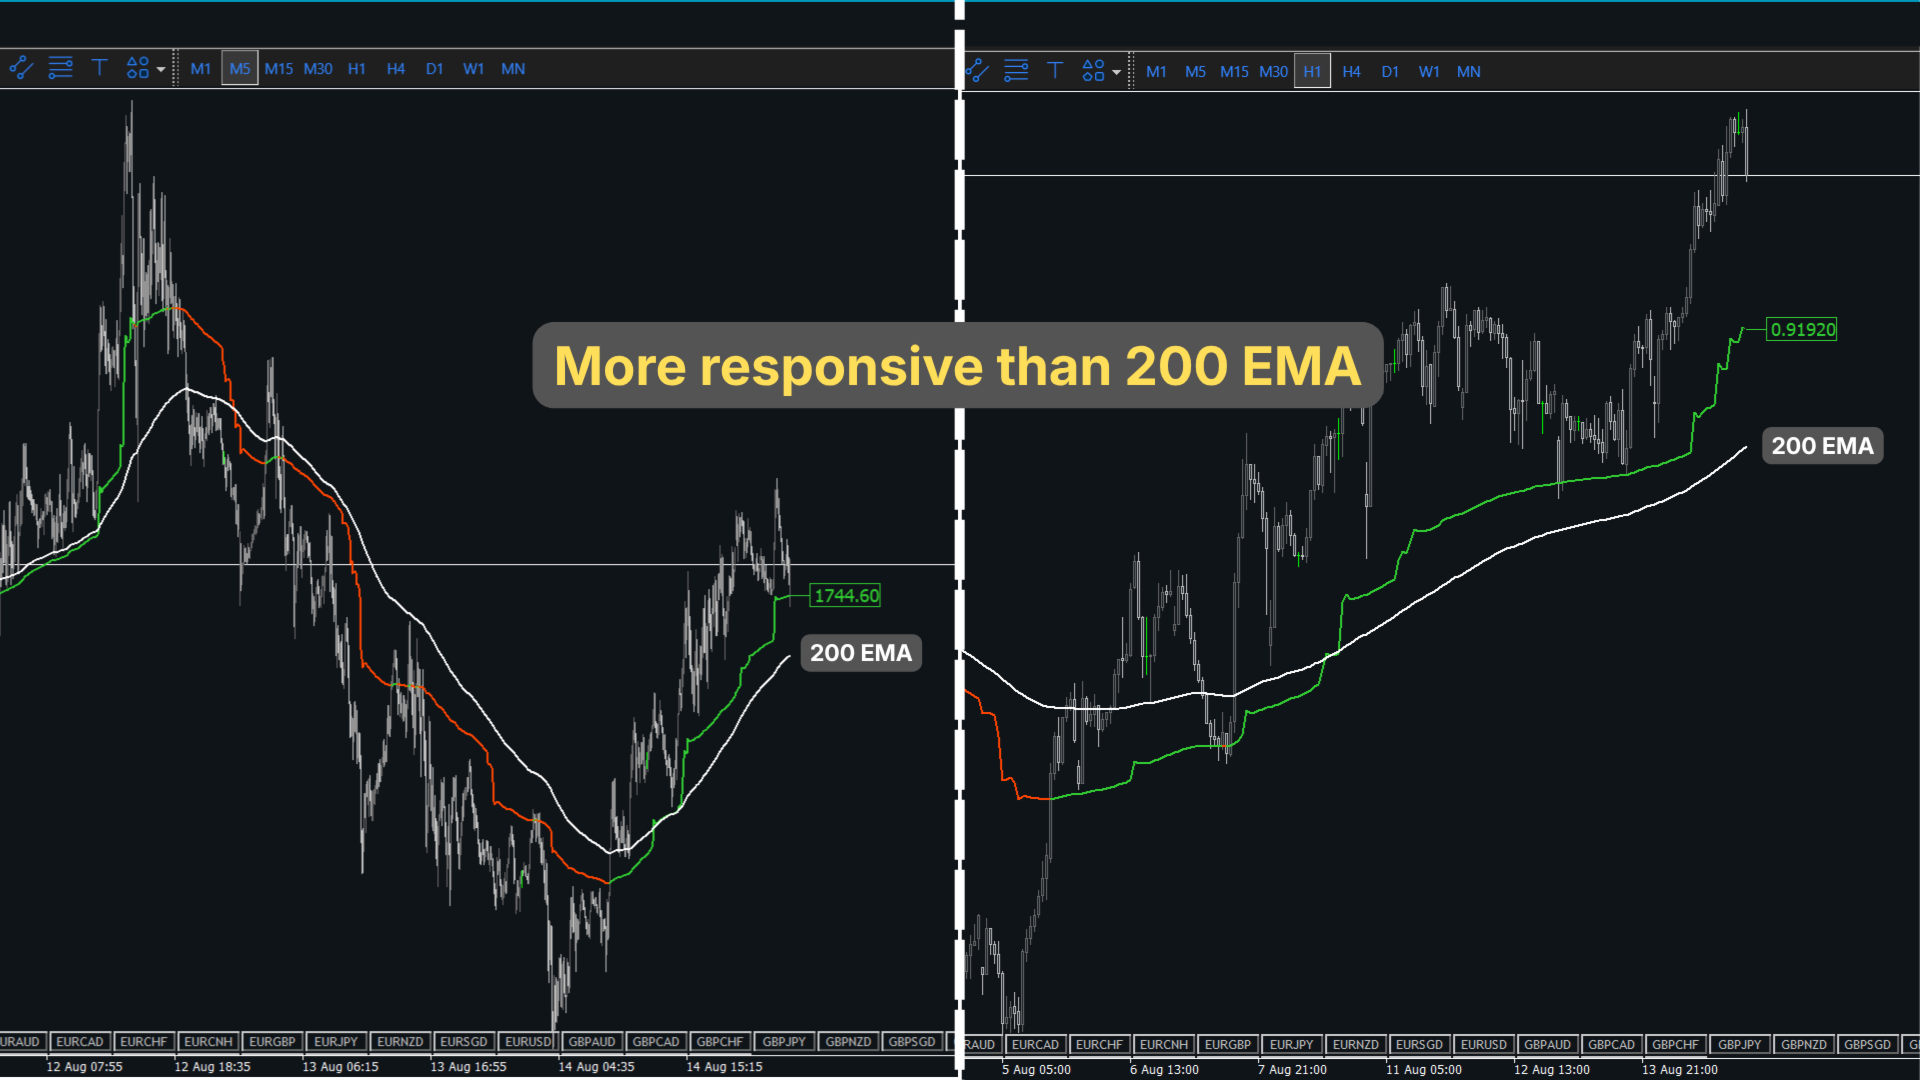
Una media mobile semplice resta indietro rispetto al prezzo. Dopo un movimento forte, la linea resta lontana dal prezzo. Per vedere il timeframe superiore devi cambiare grafico.
Operi vicino a un livello che il prezzo ha lasciato diverse candele fa.
Cosa ottieni
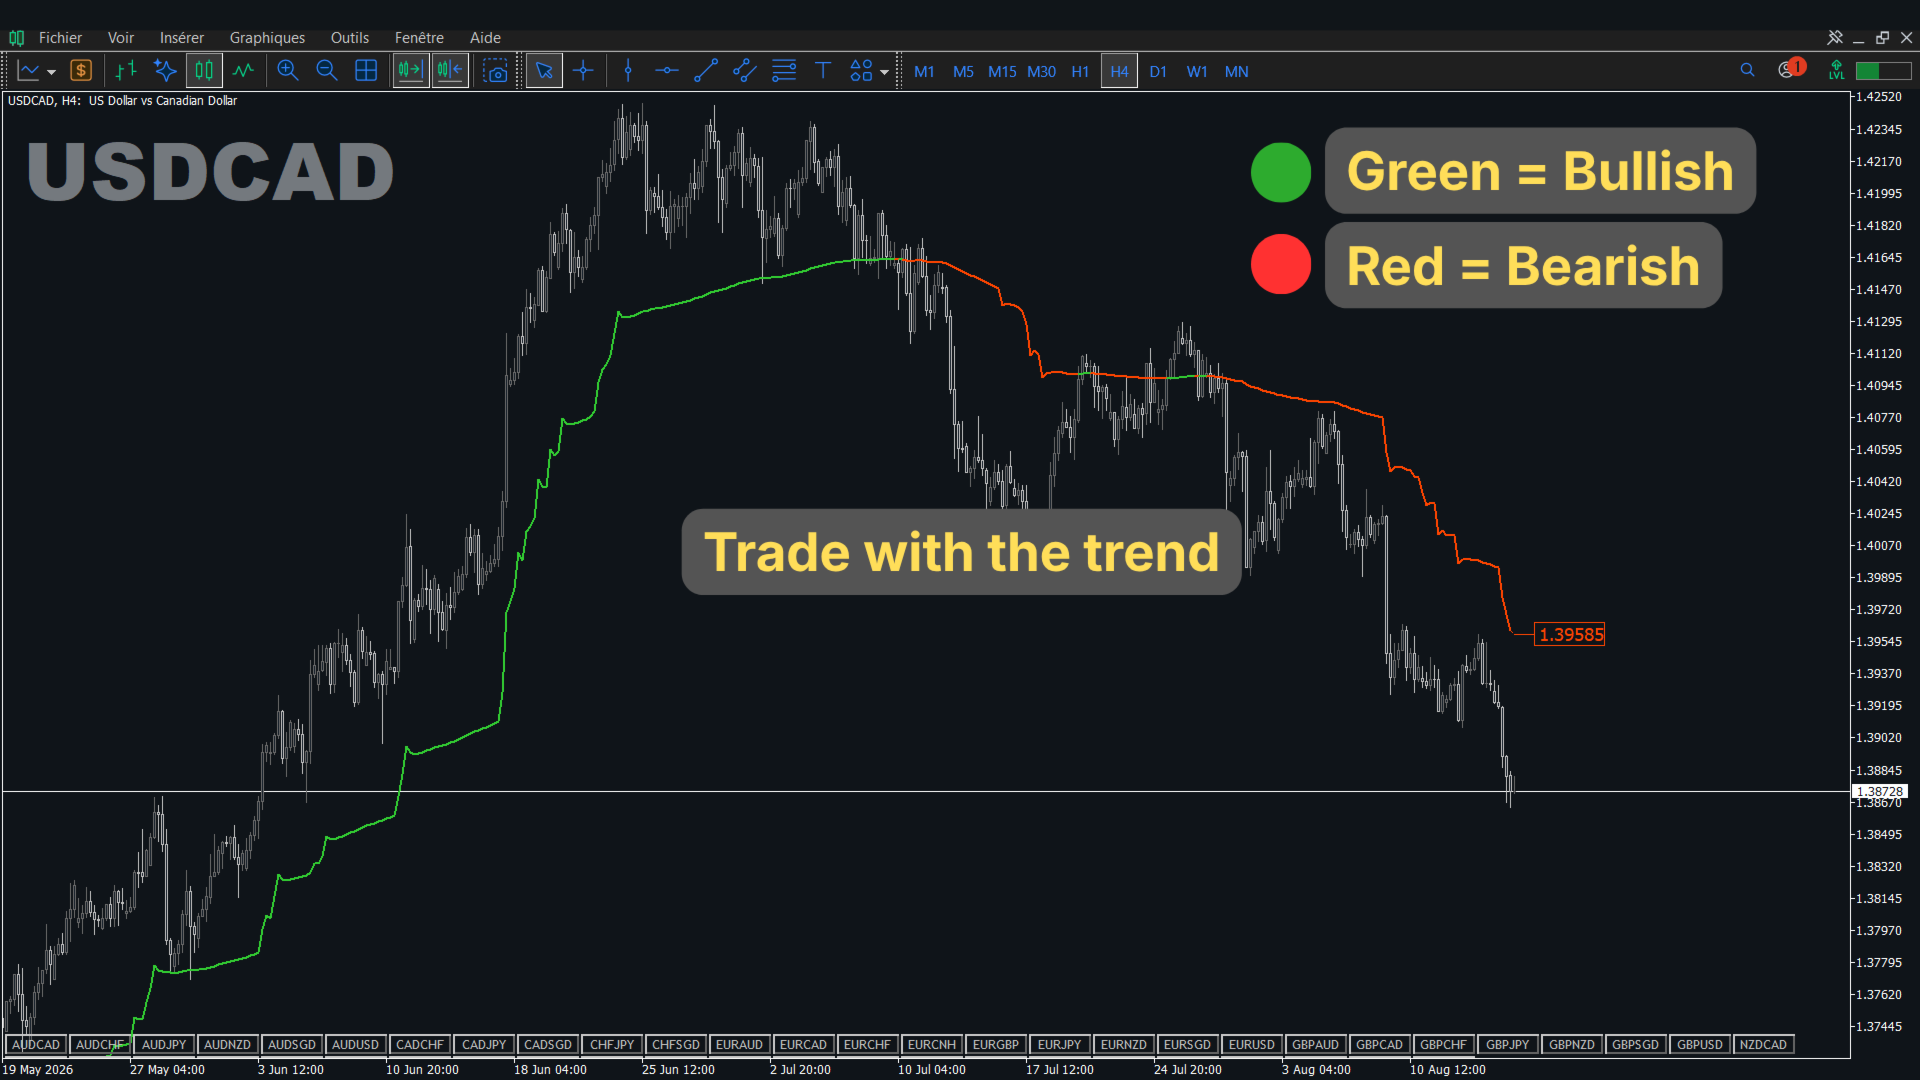
Fabii Memory Baseline è una media mobile che segue il prezzo nei movimenti forti e mantiene il livello raggiunto, così leggi trend e distanza in una sola linea.
- Una linea che si avvicina al prezzo quando il movimento si allunga e mantiene il livello raggiunto, così hai un riferimento utile.
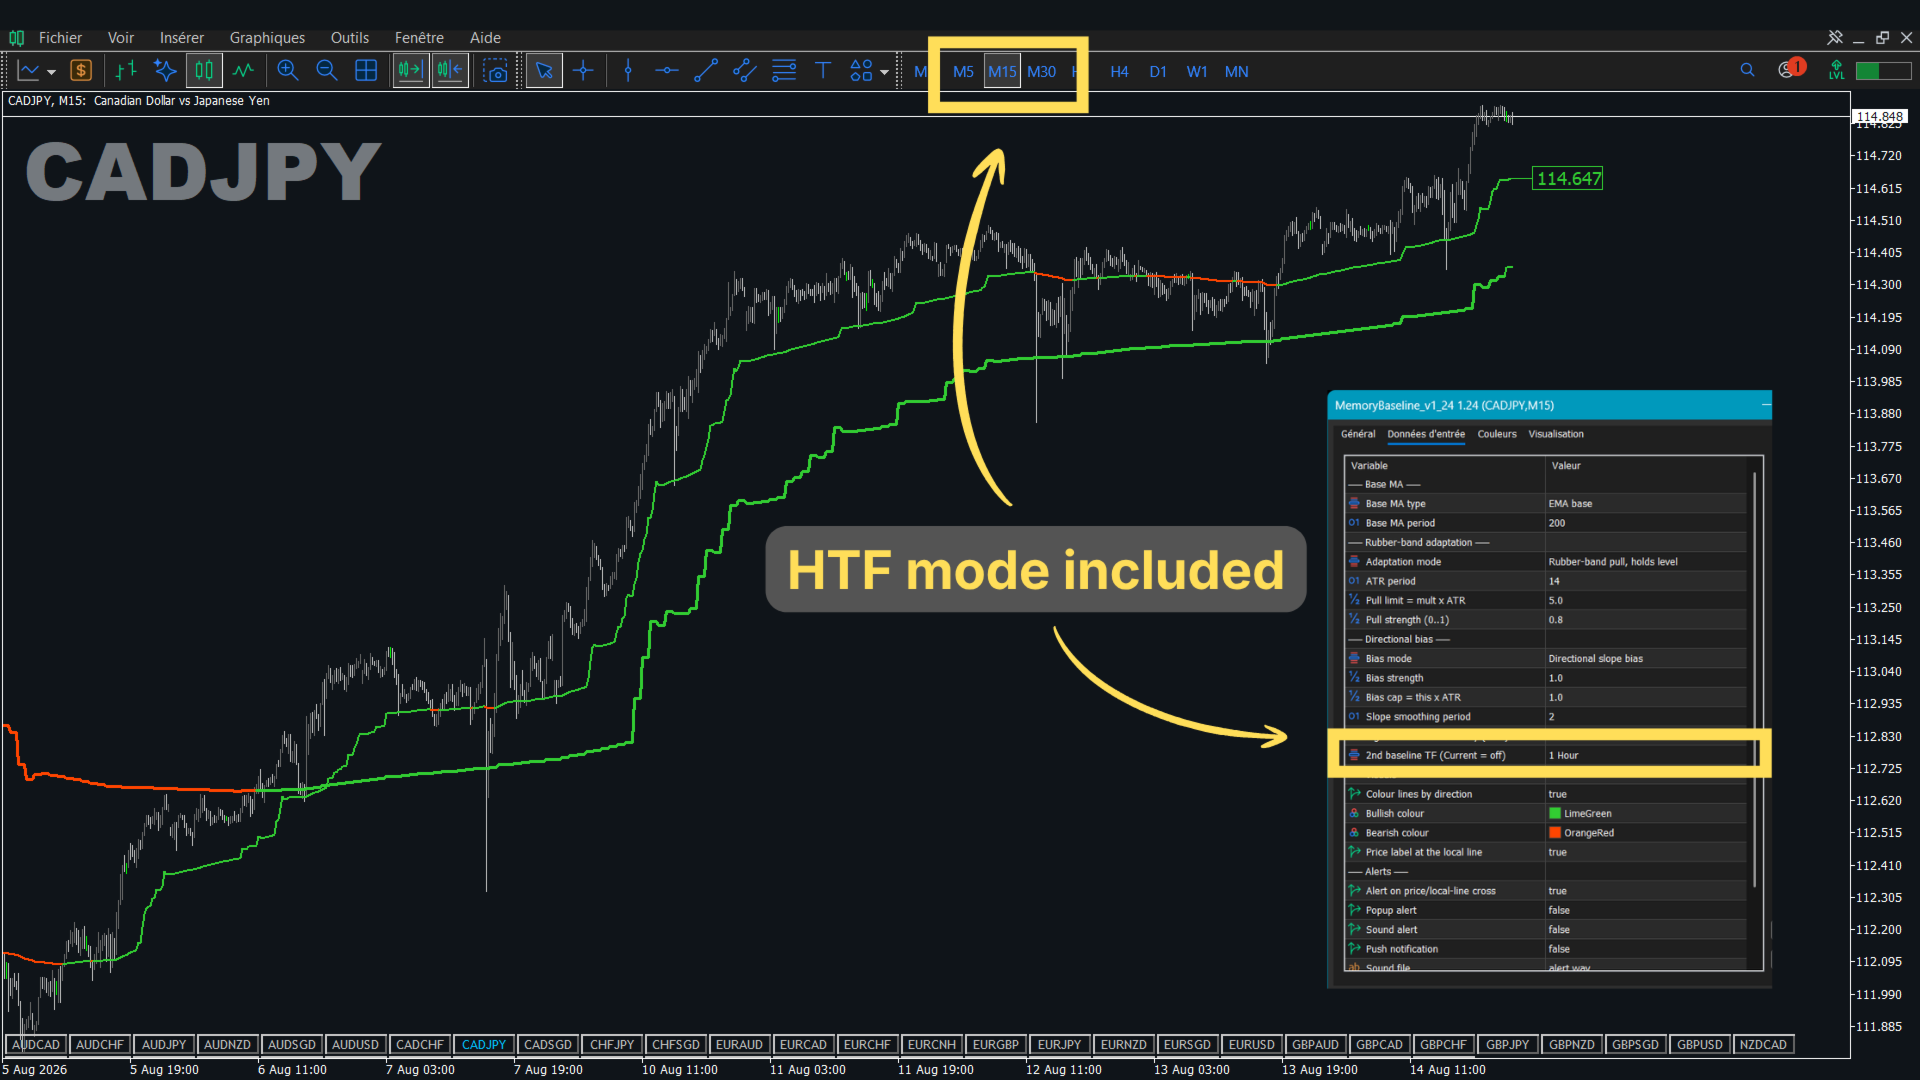
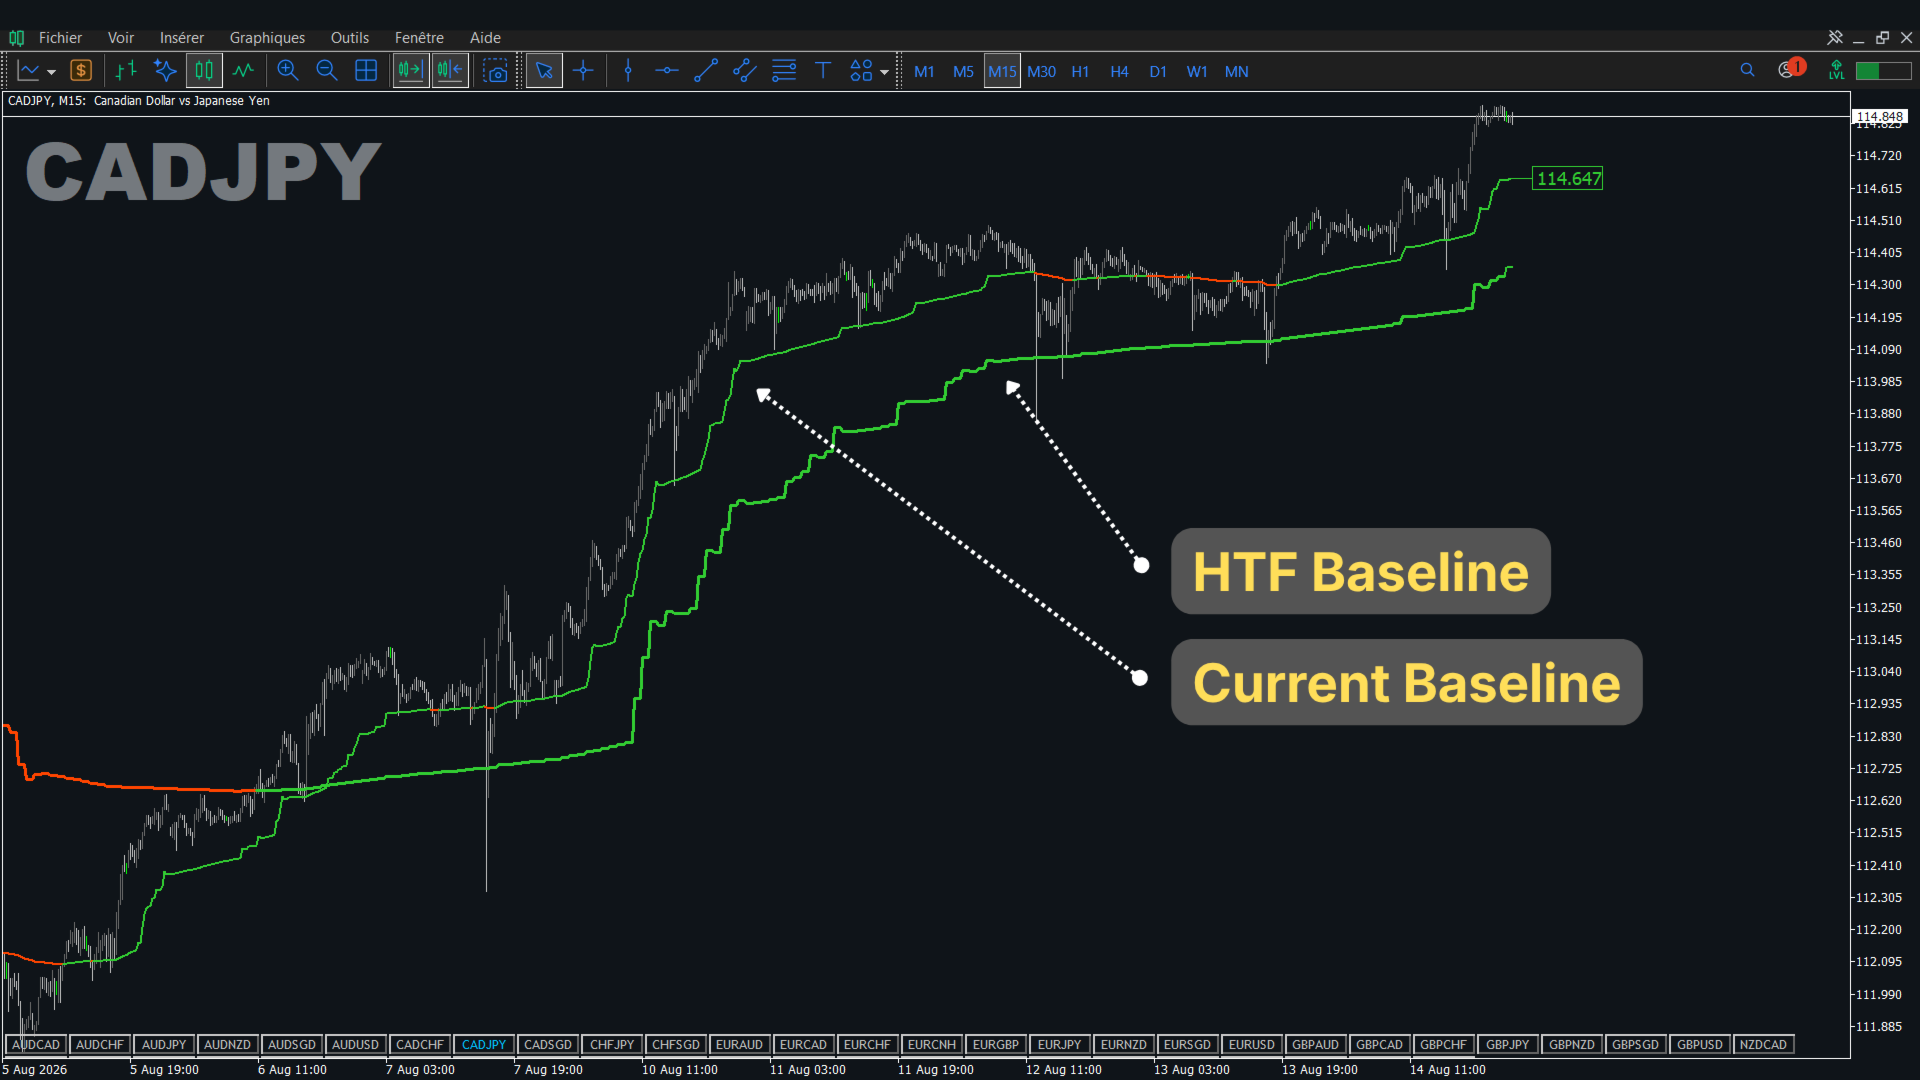
- Una seconda linea di un timeframe superiore sullo stesso grafico, così vedi il trend più ampio senza cambiare grafico.
- Verde per il rialzo e rosso per il ribasso su entrambe le linee, così leggi la direzione a colpo d'occhio.
- Colore opzionale delle candele in base alla direzione della linea locale, così vedi la direzione sul prezzo stesso.
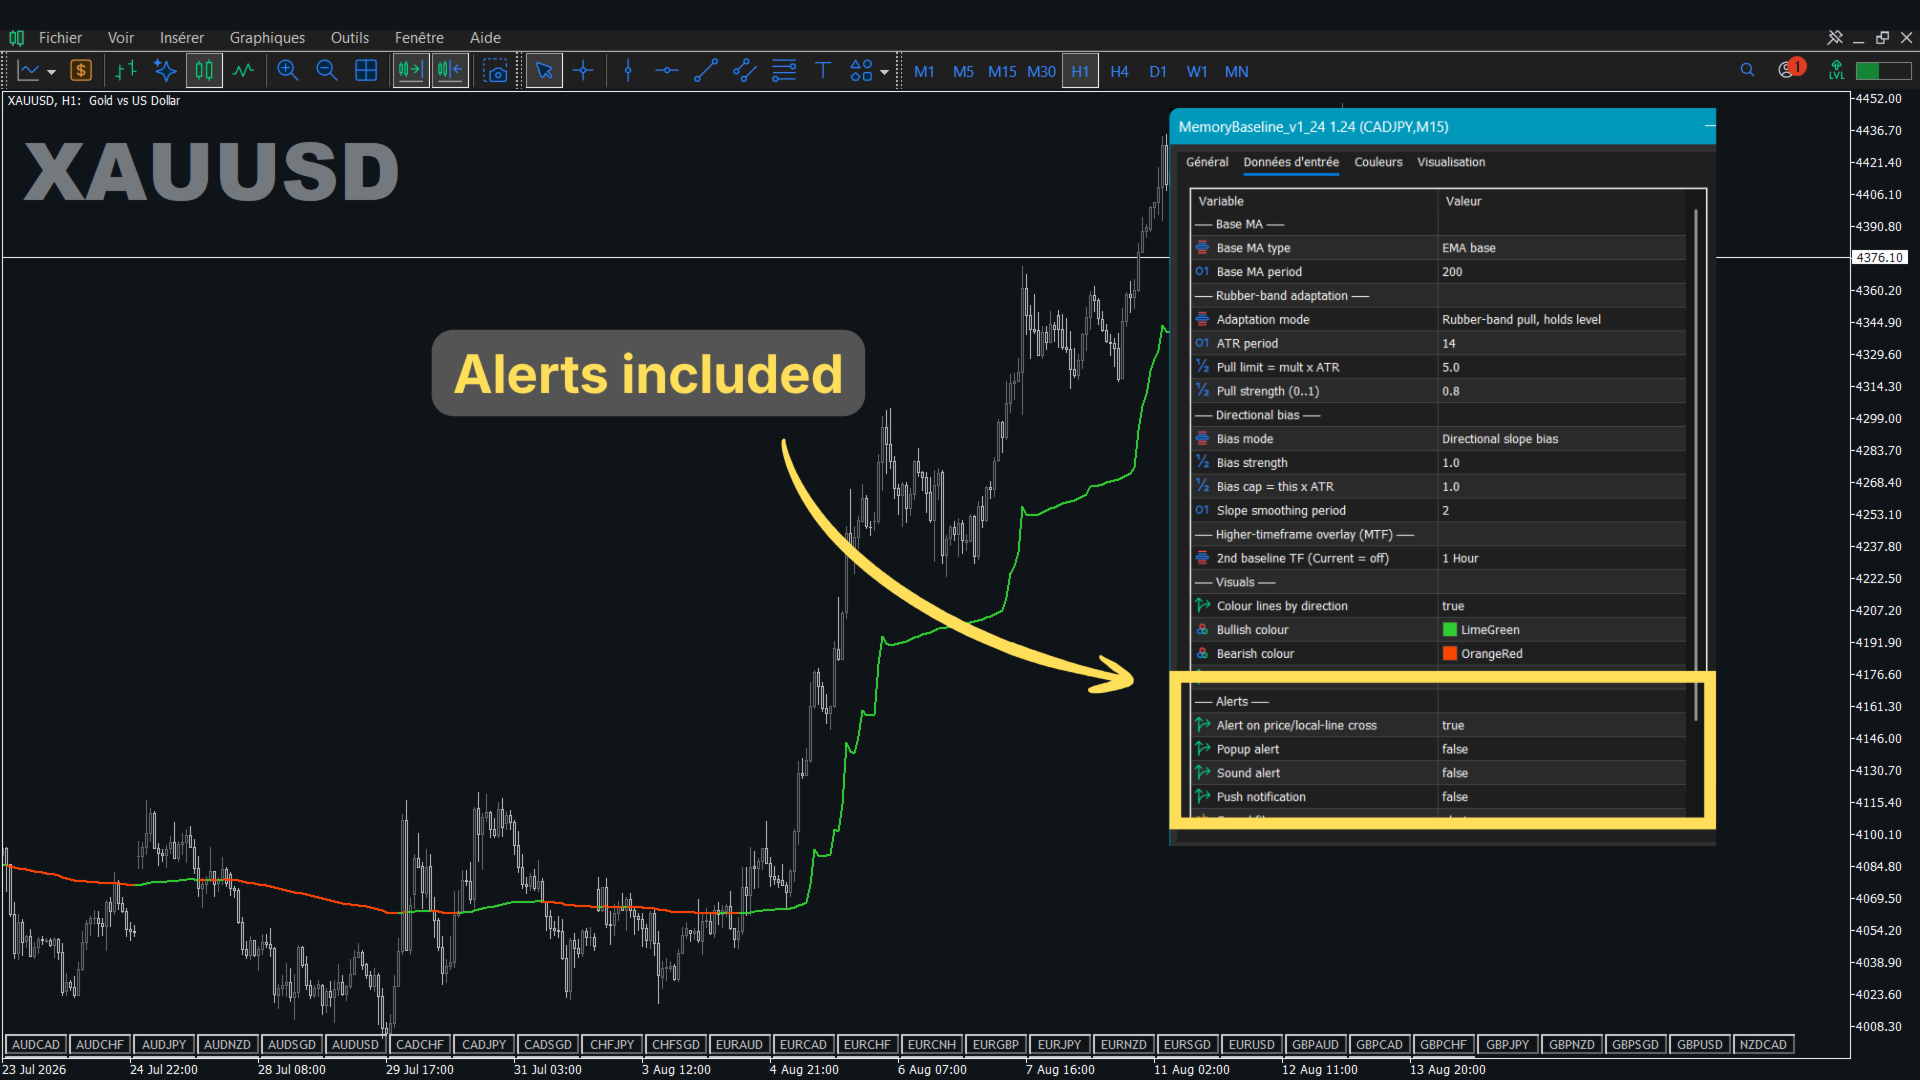
- Avvisi per l'incrocio del prezzo, il cambio di colore e l'allineamento delle due linee, così non devi guardare il grafico.
- Un'etichetta di prezzo sul livello attuale della linea, così leggi il valore rapidamente.
Come funziona
La linea parte da una media mobile: Exponential Moving Average (EMA) oppure Simple Moving Average (SMA). L'Average True Range (ATR) misura la dimensione normale del movimento del prezzo. Se il prezzo è troppo lontano dalla media, la linea viene tirata verso il prezzo. Ogni nuova candela parte da questo valore, quindi la linea mantiene il suo livello. Dalla pendenza della linea si aggiunge un orientamento direzionale, limitato a un multiplo dell'ATR. I valori usano candele chiuse. La candela attuale appare come linea punteggiata finché non chiude. La seconda linea usa lo stesso calcolo sul timeframe superiore che scegli.
Come usarlo
- Applica l'indicatore a qualsiasi grafico.
- Scegli per la seconda linea un timeframe superiore a quello del grafico, per esempio H4 su un grafico M15.
- Cerca ingressi quando le due linee hanno lo stesso colore.
- Attiva il colore delle candele, se vuoi.
- Attiva gli avvisi popup, sonori o push, per essere avvisato.
Parametri principali
| Setting | What it does | Default |
|---|---|---|
| Base MA type | Starting average, EMA or SMA | EMA base |
| Base MA period | Length of the starting average | 200 |
| Pull limit = mult x ATR | Distance from price, in ATR, beyond which the line is pulled toward price | 5.0 |
| Pull strength (0..1) | Share of the extra distance that the line recovers | 0.8 |
| Bias strength, Bias cap = this x ATR | Weight of the directional bias and its largest size, in ATR | 1.0, 1.0 |
| 2nd baseline TF (Current = off) | Higher timeframe of the second baseline | Current (off) |
| Colour candles by local direction | Colours the candles with the direction of the local line | false |
| Alerts | Price cross, colour change and alignment alerts; popup, sound and push delivery | Events on; popup, sound, push off |
Gli altri parametri controllano i colori, l'etichetta di prezzo, il file audio e il numero di candele calcolate.
Provalo prima di decidere
Puoi verificare il No repaint da solo. Aspetta che una candela chiuda e controlla che il valore nella Data Window non cambi. Per provarlo: clicca su Free Demo ed esegui l'indicatore nello Strategy Tester in modalità visuale, sulla tua coppia e sul tuo timeframe.
Gli aggiornamenti sono gratuiti e inclusi. Ogni versione è elencata nella sezione "What's new" di questa pagina.
Altri indicatori sono in preparazione. Segui il mio profilo per essere avvisato quando saranno pubblicati.
Ottienilo e avrai l'indicatore sui tuoi grafici in 2 minuti.
Commenti e recensioni
Domande? Pubblica un commento su questa pagina o scrivimi un messaggio, e ricevi una risposta entro 24 ore.
Se l'indicatore ti fa risparmiare tempo, una breve recensione con la tua coppia e il tuo timeframe aiuta altri trader a trovarlo.
I risultati passati non prevedono i risultati futuri. Questo indicatore non fornisce consulenza finanziaria.