

Complete user manual and guide: how to read order flow, footprint charts, bid/ask delta, cumulative delta (CVD), imbalances, absorption, volume profile and the TPO market profile directly in MetaTrader 5.
Look inside the candle: see real traded volume, aggressive buyers vs. sellers, imbalances, delta and institutional orderflow in real time. A standard candlestick chart only shows the result of a price move (Open, High, Low, Close). The DRX OrderFlux opens the candle and reveals the engine driving the market — the exact volume at every single price level, split into buyers and sellers.
DRX OrderFlux — Orderflow Footprint Chart
Available on the MQL5 Marketplace. For the full market overview, combine this footprint chart with the DRX Market Profile Master.
Instead of guessing why price reversed at a level, OrderFlux gives you hard data. By separating volume into Bid (aggressive sellers) and Ask (aggressive buyers), you instantly see who is in control. The result is a detailed footprint chart that highlights imbalances, volume clusters, delta and real-time orderflow — plus a full smart-analysis layer, market profile and economic calendar around it.
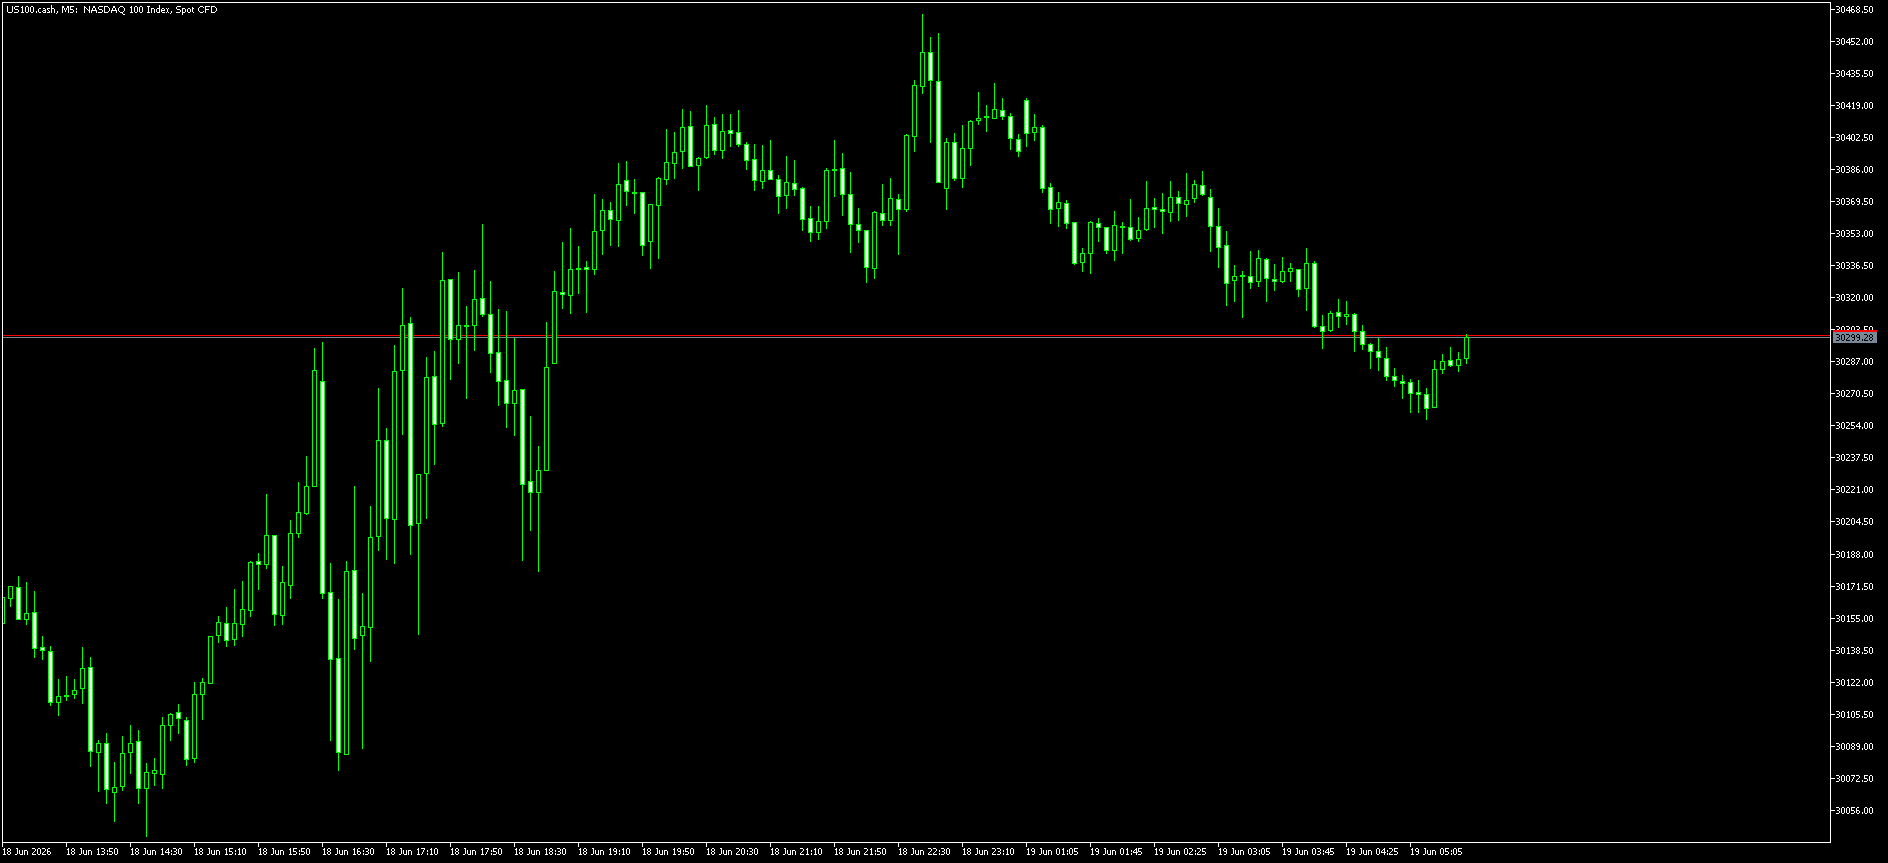
A standard candlestick chart (M5) — you only see the result
The same market as an OrderFlux footprint (M30) — you see the engine inside

Step 1 — The four core concepts of order flow (Bid/Ask, Imbalance, POC, Delta)
Everything in OrderFlux is built on four order-flow fundamentals. Learn these and the whole chart becomes readable.
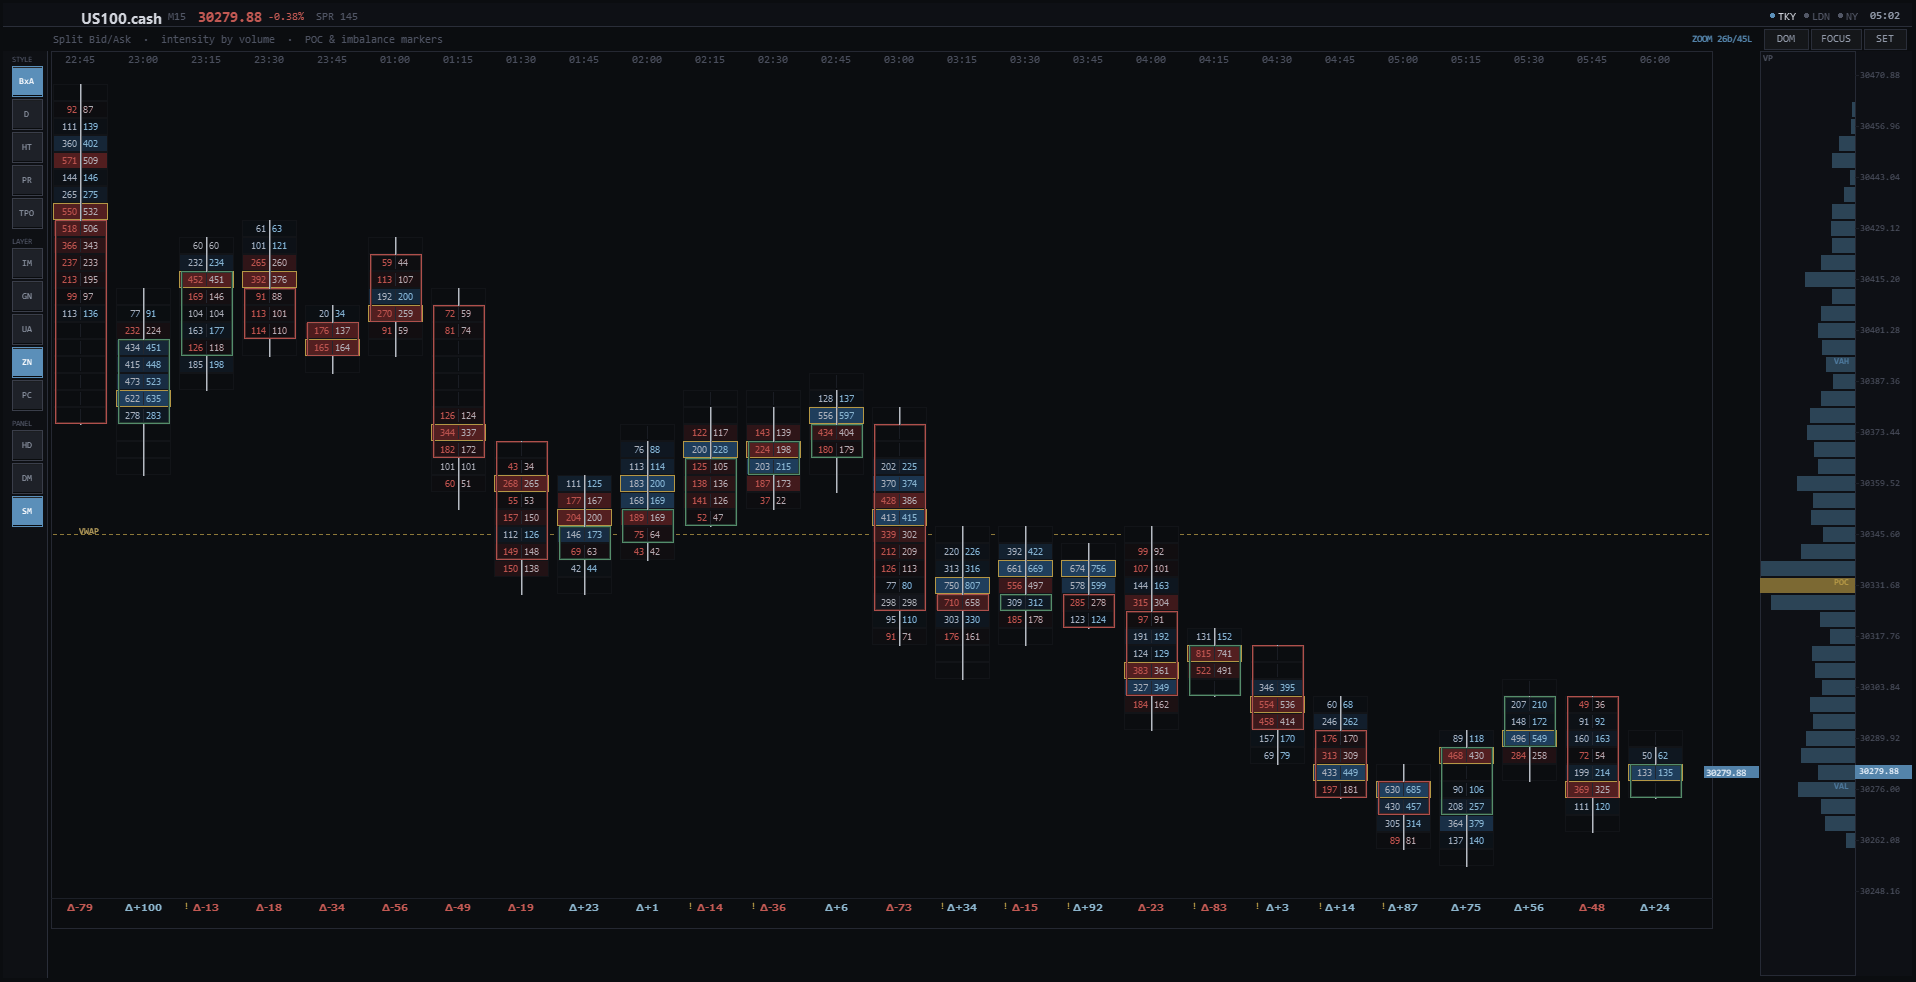
Bid × Ask Volume The left number is the Bid (aggressive market sells), the right number is the Ask (aggressive market buys). You read them diagonally to see whether buyers or sellers overwhelmed the other side at each price. | Imbalances Highlighted cells where one side dominates diagonally (default 300%+). Stacked imbalances (3+ in a row) mark zones of extreme pressure that often become future support / resistance. |
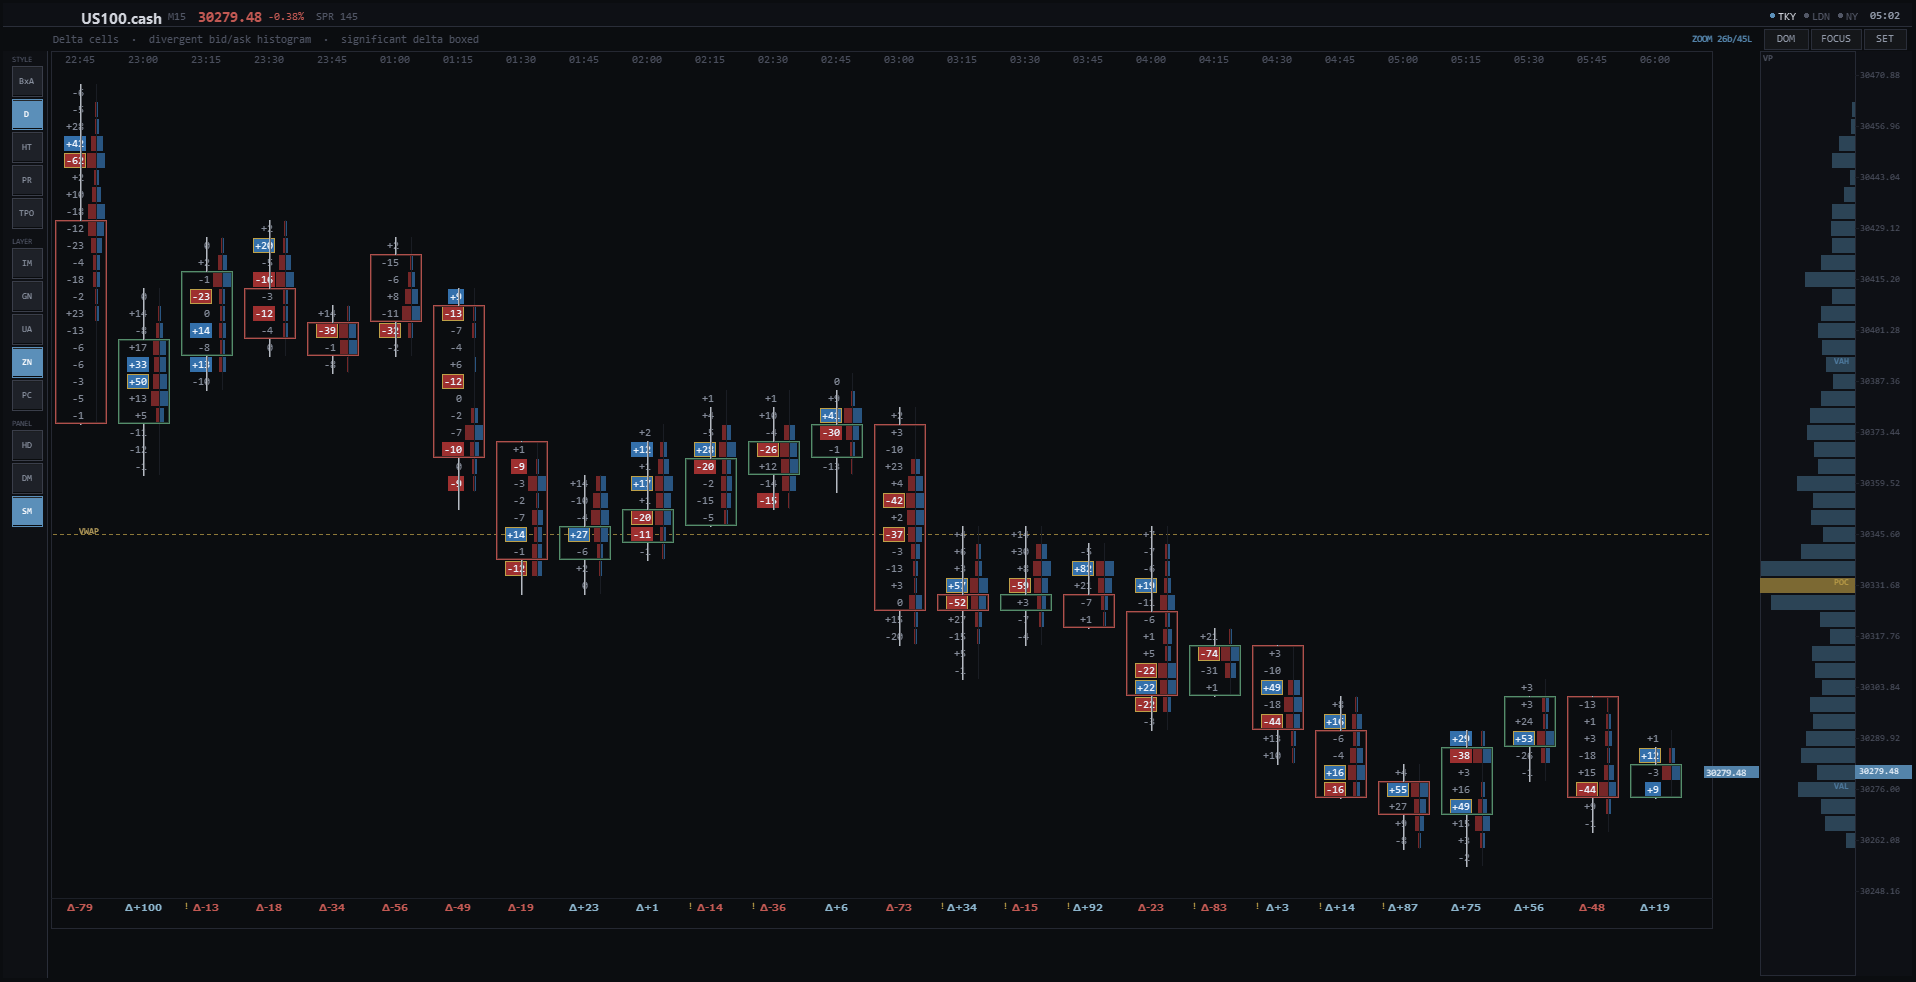
Point of Control (POC) The highlighted cell inside each candle — the price level with the highest volume in that bar. Where price closes relative to the POC reveals who won the battle. | Delta & Cumulative Delta (CVD) Delta is net aggression (Ask − Bid). Strong positive delta at support signals heavy buying. Cumulative Delta (CVD) tracks the overall orderflow across the session and exposes divergences. |

Step 2 — The five footprint chart modes (Bid×Ask, Delta, Heatmap, Profile, TPO)
Switch the rendering to match the market phase and your style — instantly, on the chart:
- Bid × Ask — full cell-based bid/ask footprint per price level (the order-flow detail view)
- Delta Cells — divergent bid/ask histograms, net delta per level
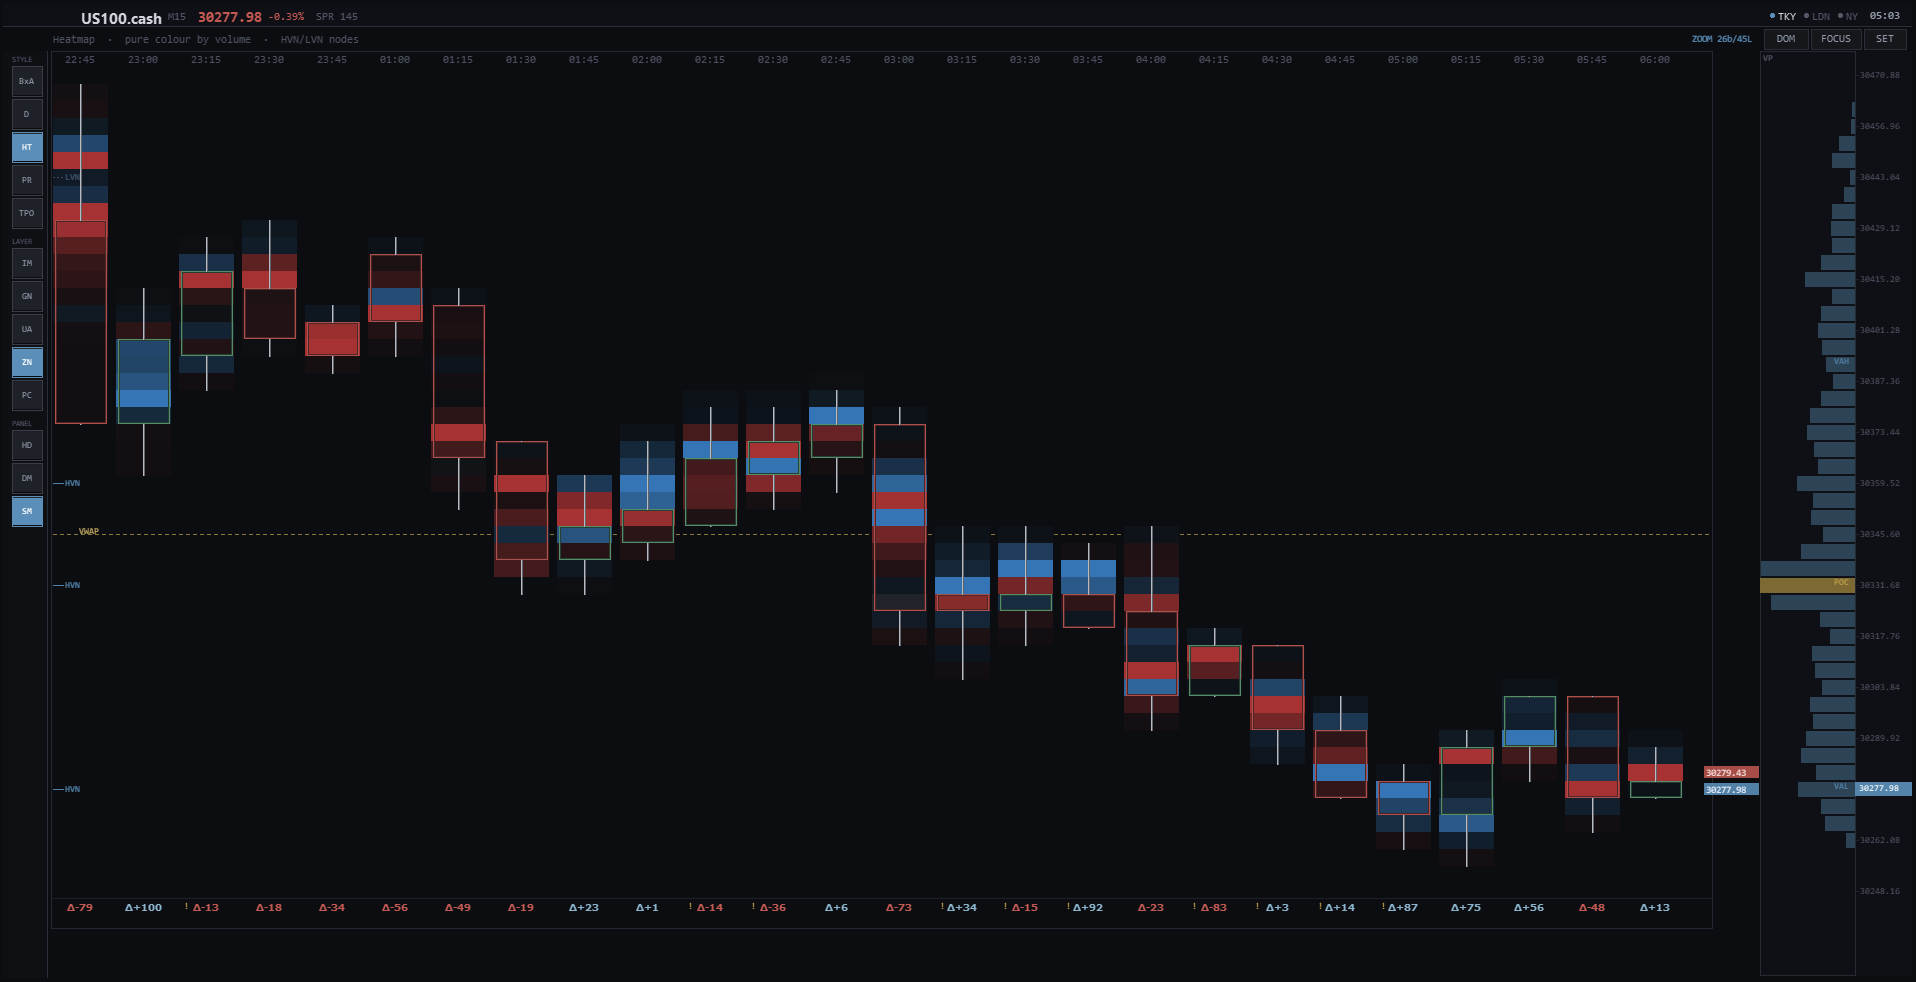
- Heatmap — pure colour intensity by volume, including HVN / LVN (high/low volume nodes)
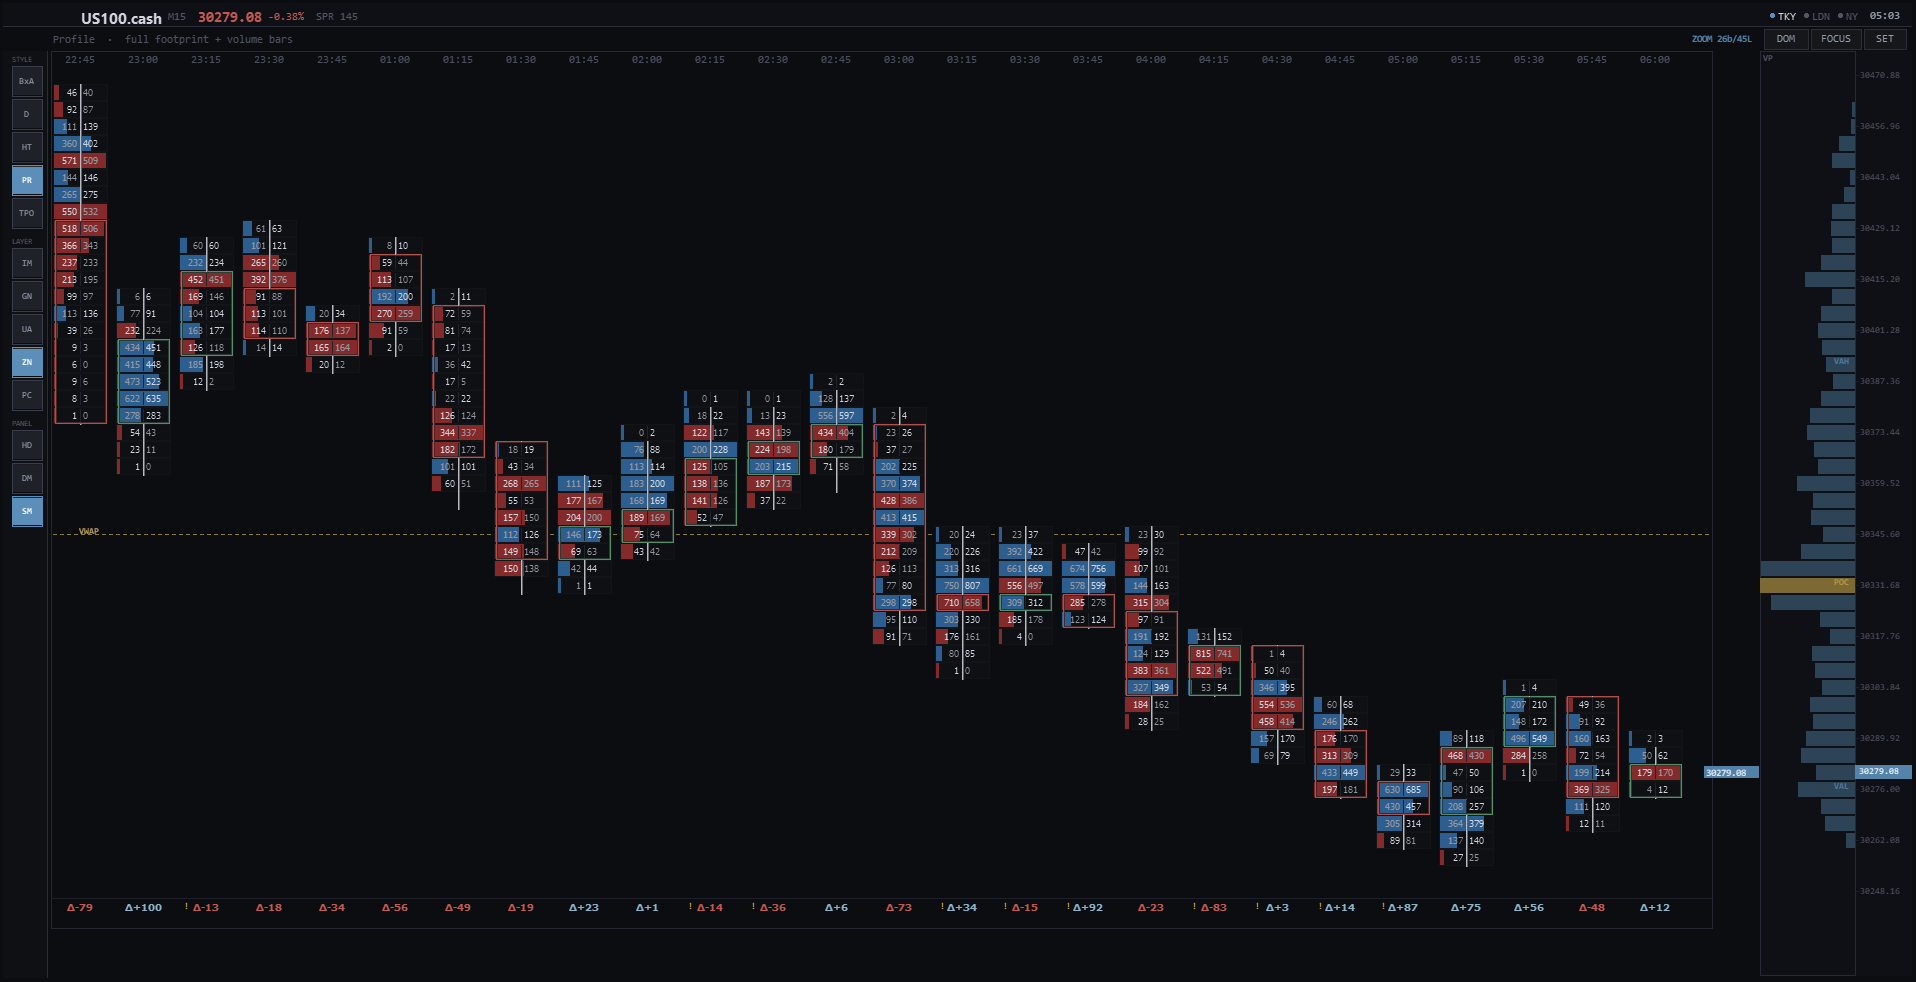
- Profile (PR) — full footprint with a horizontal volume bar per grid cell (volume distribution at a glance)
- TPO / Market Profile — multi-session market profile in block form

Step 3 — Order-flow signals: absorption, stacked imbalances and single prints
OrderFlux flags the classic patterns professionals use for entries — automatically:
- Imbalance & Stacked Imbalances — institutional support/resistance walls
- Absorption — high bid and ask volume without price moving (a passive wall soaks up aggression → reversal risk)
- Unfinished Auction — no zero-prints at the extreme (a magnet price the market tends to revisit)
- Single Prints — price levels passed through fast (imbalance / repair zones), marked in the margin without covering the candles
Step 4 — Cumulative Delta (CVD) & divergence
The CVD strip tracks net aggression across the whole session and makes divergences obvious:
- Trend-coloured CVD line — rising or falling at a glance
- Price line overlaid — instantly spot when price and CVD disagree
- Automatic Bullish / Bearish Divergence markers — an early warning for reversals
- Turn points and zero-crosses — the buyer ↔ seller sentiment flips
Step 5 — Volume Profile & Market Profile (TPO)
Context for every entry — where the market accepts or rejects price:
- Session Volume Profile with POC, VAH (Value Area High) and VAL (Value Area Low)
- HVN / LVN — fair value zones vs. liquidity vacuums
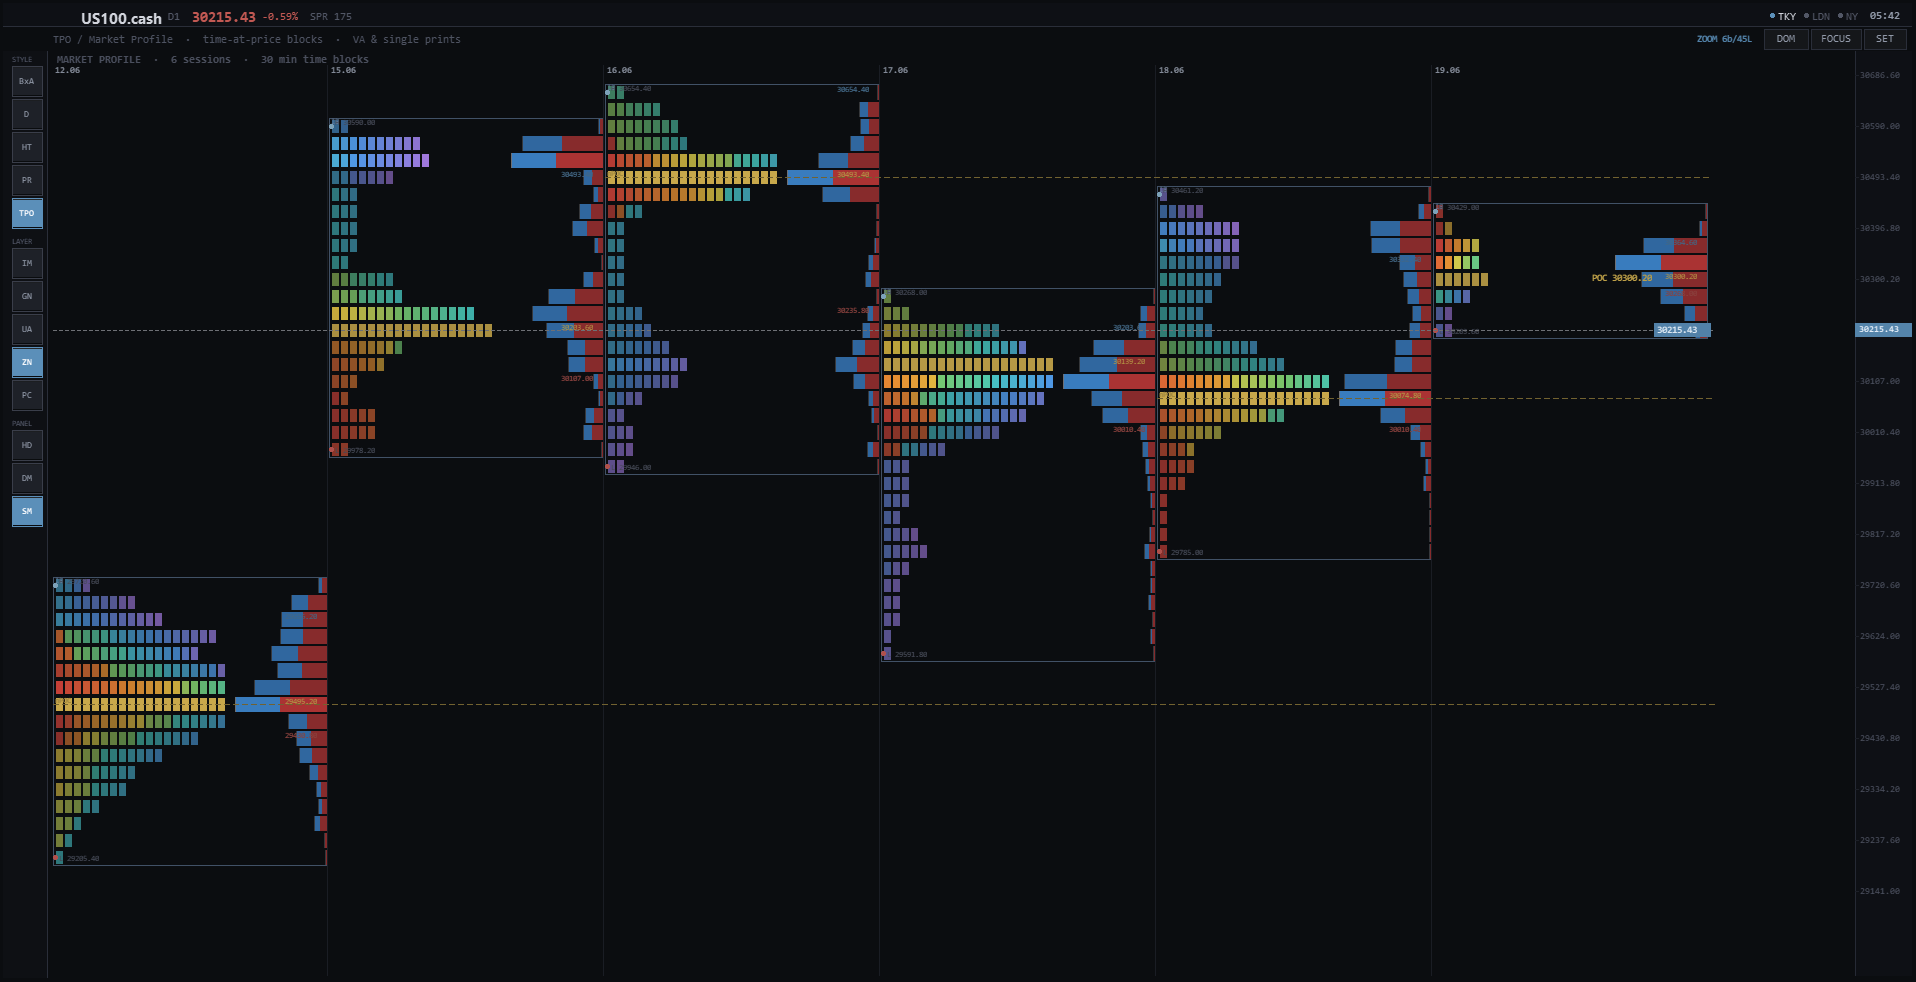
- Multi-session TPO Market Profile: one profile per trading day, side by side, with block-form time-at-price, a price path through each session, bid/ask volume split, per-session POC/VA, session high/low, Initial Balance and Naked POCs (untested magnets)
TPO / Market Profile on the Daily — time blocks coloured by time of day

Multiple sessions side by side with POC / VAH / VAL and naked POCs
Step 6 — Live order flow: DOM, Time & Sales and the Flow / Analysis panel
The right panel bundles the live order-flow tools in two tabs:
FLOW Live Order-Flow Ladder of the forming candle (bid × ask per level, live), a Buy/Sell pressure bar, the Time & Sales tape, and the DOM (Depth of Market) on brokers with a depth feed. | ANALYSIS Market Bias (overall bias, session delta, volume vs. average, price vs. VWAP), Key Levels (POC, VAH, VAL, session high/low) and Active Zones (supply/demand with strength). |
Step 7 — The smart order-flow analysis layer (Market Read, Confluence, Trade-Assist)
OrderFlux doesn't just draw — it interprets. The intelligent layer recognises order-flow concepts for you:
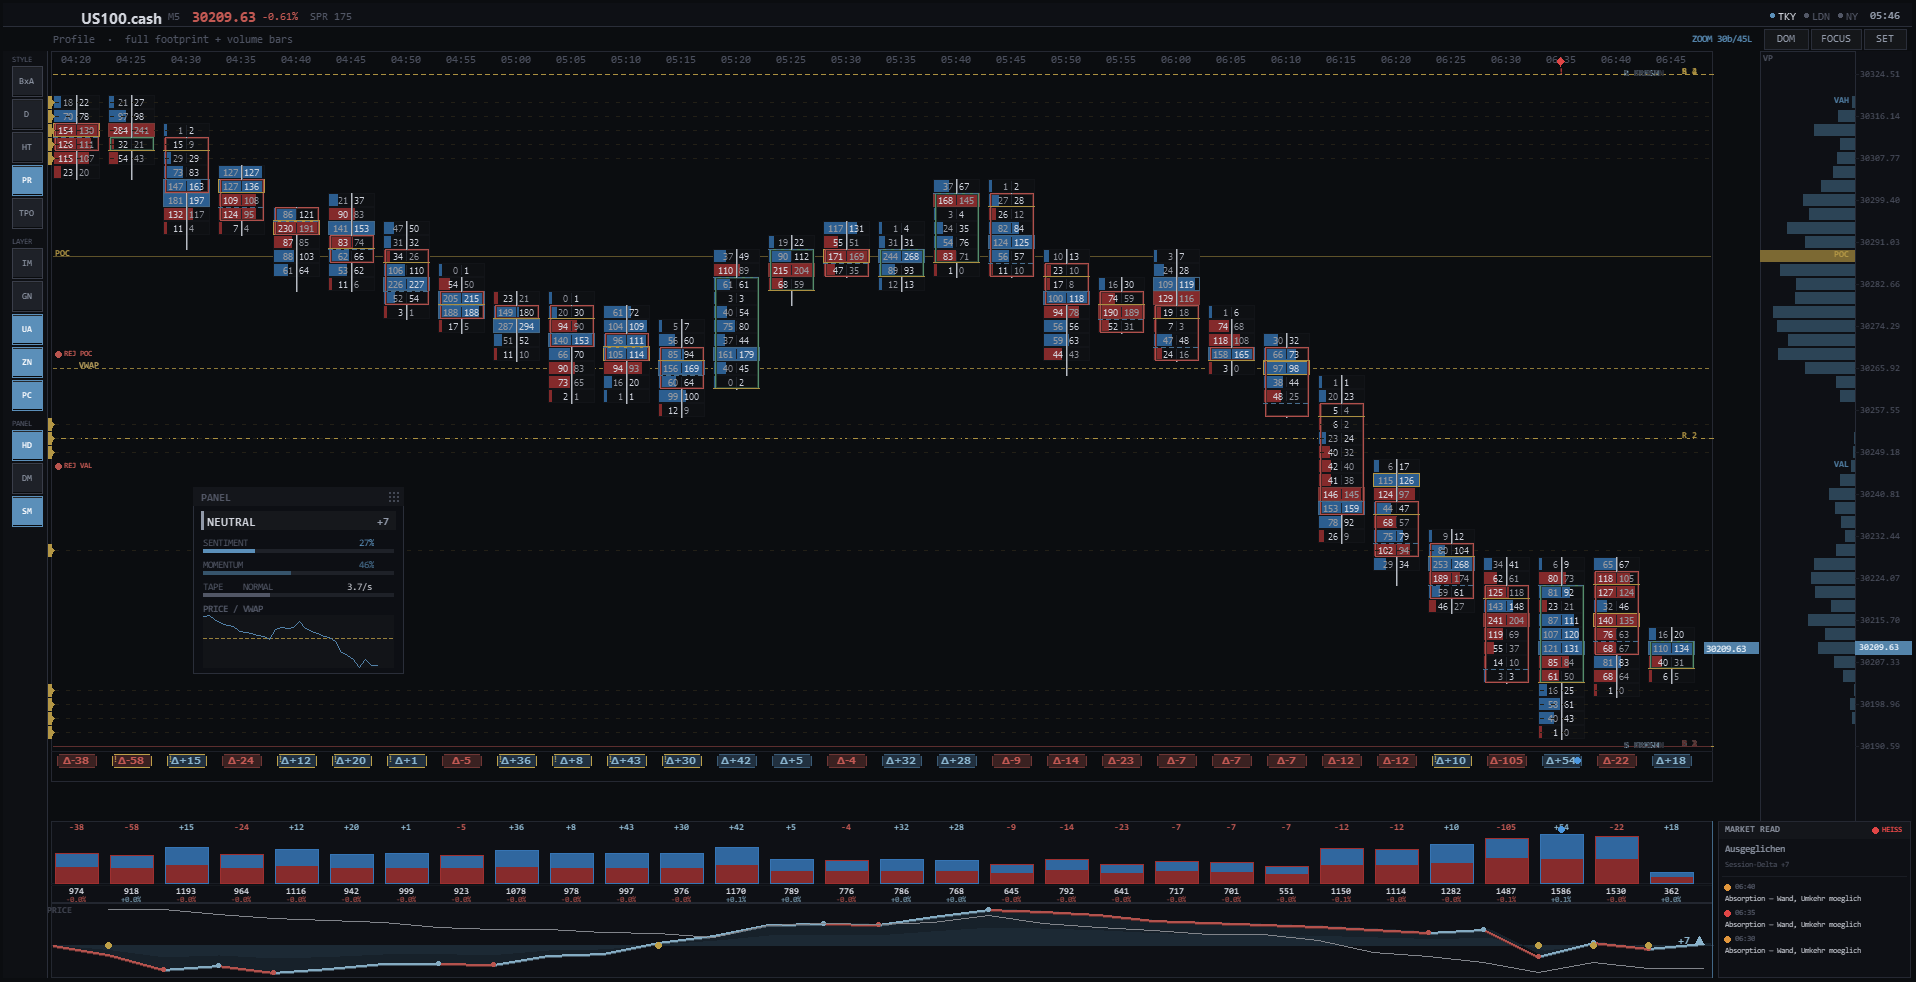
- Intelligence Panel — Sentiment, Momentum, Tape Speed (institutional activity vs. noise) and a Price / VWAP mini-chart
- Acceptance / Rejection at key levels (dwell time + volume vs. a quick tick)
- 80% Rule (value-area rotation): open outside the value area → return with acceptance → target the opposite value-area edge
- Zone Lifecycle for S/R: fresh → first test → tested → broken
- Confluence Reversal Score (divergence + level + absorption + exhaustion) with a suggested SL/TP (Trade-Assist)
- Market Read in plain language: who dominates (buyers/sellers) and which market anomalies just stacked up
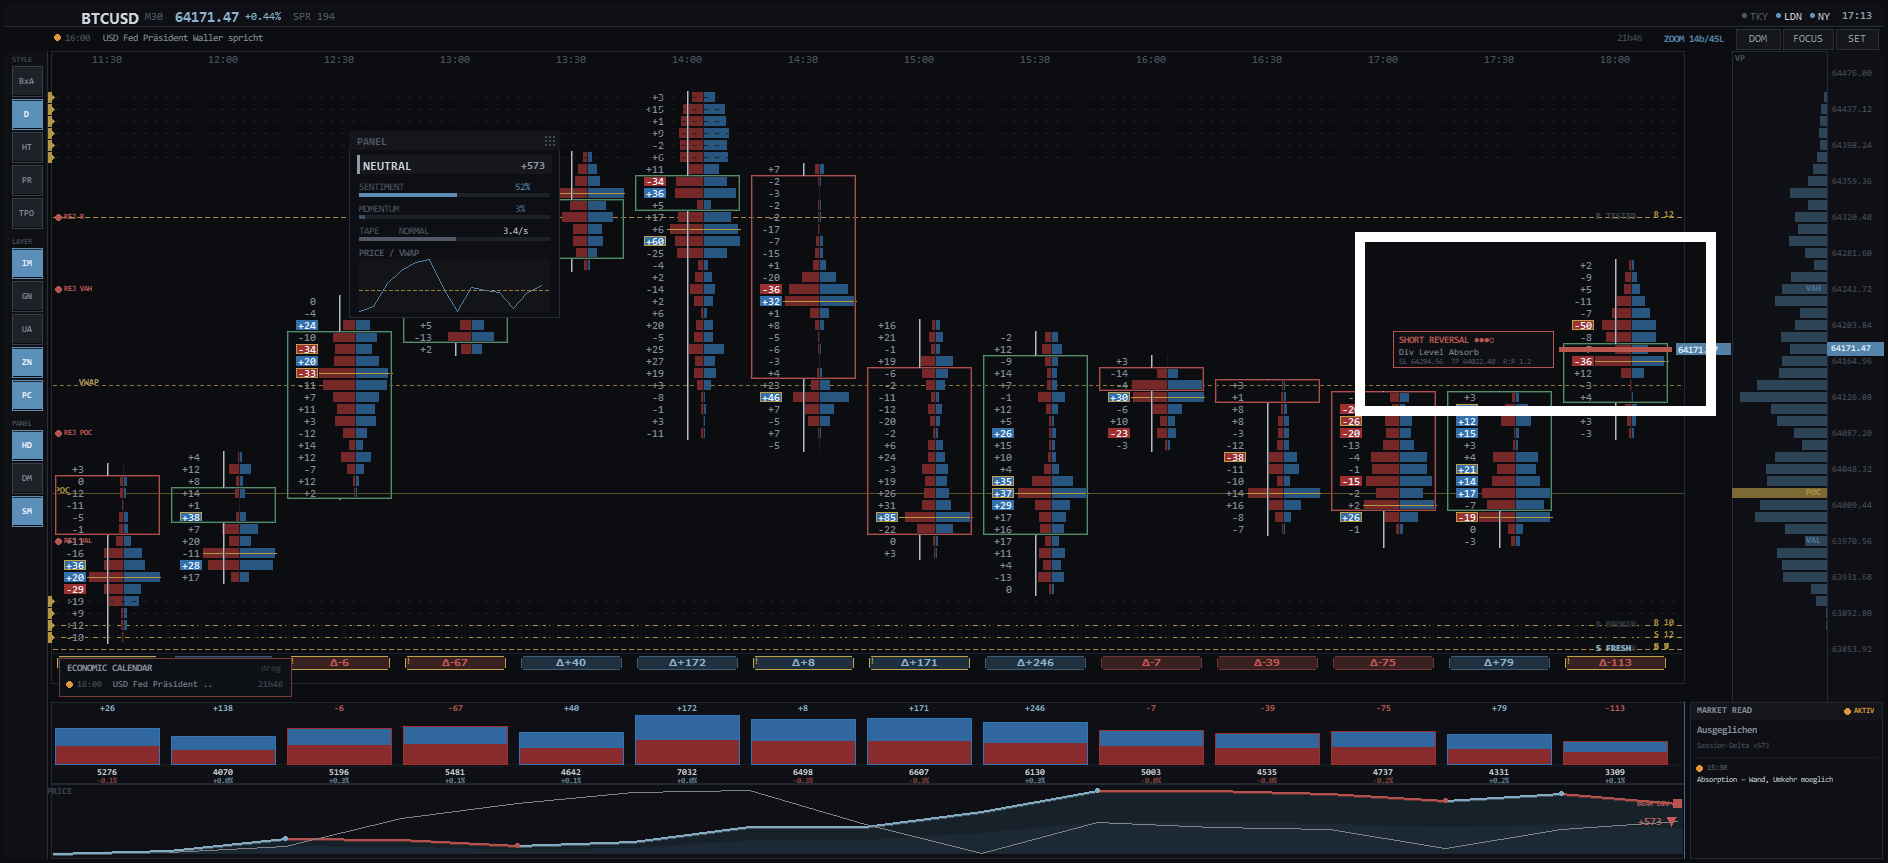
Smart layer: the plain-language Market Read, the Confluence reversal score and the Trade-Assist SL/TP suggestion
Step 8 — Economic calendar news lines on the MT5 chart
- News lines at the exact event time for high-impact releases (red folder), filtered to the symbol's currencies
- Economic-Calendar panel with the upcoming events and a live countdown (in X minutes / hours)
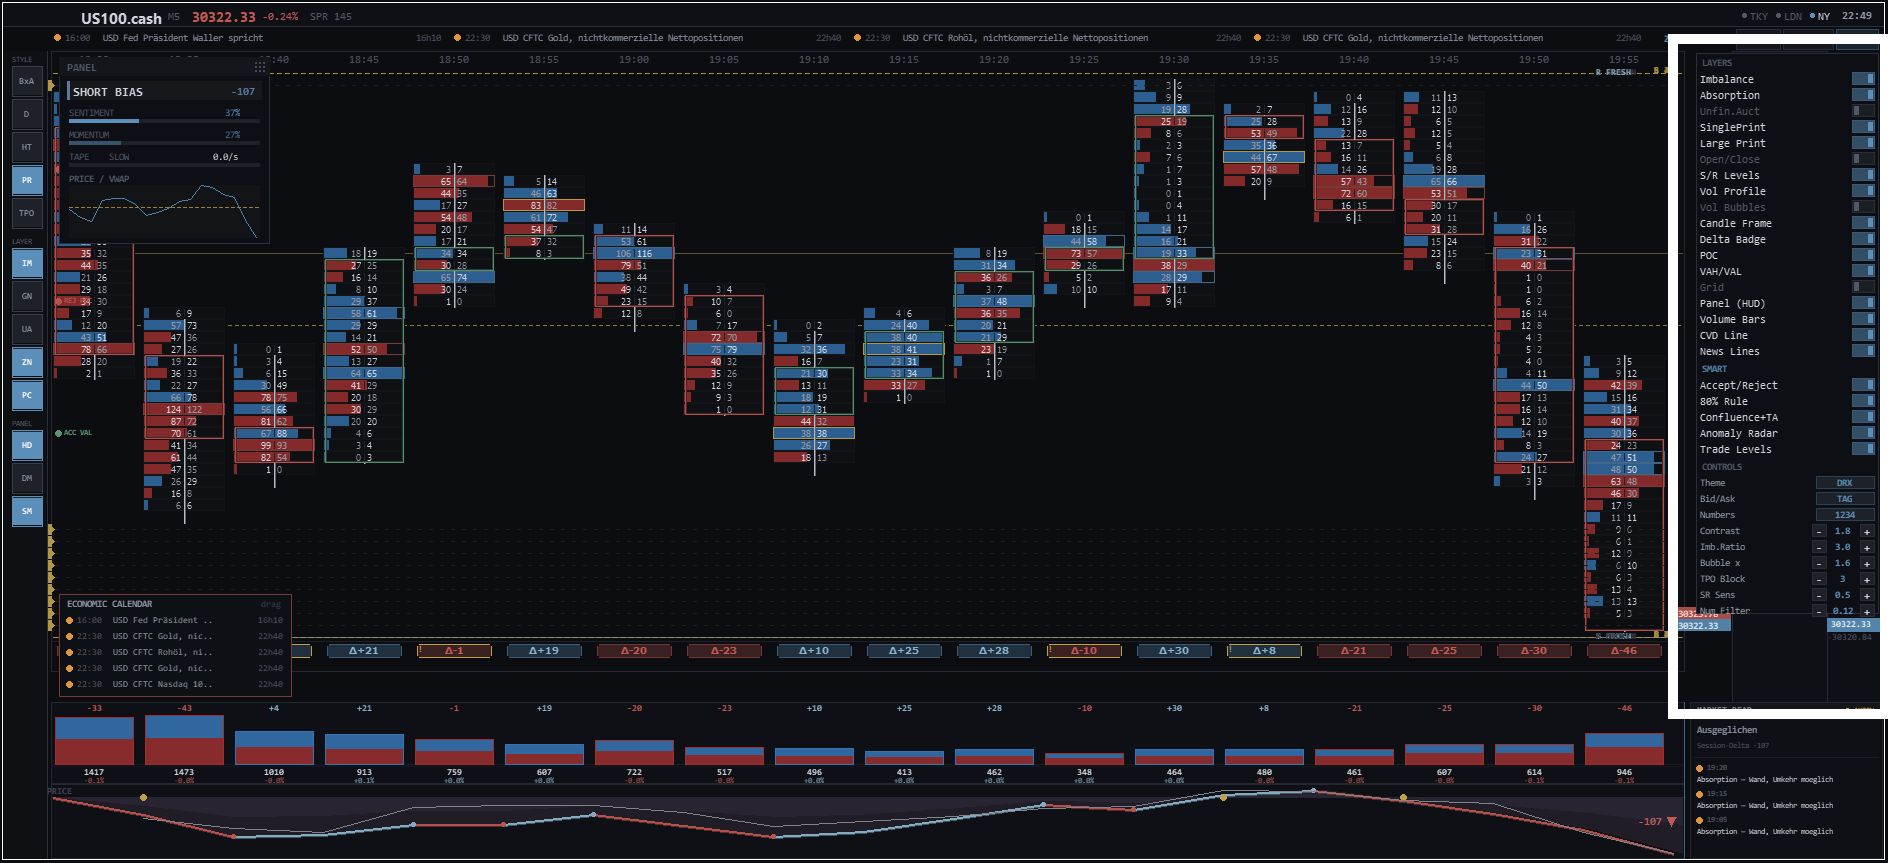
How to navigate OrderFlux
The indicator is built for speed — you rarely need the MT5 settings menu. Everything is controlled on-screen and via keyboard.
The on-chart controls
- Left rail — quick toggles grouped into Style (the footprint modes), Layer (imbalance, ghost numbers, unfinished auction, zones, POC…) and Panel (HUD, DOM, summary).
- Top-right buttons — DOM, FOCUS and SET.
- SET panel — open the settings panel to toggle every element individually (layers, smart features, volume, CVD, news, grid, theme) and to adjust thresholds (imbalance ratio, contrast, bubble size, TPO block, S/R sensitivity).
Keyboard shortcuts
- [ 1 ] – [ 5 ] : switch footprint mode (Bid×Ask · Delta · Heatmap · Profile · TPO)
- [ F ] : Focus mode (clean full-screen footprint)
- [ T ] : switch theme (Dark · PRO · Light)
- [ D ] : DOM / Flow panel · [ S ] : Settings panel
- [ V ] : Volume Profile · [ I ] : Imbalance · [ B ] : Volume bubbles
- [ C ] : Confluence · [ A ] : Anomaly radar · [ N ] : News lines · [ G ] : Grid
Tip: hover the mouse over any price level — a tooltip tells you in plain language what is there (POC, VAH/VAL, single print, support/resistance, bid/ask).
Footprint charts depend on tick data — and for a true Time & Sales / DOM, on real volume from your feed. Brokers with a real-volume feed (e.g. a futures volume feed) deliver the full picture. On FX/CFD and demo feeds the analysis is built on tick data. As with every order-flow tool, the quality of the read depends on the quality of the feed.
Technical specifications
| Parameter | Value |
|---|---|
| Platform | MetaTrader 5 (MT5 only) |
| Footprint modes | Bid×Ask, Delta, Heatmap, Profile, TPO Market Profile |
| Order-flow signals | Imbalance & stacks, Absorption, Unfinished Auction, Single Prints |
| Delta & CVD | Cell/bar delta, cumulative delta with divergence detection |
| Profiles | Volume Profile (POC/VAH/VAL, HVN/LVN), multi-session TPO, Naked POCs |
| Flow panel | Order-Flow Ladder, Buy/Sell pressure, Time & Sales, DOM (depth feed) |
| Smart layer | Acceptance, 80% rule, Zone lifecycle, Confluence + Trade-Assist, Market Read / anomalies |
| Extras | Economic calendar lines + countdown, VWAP, Support/Resistance, 3 themes, hover tooltip, Focus mode |
| Imbalance calc | Diagonal comparison (customizable multiplier, default 300%) |
| Recommended markets | Indices (Nasdaq, US30), Gold, major Forex pairs; best with a real-volume feed |
Where OrderFlux fits in your strategy
OrderFlux is the ultimate confirmation tool. It doesn't replace your higher-timeframe analysis (TPO, support/resistance) — it confirms it at the moment of execution.
A classic example: price drops into your predefined daily support zone. Instead of guessing whether it holds, you read the footprint. You see massive negative delta but price stops falling, and the POC forms at the very bottom of the candle — that is absorption. The Confluence score lights up and Market Read says "buyers stepping in". When the next candle opens with an aggressive buy imbalance, you execute with precision and a tight stop below the volume cluster — Trade-Assist even suggests the SL/TP.
This tool is not an automated EA. It gives the discretionary trader the exact mechanics behind every price move.
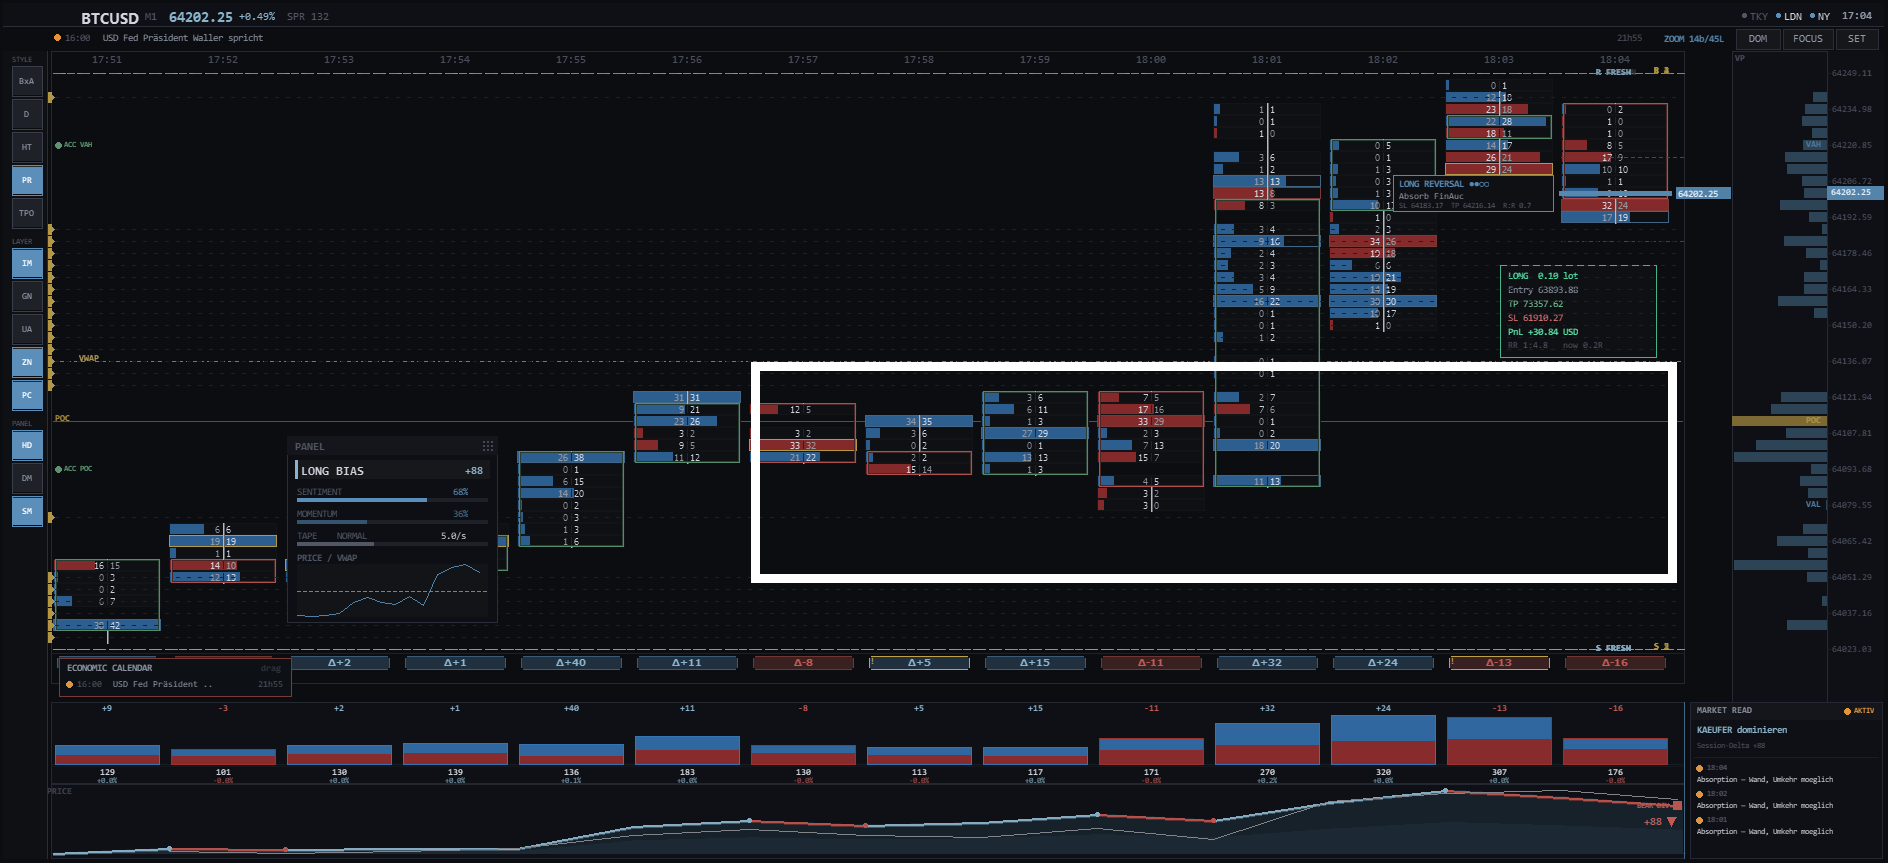
Practical example: aggressive selling absorbed at support, then a stacked buy imbalance confirms the long entry
Frequently asked questions about OrderFlux and order flow on MT5
What is an orderflow footprint chart?
An orderflow footprint chart shows the real traded volume inside every candle, split into volume traded at the bid (aggressive sellers) and at the ask (aggressive buyers). Instead of only Open, High, Low and Close, you see exactly where buyers and sellers fought, where volume was absorbed and where imbalances formed. OrderFlux brings this footprint chart, with delta, POC and imbalances, directly into MetaTrader 5.
Does OrderFlux work on MetaTrader 5 (MT5)? Is it compatible with MT4?
OrderFlux is built for MetaTrader 5 (MT5) and uses real tick data. It is not compatible with MetaTrader 4 (MT4), because MT4 does not provide the tick-level data an order flow indicator needs.
Do I need real volume or a futures feed for the footprint?
For a true Time & Sales and DOM you need a feed with real volume, for example a futures volume feed. On Forex, CFD and demo accounts the footprint is built from tick data. As with every order flow tool, the quality of the read depends on the quality of the broker feed.
What is the difference between a volume profile and a TPO market profile?
A volume profile shows how much volume traded at each price (POC, Value Area High, Value Area Low). A TPO market profile shows how much time price spent at each level, split into time blocks per session. OrderFlux includes both: a session volume profile and a multi-session TPO market profile with time-coloured blocks.
Which markets work best for order flow — Nasdaq, Gold or Forex?
Order flow reads best on instruments with real volume, such as index futures (Nasdaq, US30) and Gold. Major Forex pairs work on a tick basis. The clearer the volume feed, the cleaner the footprint, delta and imbalance signals.
Is OrderFlux an automated trading robot (EA)?
No. OrderFlux is an indicator, not an automated EA. It does not open or close trades. It visualises order flow, footprint, volume profile and market profile so the discretionary trader can decide. It can read and display your open position (entry, stop loss, take profit, live PnL and risk:reward) but never sends orders.
DRX OrderFlux — Orderflow Footprint Chart
Available on the MQL5 Marketplace. For the full market overview, combine this footprint chart with the DRX Market Profile Master.


