OrderFlux Footprint Orderflow
- 지표
-
Simon Draxler
 저에 대해
저에 대해
안녕하세요! 저는 14년 이상의 경력을 가진 전문 개발자입니다. 성공적인 트레이딩에는 마법이 필요한 것이 아니라 논리, 안정성, 그리고 깨끗한 코드가 필요합니다.
제 초점은 실제 시장 조건에서도 살아남는 전문가 고문(EA)을 구축하는 데 있습니다. 저는 분석적이고 신중하게 작업합니다.
저에게 기대할 수 있는 것:
투명성: 숨겨진 위험이 없습니다.
품질: 제 코드는 깨끗하고 오래 지속되도록 설계되었습니다.
정직: 기적을 약속하지 않고 견고한 도구를 제공합니다. - 버전: 1.31
- 업데이트됨: 22 6월 2026
- 활성화: 10
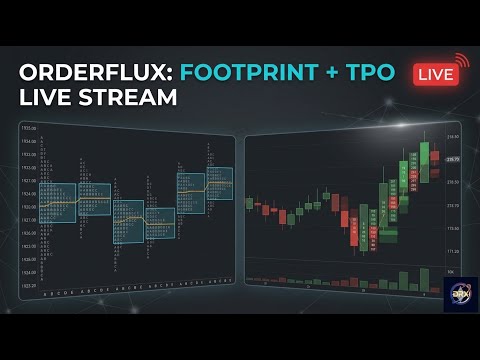
OrderFlux — MetaTrader 5용 Order Flow 및 Footprint 인디케이터
OrderFlux는 MetaTrader 5용 Order Flow(오더 플로우) 및 Footprint 인디케이터입니다. 각 캔들을 개별적으로 해체하여 내부에서 실제로 어떤 일이 발생하는지 보여줍니다. 즉, 각 가격 레벨에서 체결된 거래량을 공격적인 매수자와 매도자로 구분하여 표시합니다. 이러한 틱 데이터 기반으로 Delta, Imbalance, Volume Profile, Market Profile을 포함한 완전한 Footprint 차트가 실시간으로 생성됩니다.
일반 차트는 Open, High, Low, Close만을 보여줍니다. 이는 움직임의 결과일 뿐 원인이 아닙니다. OrderFlux는 각 캔들의 미세 구조를 시각화하여 “누가 실제로 움직임을 주도했는가?”라는 핵심 질문에 답합니다.
이를 통해 지지와 저항은 캔들의 형태가 아니라 실제 거래된 거래량 기반으로 해석됩니다.
Footprint가 보여주는 것
각 가격 레벨에는 두 개의 값이 표시됩니다. 왼쪽은 Bid에서 체결된 거래량, 오른쪽은 Ask에서 체결된 거래량입니다.
이 두 값의 관계로 Delta(델타), 즉 매수와 매도의 순수 압력이 계산됩니다.
한쪽으로 강하게 치우친 레벨은 Imbalance로 표시됩니다.
이러한 Imbalance가 3개 이상 쌓이면 이후 지지 또는 저항으로 작용할 가능성이 높은 “스택 구간”을 형성합니다.
한 캔들에서 가장 거래량이 많은 가격은 Point of Control(POC)로 강조됩니다.
캔들의 본체는 시가부터 종가까지 명확하게 유지되며, 꼬리도 그대로 표시됩니다.
비정상적으로 공격적인 거래량은 Bubble로 표시됩니다.
각 캔들 아래에는 시간, Delta, 총 거래량 요약이 표시됩니다.
이를 통해 움직임이 실제 시장 참여에 의해 발생했는지, 아니면 얇은 유동성에서 발생했는지 즉시 판단할 수 있습니다.
5가지 Footprint 모드
Bid × Ask: 각 가격 레벨의 양쪽 거래량을 전체 표시
Delta: 매수/매도 압력을 히스토그램으로 비교
Heatmap: 거래량 기반 색상 표시 (HVN / LVN 강조)
Profile: 각 가격 레벨에 거래량 바 추가
TPO: 여러 세션에 걸친 Market Profile 표시
Order Flow 신호
OrderFlux는 Order Flow 트레이더가 주목하는 구조를 자동으로 감지합니다.
Absorption(흡수)은 고점 또는 저점에서 큰 거래량이 발생하지만 가격이 더 이상 진행되지 않는 상황입니다. 이는 대형 패시브 주문이 공격적인 주문을 흡수하기 때문입니다.
Unfinished Auction(미완료 경매)은 극단 가격에서 발생하며 이후 가격을 다시 끌어당기는 “자석” 역할을 합니다.
Single Prints는 가격이 매우 빠르게 지나간 구간이며 이후 다시 테스트되는 경우가 많습니다.
Stacked Imbalance는 기관 수준의 주문 벽으로 작용하며 지지/저항 형성의 핵심이 됩니다.
Volume Profile 및 Market Profile
Volume Profile은 세션 전체 거래량을 가격별로 분포시키며 다음을 제공합니다:
Point of Control (POC)
Value Area High (VAH)
Value Area Low (VAL)
이를 통해 시장이 “가치로 인정한 가격”과 “거부한 가격”을 확인할 수 있습니다.
높은/낮은 거래량 노드는 공정 가치 구간과 유동성 공백을 구분합니다.
TPO 기반 Market Profile은 여러 세션을 나란히 보여줍니다.
OrderFlux는 전통적인 문자 대신 읽기 쉬운 블록 형태로 각 세션의 가격 흐름을 표시합니다.
각 거래일에는 다음이 포함됩니다:
POC
Value Area
세션 고점
세션 저점
Initial Balance
미도달 POC (목표 구간)
거래량은 계속해서 매수/매도로 분리됩니다.
누적 Delta (CVD)
누적 Delta(CVD)는 전체 세션 동안 순수한 매수/매도 압력을 추적합니다.
가격은 상승하는데 CVD가 하락하는 경우, 또는 그 반대의 경우 Divergence(다이버전스)가 발생합니다.
OrderFlux는 이러한 다이버전스, 전환 지점, 매수/매도 주도권 변화 지점을 자동으로 표시합니다.
가격 라인은 CVD 라인 위에 표시되어 두 흐름의 괴리를 즉시 확인할 수 있습니다.
Flow 및 분석
전용 패널은 실시간 분석 도구를 통합합니다.
Order Flow Ladder는 현재 캔들의 Bid/Ask와 매수·매도 압력 비율을 보여줍니다.
Time and Sales는 개별 틱 거래를 시간과 방향과 함께 표시합니다.
Depth of Market(DOM)은 지원 브로커에서 표시됩니다.
두 번째 탭에서는 다음을 요약합니다:
시장 방향
세션 Delta
평균 대비 거래량
VWAP 위치
중요 레벨
수급 구간
Intelligence Panel 및 스마트 분석
이동 가능한 패널에는 다음이 표시됩니다:
시장 심리 (Sentiment)
모멘텀
테이프 속도 (Tape Speed)
이를 통해 기관 참여 여부 또는 단순 노이즈 시장 여부를 판단할 수 있습니다.
가격과 VWAP의 미니 추세도 표시됩니다.
추가로 자연어 기반 분석이 제공됩니다:
중요 레벨에서의 수용/거부 판단
Value Area 80% 규칙 분석
구간 생명주기 (신규 → 테스트 → 돌파/붕괴)
Divergence, 레벨, Absorption, Exhaustion 기반 Confluence 점수 계산
손절 및 목표 구간 제안
최종적으로 시장 요약 및 이상 현상 표시
가격 레벨에 마우스를 올리면 POC, Value Area, Single Print, 지지 등 정보가 표시됩니다.
레벨, VWAP 및 사용자 스케일
OrderFlux는 VWAP 및 Session POC를 차트에 직접 표시하며 다중 타임프레임 구조에서 지지/저항을 감지합니다.
또한 독립 가격 스케일과 미니 그리드를 활성화하여 MetaTrader 기본 UI와 분리된 차트를 구성할 수 있습니다.
경제 일정 (Economic Calendar)
중요 이벤트는 정확한 시간에 맞춰 차트에 세로선으로 표시되며, 거래 심볼의 통화에 맞게 필터링됩니다.
작은 패널에는 다음 이벤트와 카운트다운이 표시됩니다.
시각화 및 조작
세 가지 테마:
다크
모노크롬
라이트
모든 조작은 차트 좌측 패널과 단축키로 수행됩니다.
마우스 휠로 부드러운 줌이 가능합니다.
Focus Mode는 Footprint만 남기고 나머지를 숨깁니다.
모든 설정은 저장되어 유지됩니다.
첫 실행
데이터가 적게 보일 경우 MetaTrader에서 히스토리 데이터를 먼저 로드해야 합니다.
테스트에는 Real Tick 모드가 권장됩니다.
초기에는 M1, M5 같은 짧은 타임프레임이 가장 적합합니다.
기술 사양
OrderFlux는 MetaTrader 5 전용이며 MetaTrader 4에서는 사용할 수 없습니다.
모든 심볼과 타임프레임에서 작동합니다.
자체 렌더링 엔진으로 많은 레벨에서도 부드럽게 동작합니다.
브로커의 실제 Tick 데이터 기반으로 작동합니다.
DOM 기능은 Depth Feed 지원 브로커가 필요합니다.
Time and Sales의 실제 거래량은 실제 거래 데이터 소스(예: 선물 데이터)가 필요합니다.
FX, CFD 및 데모 계정에서는 Tick 데이터 기반으로 분석됩니다.
중요 사항
OrderFlux는 자동 매매를 하지 않으며 신호 서비스도 아닙니다.
포지션을 자동으로 열거나 닫지 않습니다.
주요 목적은 다음을 시각화하는 것입니다:
Order Flow
Footprint
Volume Profile
Market Profile
최종 거래 결정은 항상 트레이더 본인의 책임입니다.
전체 매뉴얼 (이미지 포함):
https://www.mql5.com/en/blogs/post/770245
리스크 경고: 트레이딩은 위험을 수반합니다. 과거 시장 반응이 미래 결과를 보장하지 않습니다.