OrderFlux Footprint Orderflow
- Indicatori
-
Simon Draxler
 Chi sono
Ciao! Sono uno sviluppatore professionista con oltre 14 anni di esperienza. Il trading di successo non richiede magia, ma logica, stabilità e codice pulito.
Il mio obiettivo è costruire Expert Advisors (EA) per condizioni di mercato reali. Lavoro in modo analitico e attento. - Versione: 1.31
- Aggiornato: 22 giugno 2026
- Attivazioni: 10
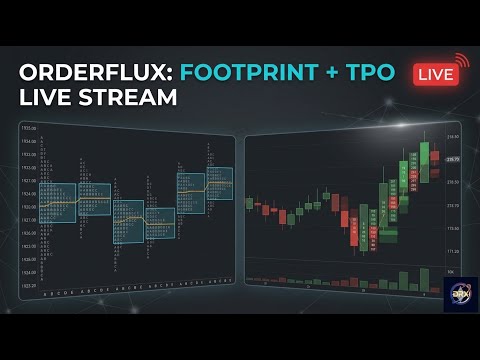
OrderFlux — Indicatore di Order Flow e Footprint per MetaTrader 5
OrderFlux è un indicatore di Order Flow e Footprint per MetaTrader 5. Analizza ogni singola candela e mostra cosa accade al suo interno: il volume scambiato a ogni livello di prezzo, separato tra acquirenti e venditori aggressivi. Da questi dati Tick viene costruito in tempo reale un Footprint Chart completo con Delta, Imbalance, Volume Profile e Market Profile.
Un grafico tradizionale mostra solo Open, High, Low e Close. Questo rappresenta il risultato del movimento, non la sua causa. OrderFlux rende visibile la microstruttura di ogni candela e risponde alla domanda fondamentale: chi ha davvero guidato il movimento?
In questo modo, supporti e resistenze non vengono più interpretati solo dalla forma delle candele, ma dal volume reale scambiato.
Cosa mostra il Footprint
A ogni livello di prezzo vengono mostrati due valori. A sinistra il volume eseguito al Bid, a destra il volume eseguito all’Ask.
Il rapporto tra questi due lati genera il Delta, cioè la pressione netta di acquirenti o venditori.
I livelli con forte squilibrio vengono marcati come Imbalance.
Quando tre o più Imbalance si sovrappongono, si crea una zona strutturata che spesso agisce successivamente come supporto o resistenza.
Il livello con il volume più alto all’interno della candela, chiamato Point of Control (POC), viene evidenziato.
Il corpo della candela rimane chiaramente visibile dall’apertura alla chiusura, comprese le shadow.
Volumi particolarmente aggressivi vengono marcati come Bubble.
Sotto ogni candela è presente un riepilogo con tempo, Delta e volume totale.
Questo permette di capire immediatamente se un movimento è stato sostenuto da reale pressione o da liquidità debole.
I cinque modi Footprint
Bid × Ask: volume completo per lato e livello di prezzo
Delta: pressione compratori/venditori in forma di istogramma
Heatmap: colorazione dei livelli in base al volume (HVN / LVN)
Profile: barra di volume per ogni livello
TPO: Market Profile su più sessioni
Segnali Order Flow
OrderFlux identifica automaticamente le strutture utilizzate dai trader professionali di Order Flow.
Absorption si verifica quando un grande volume viene scambiato su un massimo o minimo, ma il prezzo non continua perché ordini passivi assorbono la pressione.
Una Unfinished Auction su un estremo spesso agisce come magnete e richiama il prezzo successivamente.
Le Single Prints evidenziano aree attraversate rapidamente e spesso ritestate.
Le Stacked Imbalance rappresentano muri istituzionali che formano supporti e resistenze.
Volume Profile e Market Profile
Il Volume Profile distribuisce il volume su tutti i prezzi di una sessione e fornisce:
Point of Control (POC)
Value Area High (VAH)
Value Area Low (VAL)
Questo permette di identificare dove il mercato accetta il valore e dove lo rifiuta.
I nodi di alto e basso volume separano le zone di fair value dai vuoti di liquidità.
Il Market Profile in formato TPO mostra più sessioni affiancate.
OrderFlux utilizza blocchi leggibili invece delle lettere e traccia il percorso del prezzo in ogni sessione.
Ogni giornata include:
POC
Value Area
Massimo di sessione
Minimo di sessione
Initial Balance
POC non ritestati che possono diventare target
Il volume resta separato tra compratori e venditori.
Delta cumulativo (CVD)
Il Delta cumulativo (CVD) segue la pressione netta durante tutta la sessione.
Se il prezzo sale mentre il CVD scende (o viceversa), si crea una divergenza.
OrderFlux evidenzia automaticamente queste divergenze, i punti di inversione e i cambi di dominanza tra compratori e venditori.
La linea del prezzo è posizionata sopra la linea del CVD per rendere immediatamente visibili le discrepanze.
Flow e analisi
Un pannello dedicato integra gli strumenti in tempo reale.
La Order Flow Ladder mostra Bid e Ask della candela attiva insieme a un indicatore di pressione compratori/venditori.
Time and Sales elenca ogni tick con prezzo e direzione.
Il DOM (Depth of Market) è disponibile con broker supportati.
Una seconda scheda riassume:
Direzione del mercato
Delta di sessione
Volume rispetto alla media
Posizione rispetto al VWAP
Livelli importanti
Zone di domanda e offerta
Intelligence Panel e analisi intelligente
Un pannello mobile mostra:
Sentiment
Momentum
Velocità del tape
Questo aiuta a identificare presenza istituzionale o semplice rumore di mercato.
Viene mostrata anche una mini-traiettoria di prezzo e VWAP.
Sopra i dati numerici è presente un’analisi in linguaggio naturale:
Riconoscimento di accettazione o rifiuto dei livelli
Regola dell’80% della Value Area
Ciclo di vita delle zone (nuova → testata → rotta)
Confluence score basato su divergenza, livelli, absorption ed esaurimento
Suggerimenti per stop e target
Sintesi finale del mercato e anomalie
Passando il mouse sui livelli si visualizzano informazioni come POC, Value Area, Single Print e supporti.
Livelli, VWAP e scala personalizzata
OrderFlux disegna VWAP e Session POC direttamente sul grafico e identifica supporti e resistenze su più timeframe.
È possibile attivare una scala prezzi indipendente e una griglia leggera per una visualizzazione separata da MetaTrader.
Calendario economico
Gli eventi importanti vengono mostrati come linee verticali nel momento esatto, filtrati in base alle valute del simbolo.
Un piccolo pannello mostra i prossimi eventi con conto alla rovescia.
Visualizzazione e controlli
Tre temi disponibili:
Scuro
Monocromatico soft
Chiaro
Il controllo avviene direttamente dal grafico tramite una barra laterale e scorciatoie da tastiera.
La rotella del mouse permette uno zoom fluido.
Focus Mode mostra solo il Footprint.
Tutte le impostazioni vengono salvate automaticamente.
Primo avvio
Se i dati sono pochi, è necessario caricare la cronologia su MetaTrader.
Per i test è consigliato il modo Real Tick.
I timeframe M1 e M5 sono ideali per iniziare.
Dettagli tecnici
OrderFlux funziona esclusivamente su MetaTrader 5 e non è compatibile con MetaTrader 4.
Funziona su tutti i simboli e timeframe.
Utilizza un motore di rendering ottimizzato per mantenere fluidità anche con molti livelli.
Si basa su dati Tick reali del broker.
Il DOM richiede un broker con Depth Feed.
Il Time and Sales richiede dati di volume reali (es. futures).
Su Forex, CFD e conti demo l’analisi si basa sui tick disponibili.
Importante
OrderFlux non esegue operazioni automatiche e non è un servizio di segnali.
Non apre né chiude posizioni.
Il suo scopo è visualizzare:
Order Flow
Footprint
Volume Profile
Market Profile
La decisione finale resta sempre del trader.
Manuale completo con immagini:
https://www.mql5.com/en/blogs/post/770245
Avvertenza di rischio: Il trading comporta rischi. I risultati passati non garantiscono risultati futuri.