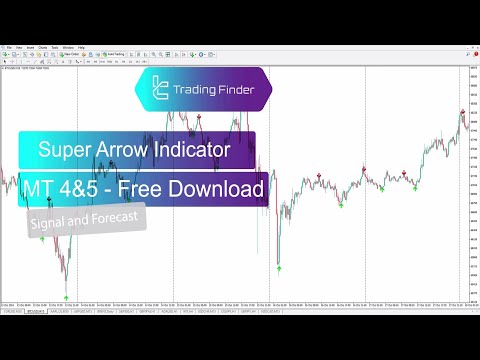
Super Arrow Indicator For MT4
- Indicators
- Mehnoosh Karimi
- Version: 3.1
- Activations: 10
Super Arrow Indicator for MetaTrader 4
The Super Arrow indicator is a popular signal tool designed for the MetaTrader 4 platform.
It combines multiple technical indicators—such as the RSI, Bollinger Bands, Moving Averages, and a Magic Filter—to identify key market reversal points and pivot highs and lows. On the chart, green arrows highlight pivot lows, while red arrows mark pivot highs.
By merging these indicators into one system, Super Arrow provides a strong filtering mechanism capable of detecting meaningful turning points. This makes it a valuable tool for traders looking for more accurate entry and exit signals based on reversal patterns.
Indicator Table
| Feature | Specification |
| Indicator Category | Signal and Forecast |
| Platforms | MetaTrader 4 |
| Trading Skills | Beginner |
| Indicator Types | Reversal – Lagging |
| Timeframes | M15, M30, H1, H4, D1 |
| Trading Style | Intraday, Day Trading, Swing Trading |
| Instruments | Forex, Crypto, Indices |
Overview
Relying on a single indicator can be risky, especially when different tools produce conflicting signals. By combining three or more indicators, traders can filter out weaker signals and focus on higher-probability opportunities.
This multi-indicator approach helps improve decision-making by offering a clearer view of price behavior and trend structure. In this system, a green arrow represents a buy signal in bullish market conditions, while a red arrow indicates a sell signal during bearish phases.
Buy Signals (Uptrends)
In the example below, the daily Bitcoin chart (BITCOIN) shows the Super Arrow identifying major pivot lows at points 1 and 2. A green arrow appears as a buy signal. Traders may use this signal alongside confirmation tools—such as candlestick patterns or reversal formations—before entering a position.
Sell Signals (Downtrends)
On the 4-hour gold chart (XAUUSD), the indicator marks pivot highs at points 1, 2, 3, and 4, issuing red arrows as sell signals. Adding support and resistance analysis can help validate these signals and strengthen confidence in trade entries.
Super Arrow Indicator Settings
- FasterMovingAverage: 5
- SlowerMovingAverage: 12
- RSIPeriod: 12
- MagicFilterPeriod: 1
- BollingerBandsPeriod: 10
- BollingerBandsShift: 0
- BollingerBandsDeviation: 0.5
- BullsPowerPeriod: 50
- BearsPowerPeriod: 50
- Alerts: True
- Utstup: 10
Conclusion
The Super Arrow indicator is effective in both trending and ranging markets across multiple timeframes. For instance, during an upward trend channel, a green arrow forming near the lower boundary may signal a strong buy opportunity. In a downward channel, a red arrow near the top can indicate a favorable sell setup.
By combining several indicators into one system, the Super Arrow helps traders gain an advantage through clearer, more reliable reversal signals.