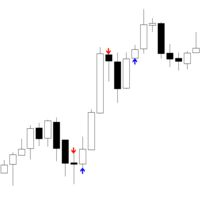
StructureFlow MT5
- Indicators
-
Vincent Jose Proenca
 I’ve been a trader for over ten years, mainly specializing in CFDs. What I love about trading is the logic, the discipline, and the process of creating tools that simplify decision-making. Since I couldn’t find indicators that fit my approach, I started coding them myself, first out of necessity
- Version: 2.0
- Activations: 5
Advanced Market Microstructure Analysis Indicator
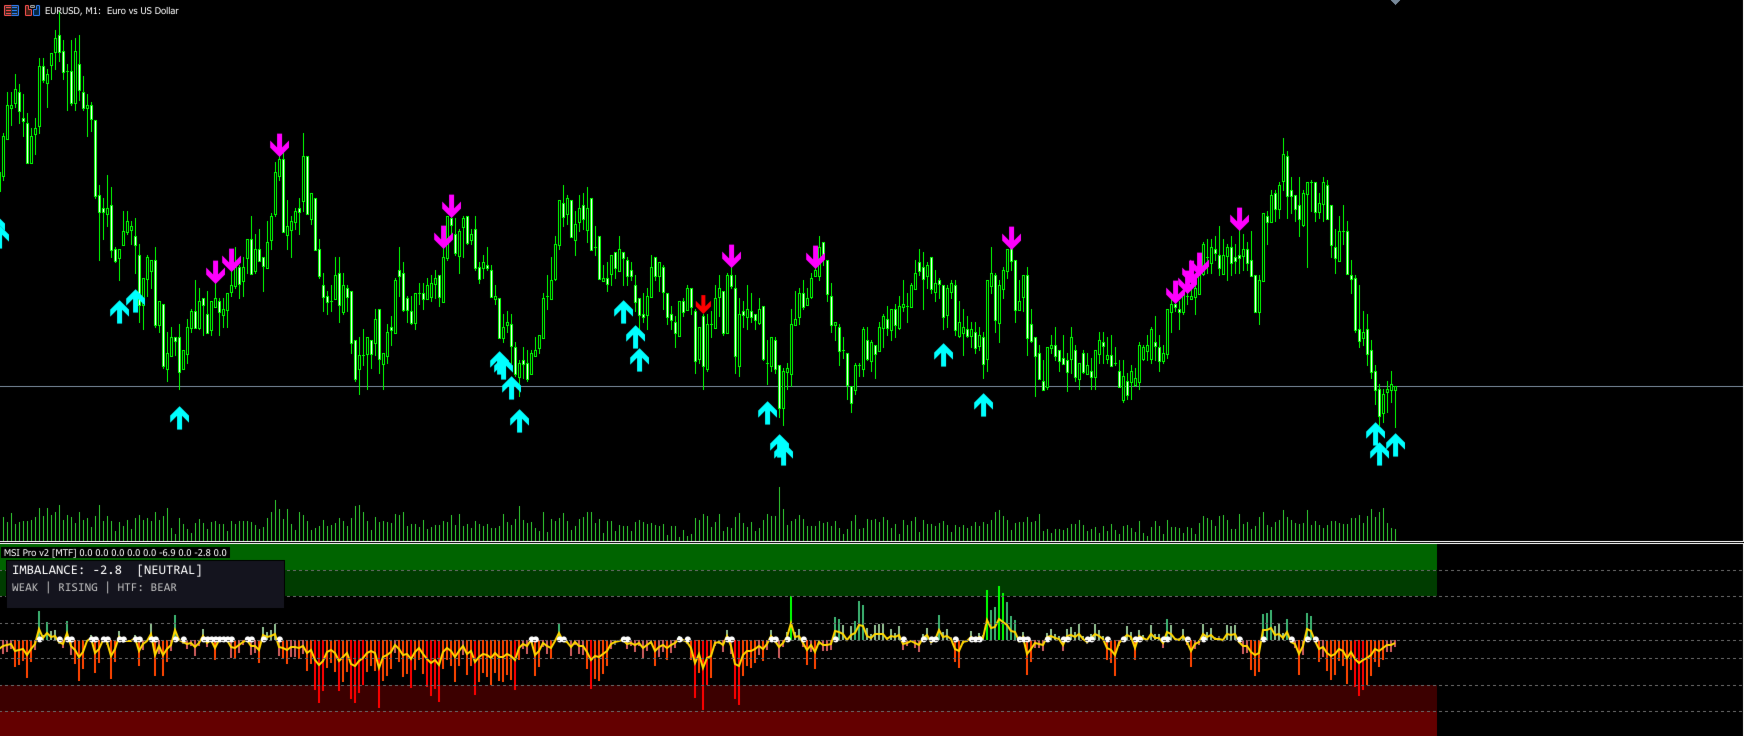
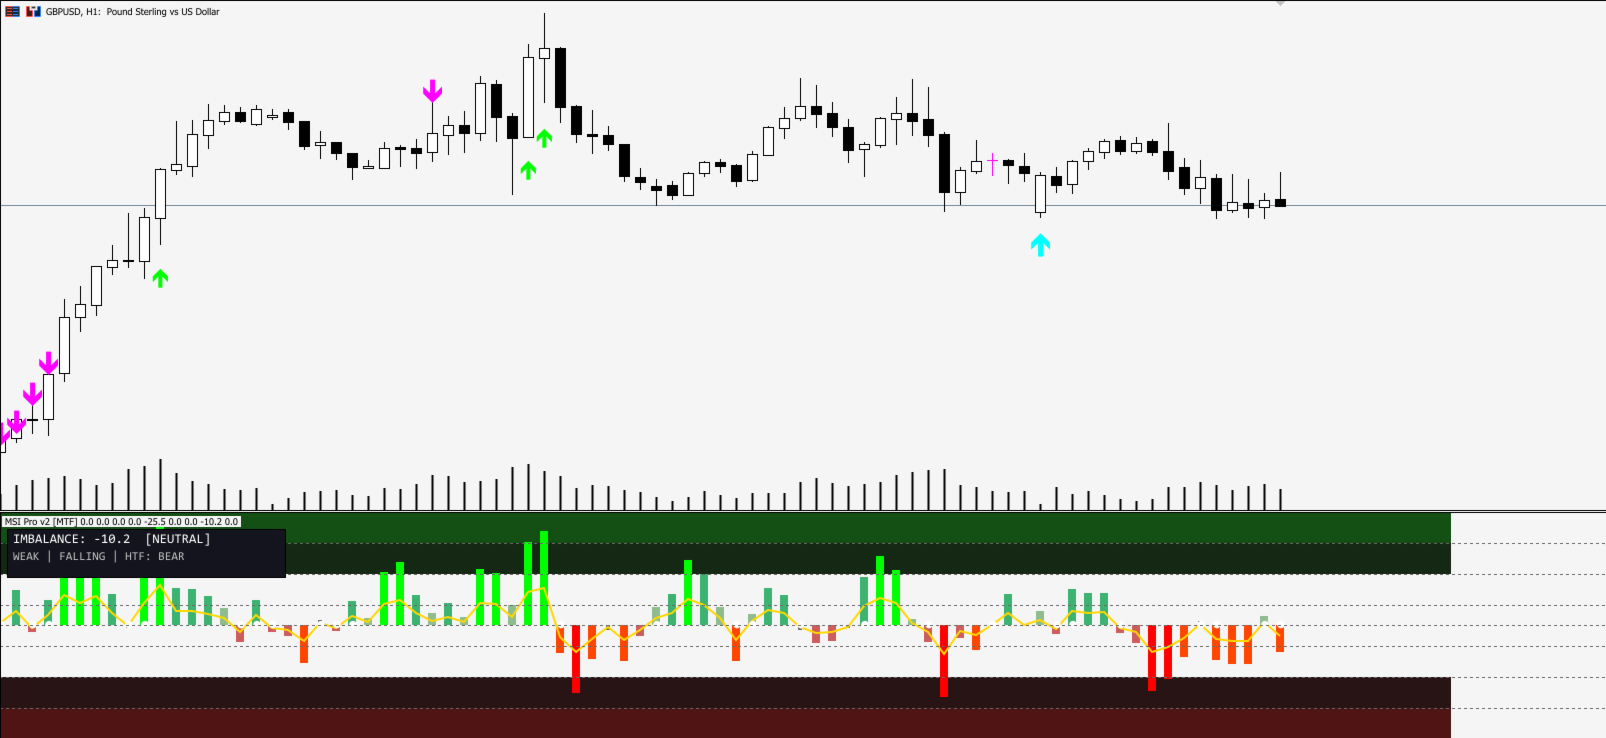
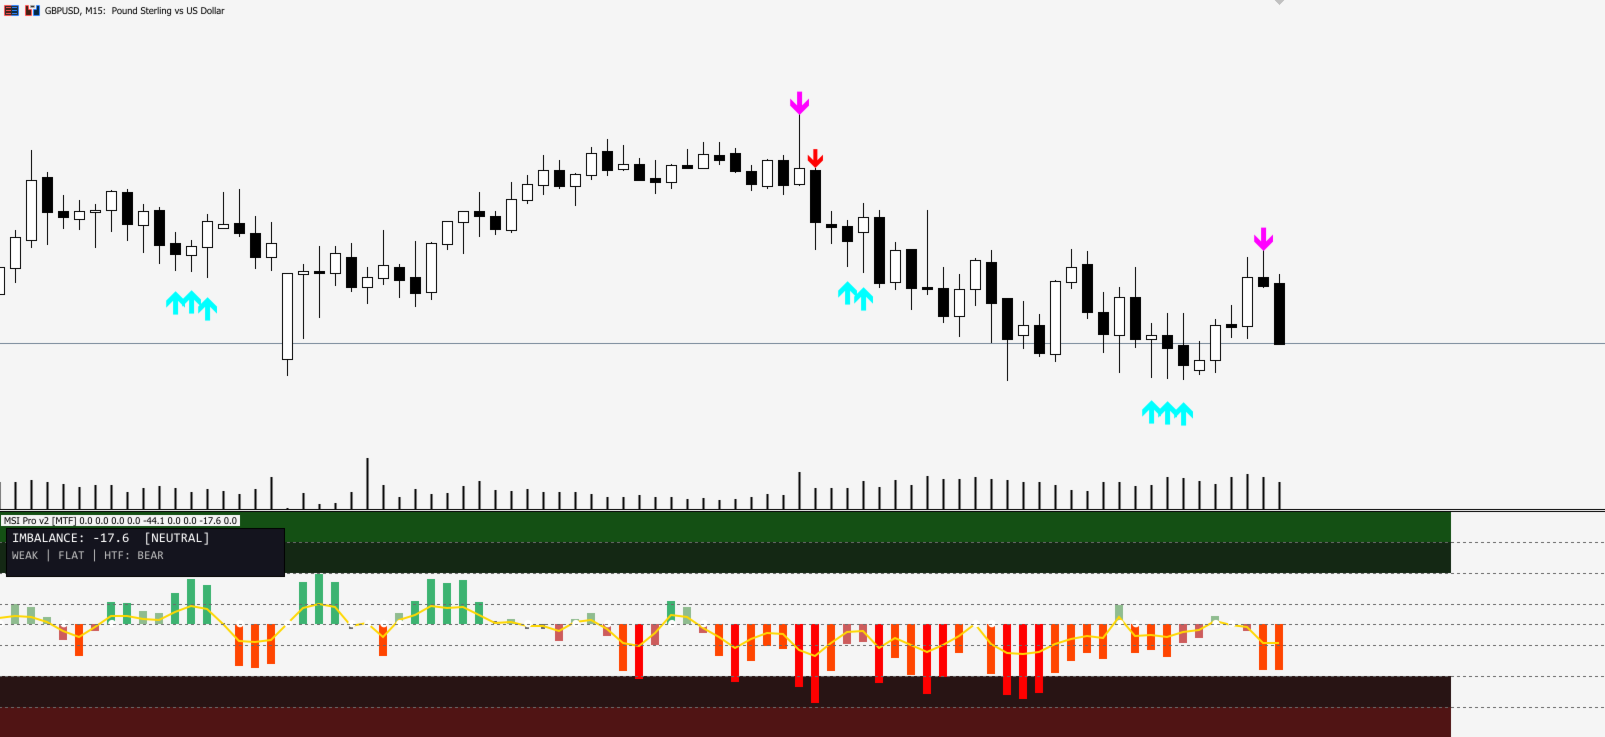
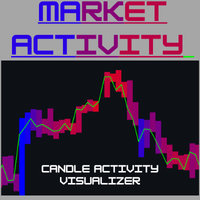
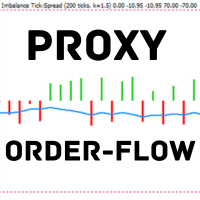
This indicator analyzes price action at a microscopic level to detect hidden imbalances before major moves occur. Unlike traditional indicators that only consider price, StructureFlow examines three critical dimensions:
Core Analysis
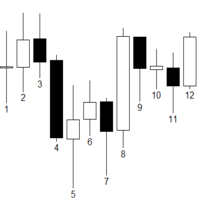
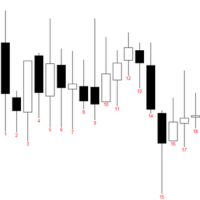
1. Candle Microstructure
-
Wick-to-body ratio analysis
-
Body position within the candle range
-
Expansion and contraction detection
-
Internal volatility anomalies
-
Engulfing pattern recognition
2. Market Tempo
-
Price velocity measurement
-
Micro-movement acceleration
-
Tempo contrast detection (early warning signals)
3. Reversal Probability
-
Pattern clustering algorithm
-
Historical similarity matching
-
Acceleration / rejection probability
Color Coding System
| Zone | Color | Meaning |
|---|---|---|
| +50 to +100 | Lime | Strong Bullish Imbalance |
| +20 to +50 | Medium Sea Green | Moderate Bullish |
| +5 to +20 | Dark Sea Green | Weak Bullish |
| -5 to +5 | Gray | Neutral |
| -20 to -5 | Indian Red | Weak Bearish |
| -50 to -20 | Orange Red | Moderate Bearish |
| -100 to -50 | Red | Strong Bearish Imbalance |
Background Zones
-
Dark Green: Extreme / Strong bullish territory
-
Dark Red: Extreme / Strong bearish territory
Signal Line
-
Gold — smoothed trend direction
Features
-
Multi-timeframe confirmation (HTF alignment)
-
Divergence detection with chart arrows
-
3 visual styles: Classic / Gradient / Filled
-
Customizable bar-height amplifier
-
Volume filter for higher-quality signals
-
Alert system (Popup / Sound / Push)
-
Professional info panel
-
Zero-cross markers
Recommended Settings
| Trading Style | Amplifier | Smoothing |
|---|---|---|
| Scalping (M1–M5) | 3.0 | EMA 2 |
| Intraday (M15–H1) | 2.5 | EMA 3 |
| Swing (H4–D1) | 2.0 | EMA 5 |
Signal Interpretation
-
Cross above 0: Bullish momentum building
-
Cross below 0: Bearish momentum building
-
Extreme zones (>70 / <−70): Possible reversal or continuation
-
Divergence: High-probability reversal signal
-
Color transition: Momentum shift warning