StructureFlow MT5
- 지표
-
Vincent Jose Proenca
 저는 10년 이상 트레이더로 일해 왔으며, 주로 CFD(차액결제거래)를 전문으로 하고 있습니다. 트레이딩에서 제가 가장 좋아하는 것은 논리, 규율, 그리고 의사결정을 단순화하는 도구를 만드는 과정입니다. 제 방식에 맞는 지표를 찾지 못해 처음에는 필요에 의해, 이후에는 즐거움으로 직접 코딩을 시작했습니다.
 - 버전: 2.0
- 활성화: 5
고급 시장 마이크로구조 분석 지표
이 지표는 가격 움직임을 미세한 수준에서 분석하여 큰 변동이 발생하기 전에 숨겨진 불균형을 탐지합니다. 단순히 가격만을 보는 기존 지표와 달리, StructureFlow는 다음의 세 가지 핵심 요소를 분석합니다.
핵심 분석
-
캔들 마이크로구조
-
위/아래 꼬리와 몸통 비율 분석
-
몸통의 범위 내 위치
-
확장/수축 감지
-
내부 변동성 이상치
-
장악형 패턴 인식
-
-
시장 템포
-
가격 속도 측정
-
마이크로 움직임 가속도
-
템포 대비 감지(선행 신호)
-
-
반전 확률
-
패턴 클러스터링 알고리즘
-
역사적 유사도 매칭
-
가속/거부 확률
-
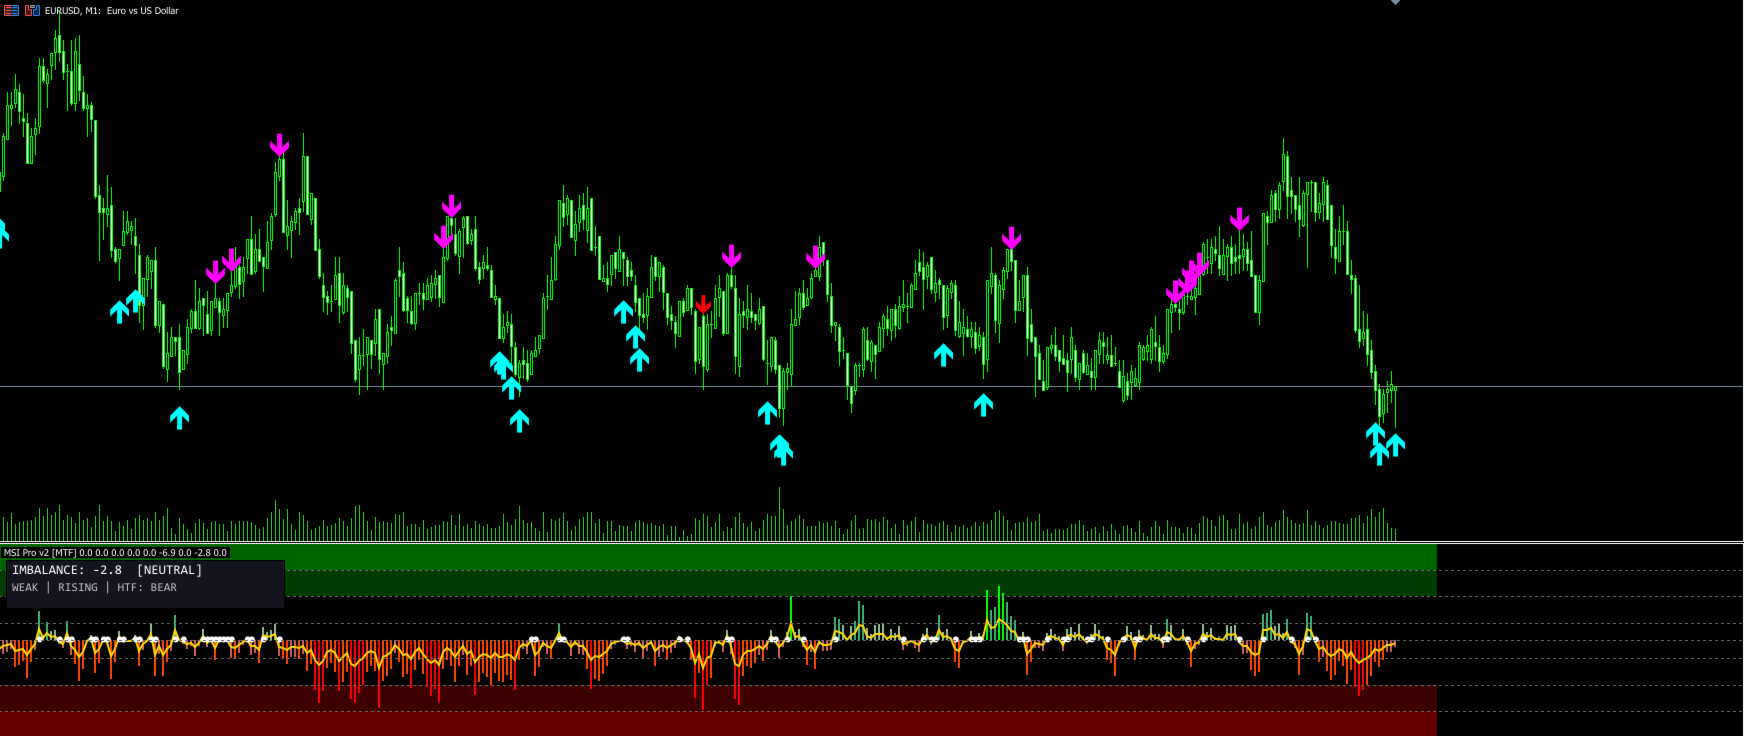
색상 코드 시스템
| 구간 | 색상 | 의미 |
|---|---|---|
| +50 ~ +100 | 라임 | 강한 상승 불균형 |
| +20 ~ +50 | 미디엄 시그린 | 중간 상승 |
| +5 ~ +20 | 다크 시그린 | 약한 상승 |
| -5 ~ +5 | 회색 | 중립 |
| -20 ~ -5 | 인디안 레드 | 약한 하락 |
| -50 ~ -20 | 오렌지 레드 | 중간 하락 |
| -100 ~ -50 | 빨강 | 강한 하락 불균형 |
배경 영역:
-
진한 초록: 극강 상승 구간
-
진한 빨강: 극강 하락 구간
신호선: 금색 — 평활화된 추세 방향
기능
-
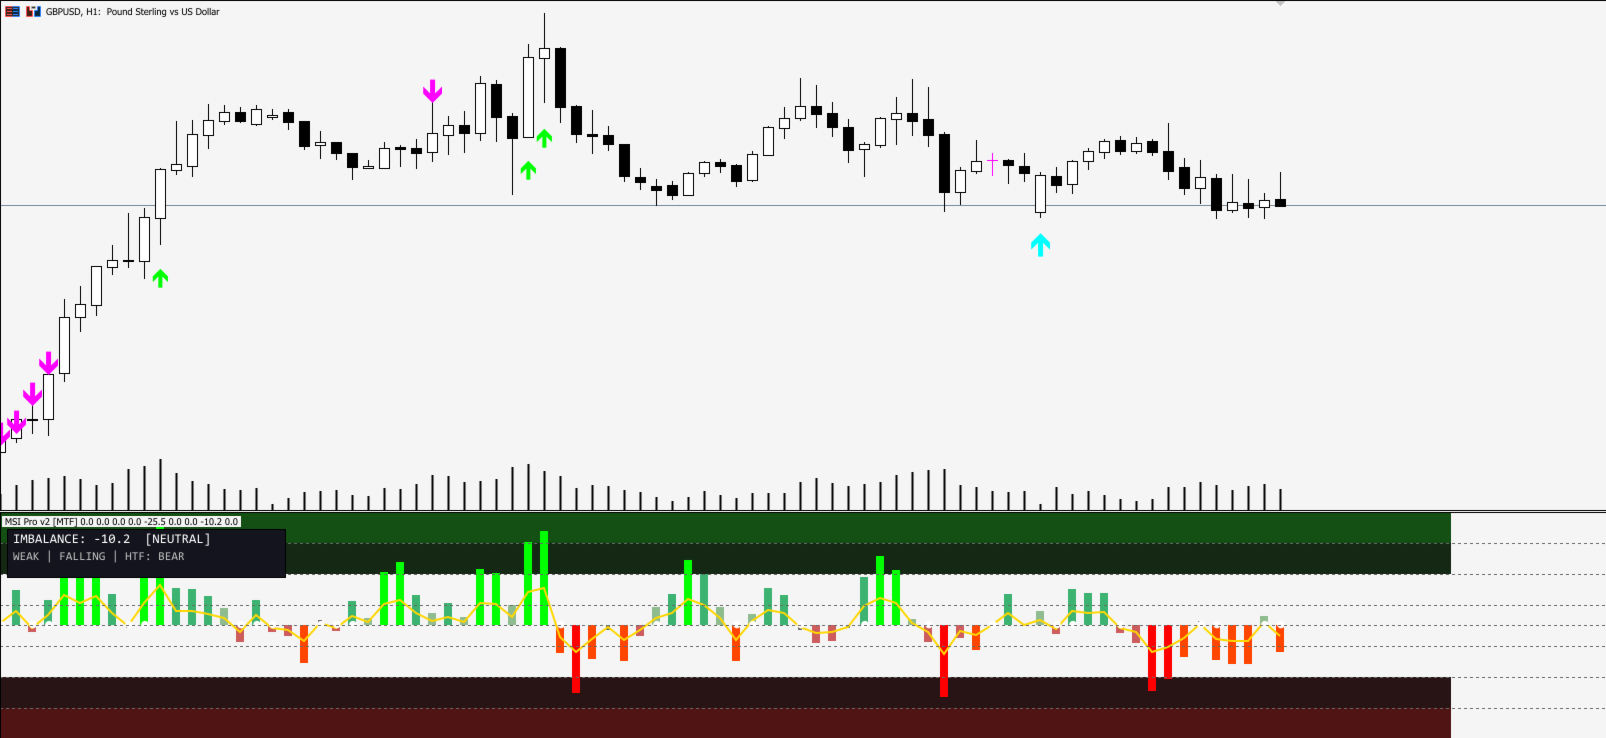
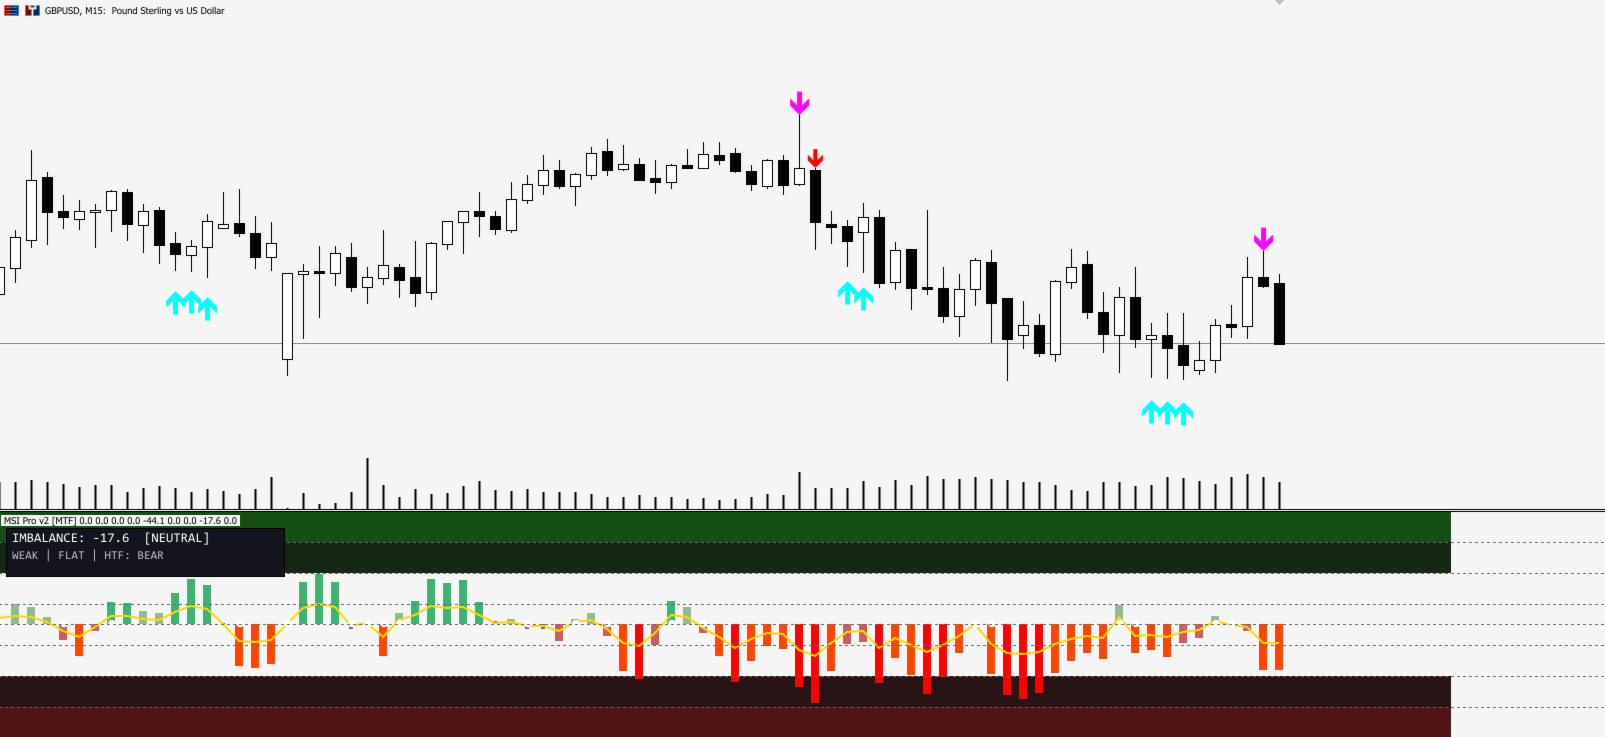
멀티타임프레임 확인(HTF 정합성)
-
다이버전스 감지(차트 화살표 포함)
-
3가지 시각 스타일: Classic / Gradient / Filled
-
바 높이 증폭 조절
-
고품질 신호를 위한 거래량 필터
-
알림 시스템(팝업 / 사운드 / 푸시)
-
전문 정보 패널
-
제로선 교차 마커
추천 설정
-
스캘핑 (M1–M5): 증폭 3.0, EMA 스무딩 2
-
단타/데이트레이딩 (M15–H1): 증폭 2.5, EMA 3
-
스윙 (H4–D1): 증폭 2.0, EMA 5
신호 해석
-
0 위로 돌파: 상승 모멘텀 증가
-
0 아래로 돌파: 하락 모멘텀 증가
-
극단 구간 (>70 / <−70): 반전 또는 지속 가능성
-
다이버전스: 고확률 반전 신호
-
색상 변화: 모멘텀 전환 경고