Volume Profile Density v2

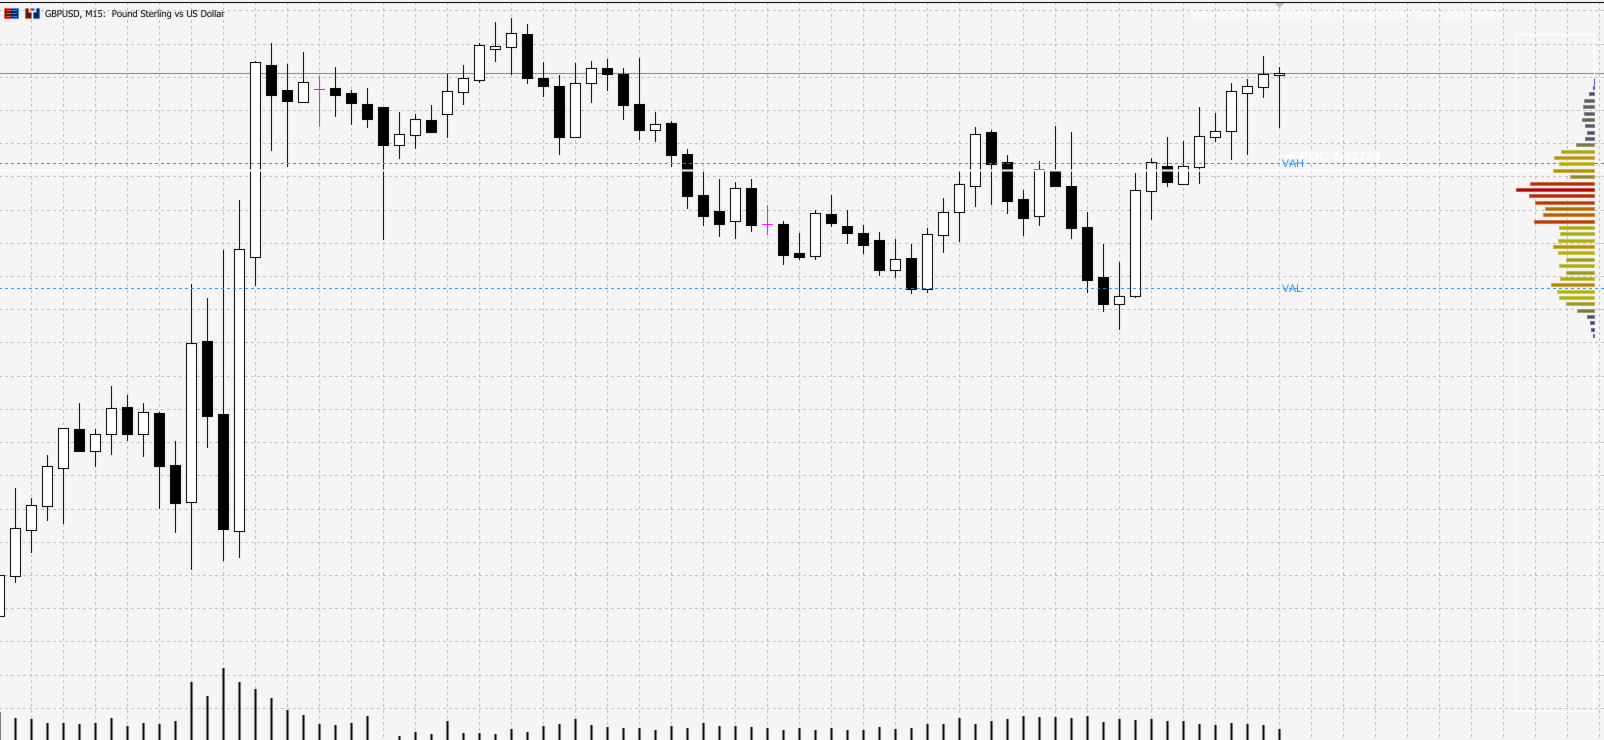
Volume Profile Density V2.40

가격 수준별 거래량 분포를 표시하여 기관 투자자의 관심 구간을 보여줍니다.
시간 기반 거래량과 달리, 실제 거래가 집중된 위치를 보여줍니다.

기본 원리:

  • 수평 막대 = 가격별 거래량

  • 막대가 길수록 거래량이 많음

  • 빨간 구간 = 주요 지지 / 저항 구간
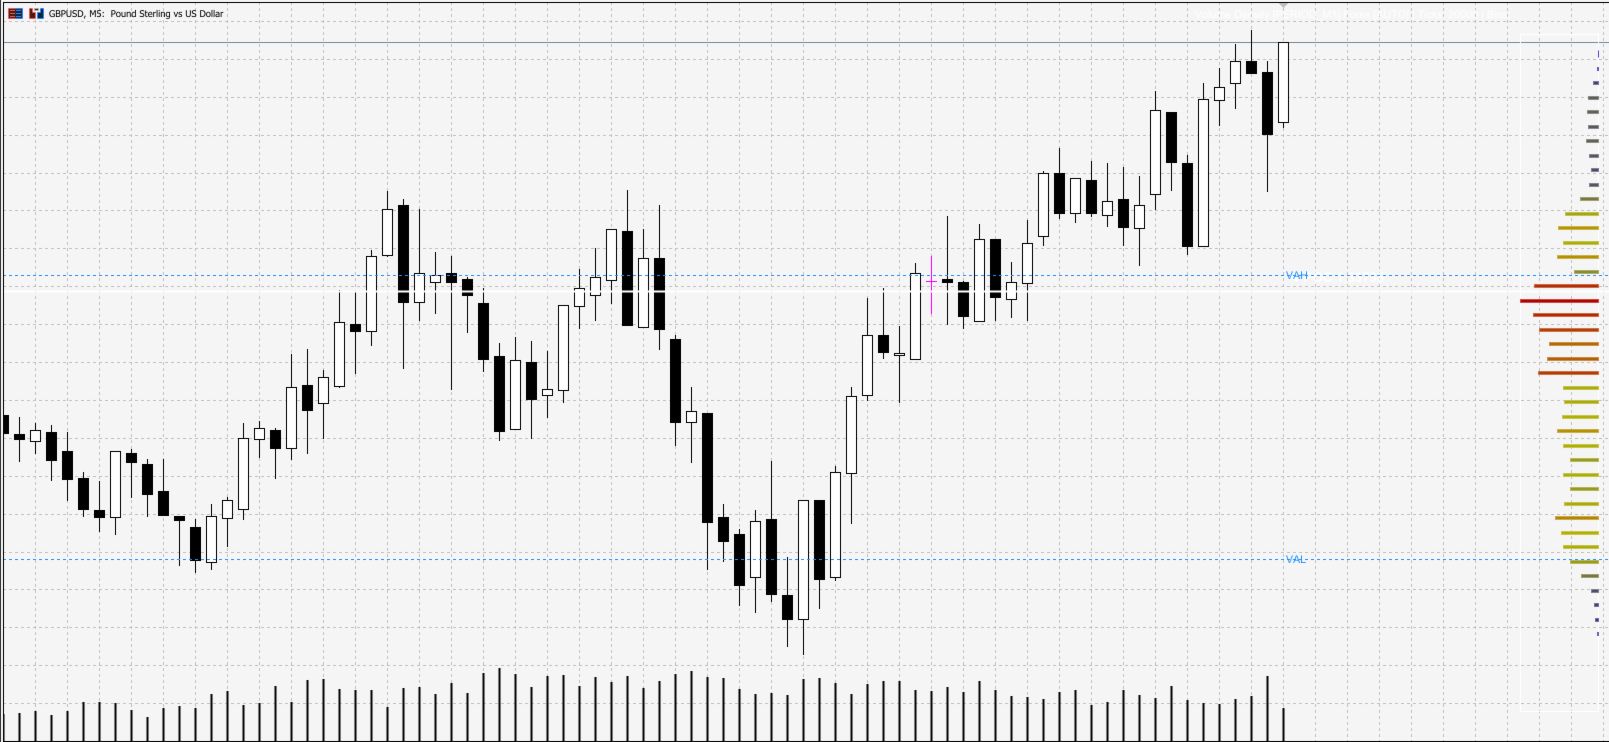
주요 사용 목적:

  • 실제 지지선과 저항선 식별

  • POC (Point of Control) 확인

  • 가치 영역 (총 거래량의 70%) 설정

  • 낮은 거래량 구간을 손절 / 목표 지점으로 활용

색상 코드:

  • 파란색 = 낮은 거래량 (빠른 이동 구간)

  • 노란색 = 중간 거래량 (균형 구간)

  • 빨간색 = 높은 거래량 (기관 매매 구간)

트레이딩 전략:

  • 빨간 구간 반등 시 매수

  • VAH 또는 빨간 구간 저항 시 매도

  • 거래량 동반 POC 돌파 시 진입

  • POC 회귀 시 재진입

  • 파란 구간을 목표로 설정

설정:

  • 초보자: 1.0 / 100% / 1.0

  • 스캘핑: 0.5 / 200% / 0.5

  • 스윙: 2.0 / 50% / 1.5

기술 정보:

  • 버전: 2.40

  • 플랫폼: MT5

  • 자산: 외환, CFD, 금속, 암호화폐

  • 기간: M1–M15

  • 유형: 실시간 자동 조정형 지표

요약:
거래량은 거짓말하지 않는다. 거래량 구간에 따라 매매하라, 그에 역행하지 말라.

추천 제품
(Special New Year promotion - free price!) The indicator displays the actual 'Scale in points per bar' (identical to the manual setting in the Terminal, see screenshot) in the upper right corner of the chart. The displayed value changes INSTANTLY whenever the chart scale is changed! (This is very convenient when planning screenshots). In Settings: Change language (Russian/English), font size of the displayed text, text label offset coefficient from the graph corner, equally in X and Y directi
FREE
VisualVol EURUSD
Maxim Kuznetsov
The indicator highlights the points that a professional trader sees in ordinary indicators. VisualVol visually displays different volatility indicators on a single scale and a common align. Highlights the excess of volume indicators in color. At the same time, Tick and Real Volume, Actual range, ATR, candle size and return (open-close difference) can be displayed. Thanks to VisualVol, you will see the market periods and the right time for different trading operations. This version is intended f
FREE
Aggression Volume
Flavio Javier Jarabeck
4.29 (17)
Aggression Volume Indicator is the kind of indicator that is rarely found in the MQL5 community because it is not based on the standard Volume data provided by the Metatrader 5 platform. It requires the scrutiny of all traffic Ticks requested on the platform... That said, Aggression Volume indicator requests all Tick Data from your Broker and processes it to build a very special version of a Volume Indicator, where Buyers and Sellers aggressions are plotted in a form of Histogram. Additionally,
FREE
Mirror Chart MT5
Andrej Hermann
5 (1)
The Mirror Chart MT5 is a overlay indicator specifically designed to project a second financial instrument directly onto the main chart window. This tool is invaluable for traders who rely on correlation analysis, as it visualizes the price movements of two different instruments in real time. Unlike traditional overlays, this indicator utilizes intelligent, dynamic centering and scaling logic. It continuously analyzes the visible price range in the current window for both symbols and calculates
FREE
Value Chart Candlesticks
Flavio Javier Jarabeck
4.57 (14)
The idea of a Value Chart indicator was presented in the very good book I read back in 2020 , " Dynamic Trading Indicators: Winning with Value Charts and Price Action Profile ", from the authors Mark Helweg and David Stendahl. The idea is simple and the result is pure genius: Present candlestick Price analysis in a detrended way! HOW TO READ THIS INDICATOR Look for Overbought and Oversold levels. Of course, you will need to test the settings a lot to find the "correct" one for your approach. It
FREE
Elevate Your Trading with Advanced Anchored Volume Weighted Average Price Technology Unlock the true power of price action with our premium Anchored VWAP Indicator for MetaTrader 5 - the essential tool for precision entries, strategic exits, and high-probability trend continuation setups. Write me a DM for a 7 day free trial.  Anchored VWAP Plus gives traders unprecedented control by allowing custom anchor points for Volume Weighted Average Price calculations on any chart. With support for 4 sim
FREE
Weis Waves
Flavio Javier Jarabeck
2.83 (18)
The original author is David Weis, an expert in the Wyckoff Method. The Weis Wave is a modern adaptation of the 1930's Wyckoff Method, another expert in Tape Reading techniques and Chart Analysis. Weis Waves takes market volume and stacks it into waves according to price conditions giving the trader valuable insights about the market conditions. If you want to learn more about this subject you can find tons of videos in YouTube. Just look for "The Wickoff Method", "Weis Wave" and "Volume Spread
FREE
VP hidden
Emr Aljnaby
4.33 (12)
The indicator works to convert normal volume into levels and determine financial liquidity control points. It is very similar in function to Fixed Volume Profile. But it is considered more accurate and easier to use than the one found on Trading View because it calculates the full trading volumes in each candle and in all the brokers present in MetaTrade, unlike what is found in Trading View, as it only measures the broker’s displayed prices. To follow us on social media platforms: telegram
FREE
Rolling vwap atr market panel
Florian Alain Bernard Jean-paul Pierre Cuiset
Rolling VWAP + ATR Bands + Market Panel — powerful visual tool for scalping, extensions detection and intraday market structure analysis. Rolling VWAP + Panel Rolling VWAP + Panel is a professional MetaTrader 5 indicator designed to analyze market structure using a Rolling Volume Weighted Average Price (VWAP) combined with ATR-based volatility bands , a real-time market analysis panel , and an integrated candle countdown timer . This indicator provides a clear and structured view of price beha
FREE
Donchian Breakout And Rsi
Mattia Impicciatore
4.5 (2)
개요 이 지표는 클래식 돈치안 채널(Donchian Channel) 의 향상된 버전으로, 실전 트레이딩을 위한 다양한 기능이 추가되었습니다. 표준 세 개의 선(상단, 하단, 중앙선) 외에도 브레이크아웃 을 감지하여 차트에 화살표로 시각적으로 표시하며, 차트를 깔끔하게 보기 위해 현재 추세 방향의 반대 라인만 표시 합니다. 지표 기능: 시각적 신호 : 브레이크아웃 시 컬러 화살표 표시 자동 알림 : 팝업, 푸시 알림, 이메일 RSI 필터 : 시장의 상대 강도를 기반으로 신호 검증 사용자 맞춤 설정 : 색상, 선 두께, 화살표 코드, RSI 임계값 등 동작 원리 돈치안 채널은 다음을 계산합니다: 상단선 : 최근 N개의 종가 완료 캔들에서 가장 높은 고가 하단선 : 최근 N개의 종가 완료 캔들에서 가장 낮은 저가 중앙선 : 고가와 저가의 평균값 상방 브레이크아웃 은 종가가 상단선을 돌파할 때 발생하며, 하방 브레이크아웃 은 종가가 하단선 아래로 내려갈 때 발생합니다. 이 지표는: 세 개의
FREE
Aggression Wave RSJ
JETINVEST
4.57 (7)
This indicator sums up the difference between the sells aggression and the buys aggression that occurred in each Candle, graphically plotting the waves of accumulation of the aggression volumes.   Through these waves an exponential average is calculated that indicates the direction of the business flow. Note: This indicator DOES NOT WORK for Brokers and/or Markets WITHOUT the type of aggression (BUY or SELL).   Be sure to try our Professional version with configurable features and alerts:  Agre
FREE
Simple QM Pattern MT5
Suvashish Halder
3.33 (3)
Simple QM Pattern   is a powerful and intuitive trading indicator designed to simplify the identification of the Quasimodo (QM) trading pattern. The QM pattern is widely recognized among traders for effectively signaling potential   reversals   by highlighting key market structures and price action formations. This indicator helps traders easily visualize the QM pattern directly on their charts, making it straightforward even for those who are new to pattern trading. Simple QM Pattern includes d
FREE
Overview Market Volume Profile Modes is a powerful MT5 volume distribution indicator that integrates multiple Volume Profile variants. Users can switch between different analysis modes through a simple menu selection. This indicator helps traders identify key price levels, support and resistance zones, and market volume distribution. Core Concepts • POC (Point of Control): The price level with the highest volume concentration, representing the market's accepted "fair value" area • VAH (Value A
FREE
Simple Anchored VWAP MT5
Suvashish Halder
4.75 (4)
Simple Anchored VWAP   is a lightweight yet powerful tool designed for traders who want precise volume-weighted levels without complexity. This indicator lets you anchor VWAP from any point on the chart and instantly see how price reacts around institutional volume zones. MT4 Version - https://www.mql5.com/en/market/product/155320 Join To Learn Market Depth -   https://www.mql5.com/en/channels/suvashishfx Using VWAP bands and dynamic levels, the tool helps you understand where real buying and s
FREE
Enhanced Volume Profile: The Ultimate Order Flow & Liquidity Analysis Tool Overview Enhanced Volume Profile is an indicator for MetaTrader 5 that displays the traded volume at specific price levels over a defined period. It separates the total volume into buy and sell components, presenting them as a side-by-side histogram on the chart. This allows users to observe the volume distribution and the proportion of buy and sell volumes at each price level. Graphics Rendering The indicator uses the
FREE
BoxInside MT5
Evgeny Shevtsov
5 (4)
This indicator calculates the volume profile and places labels that correspond to the VAH, VAL and POC levels, for each candle individually. Indicator operation features The indicator works on the timeframes from M3 to MN, but it uses the history data of smaller periods: M1 - for periods from M3 to H1, M5 - for periods from H2 to H12, M30 - for the D1 period, H4 - for the W1 period, D1 - for the MN period. The color and location of the VAL, VAH and POC labels on the current candle are considere
FREE
Waves Sizer
Flavio Javier Jarabeck
3.86 (7)
Wyckoff fans, enjoy! Ideally to be used with the Weis Waves indicator, but it can be easily used alone, the Waves Sizer puts the range (in resulting Price movement) done by the Price on its market swings. You can control how accurate or loose will be the swings. This tool is very helpful for visually know how much the Price has traveled in your Timeframe. This way you can confront this level of effort with the resulting Volume, etc... Weis Waves indicator: https://www.mql5.com/en/market/produc
FREE
Haven Volume Profile
Maksim Tarutin
4.55 (11)
Haven Volume Profile은 거래량 분포를 기반으로 중요한 가격 수준을 식별하는 데 도움이 되는 다기능 볼륨 프로파일 분석 지표입니다. 시장을 더 잘 이해하고 중요한 진입 및 퇴장 지점을 식별하려는 전문 트레이더를 위해 설계되었습니다. 기타 제품 ->  여기 주요 기능: Point of Control (POC) 계산 - 최대 거래 활동 수준으로, 가장 유동성이 높은 수준을 식별하는 데 도움이 됩니다 Value Area 정의 (높은 활동 영역) 및 사용자 지정 가능한 거래량 비율로 거래 범위를 보다 정확하게 평가할 수 있습니다 틱 거래량과 실제 거래량 모두 지원, 다양한 시장 유형과 거래 전략에 적합 계산 기간(일 수)의 유연한 설정으로 모든 시간 프레임에 도구를 적용할 수 있습니다 터미널의 밝은 테마와 어두운 테마에 자동 적응하여 사용자 인터페이스의 시각적 경험을 향상시킵니다 레벨 시각화가 명확하고 스타일과 색상을 사용자 지정할 수 있어 빠른 의사 결정을 돕습니다 이 지표
FREE
Donchian Pro
Paulo Henrique Faquineli Garcia
4.75 (4)
The Donchian Channel Channels are among the most popular tools of technical analysis, as they visually convey to the analyst the limits within which most price movement tends to occur. Channel users know that valuable information can be obtained at any time, whether prices are in the central region of a band or close to one of the border lines. One of the best known techniques to explore these concepts is Bollinger Bands. However, John Bollinger was not the only one to research the application
FREE
VM Auto SLTP Basic
Van Minh Nguyen
5 (1)
VM Auto SLTP Basic - Intelligent Trade Management for Scalpers Enhance your scalping strategy to a higher level. VM Auto SLTP Basic automatically manages Stop Loss and Take Profit for orders that are opened manually or by other Expert Advisors. This tool does not open trades on its own, allowing you to maintain full control while enjoying precise risk management. Key Features: SL/TP based on ATR or fixed price Automatic SL move to Breakeven Enhanced Breakeven system with 2 modes: Points and R (r
FREE
Basic Vwap
james mugendi
4 (1)
Simple Vwap with the daily, weekly and monthly VWAP is the abbreviation for   volume-weighted average price , which is a technical analysis tool that shows the ratio of an asset's price to its total trade volume. It provides traders and investors with a measure of the average price at which a stock is traded over a given period of time. How it's used Identify entry and exit points:   Traders can use VWAP to determine when to buy or sell an asset.   Understand price trends :  Traders can use V
FREE
Expansoes M
Marcus Vinicius Da Silva Miranda
The M Extensions are variations of the Golden Ratio (Fibonacci Sequence). It is the World's first technique developed for Candle Projections. Advantages: Easy to plot. Candle anchoring; High and accurate precision as support and resistance; Excellent Risk x Return ratio; Works in any timeframe; Works in any asset / market.   The M Extensions are classified into: M0: Zero point (starting candle) RC: Initial candle control region M1: Extension region 1 M2: Extension region 2 M3: Extension regi
FREE
UT Alart Bot
Menaka Sachin Thorat
4.75 (4)
To get access to MT4 version please click  https://www.mql5.com/en/market/product/130055&nbsp ; - This is the exact conversion from TradingView: "Ut Alart Bot Indicator". - You can message in private chat for further changes you need. Here is the source code of a simple Expert Advisor operating based on signals from Ut Bot Indicator . #property copyright "This EA is only education purpose only use it ur own risk" #property link " https://sites.google.com/view/automationfx/home " #property versio
FREE
Premium https://www.mql5.com/en/market/product/167272 BITCOIN DAILY TOP BOTTOM ENGINE (V1) This is not a simple indicator. This is a professional-grade market observation and decision engine designed for serious Bitcoin traders who demand clarity, structure, and precision. The Bitcoin Daily Top Bottom Engine is built to identify high-probability daily extremes using adaptive range logic, sweep behavior analysis, and market condition filtering. Instead of reacting late, this engine prepares y
FREE
RSI abcd
Francisco Gomes Da Silva
4.33 (3)
RSI ABCD 패턴 파인더: 기술적 전략 1. 지표 작동 방식 클래식 RSI 와 ABCD 하모닉 패턴 자동 감지를 결합합니다. 주요 구성 요소 표준 RSI (조정 가능한 기간) 고점 및 저점 마커 (화살표) ABCD 패턴 (초록/빨강 선) 과매수 (70) 및 과매도 (30) 필터 2. MT5 설정 period = 14 ; // RSI 기간 size = 4 ; // 최대 패턴 크기 OverBought = 70 ; // 과매수 수준 OverSold = 30 ; // 과매도 수준 Filter = USE_FILTER_ YES ; // 확인 필터 3. 트레이딩 전략 3.1. 매수 진입 (강세 ABCD) 조건: RSI가 다음을 형성: 저점 ( A ) → 고점 ( B ) → 더 높은 저점 ( C ) D 는 과매도 (30) 위지만 C 아래 확인: A-B-C-D 연결 초록 선 목표: TP1: B-C의 61.8% TP2: B-C의 100% 손절: D 아래 3.2. 매도 진입 (약세 ABCD) 조건:
FREE
VWAP Personnal Custom
Vincent Jose Proenca
VWAP_PC_MQL5 — a simple home-built VWAP indicator showing real-time volume-weighted price levels directly on your MT5 chart. TF: Works on all timeframes. Pair: Compatible with all symbols — Forex, indices, commodities, and stocks. Settings: Applied Price – price type used for VWAP calculation (Close, Typical, Weighted, etc.) Line Color / Width / Style – customize VWAP line appearance Session Reset – optional reset per day or continuous mode How it works (VWAP principle): VWAP (Volume Weighted
FREE
Order Book, known also as Market Book, market depth, Level 2, - is a dynamically updated table with current volumes of orders to buy and to sell specific financial instument at price levels near Bid and Ask. MetaTrader 5 provides the means for receiving market book from your broker, but in real time only, without access to its history. This expert adviser OrderBook History Playback allows you to playback the market book events on the history using files, created by OrderBook Recorder . The exper
FREE
Tick Profile Free
Elia Burstein
5 (3)
This indicator will show a vertical representation of the volume distribution within a selected user range. This is a free version of the full product. It is limited to use on a week old data or older. Find the full product at  https://www.mql5.com/en/market/product/42234 . Main features: This Indicator will create an image that will allow viewing the tick volume per price level in a graphical form. The indicator will work on any range size in any time-frame, limited only by your computer mem
FREE
MIDAS Super VWAP
Flavio Javier Jarabeck
4.27 (11)
Imagine VWAP, MVWAP and MIDAS in one place... Well, you found it! Now you can track the movement of Big Players in various ways, as they in general pursue the benchmarks related to this measuring, gauging if they had good execution or poor execution on their orders. Traders and analysts use the VWAP to eliminate the noise that occurs throughout the day, so they can measure what prices buyers and sellers are really trading. VWAP gives traders insight into how a stock trades for that day and deter
FREE
AP Session Boxes Pro
Allan Graham Pike
AP Session Boxes — Asian / London / NY Range Overlay (MT5 Indicator) Clean session boxes on your chart. This lightweight indicator draws the   Asian ,   London , and   New York   time windows directly on the chart, including each box’s   high   and   low   as dashed lines. It’s perfect for quick context, breakout planning, and clean screenshots. Instant structure:   See where the market ranged during key sessions. Breakout prep:   Use the hi/lo lines as reference for pending orders or alerts fr
FREE
이 제품의 구매자들이 또한 구매함
ARIPoint
Temirlan Kdyrkhan
ARIPoint is a powerful trading companion designed to generate high-probability entry signals with dynamic TP/SL/DP levels based on volatility. Built-in performance tracking shows win/loss stats, PP1/PP2 hits, and success rates all updated live. Key Features: Buy/Sell signals with adaptive volatility bands Real-time TP/SL/DP levels based on ATR Built-in MA Filter with optional ATR/StdDev volatility Performance stats panel (Success, Profit/Loss, PP1/PP2) Alerts via popup, sound, push, or email Cu
SuperScalp Pro
Van Minh Nguyen
4.63 (24)
SuperScalp Pro – 고급 멀티 필터 스캘핑 지표 시스템 SuperScalp Pro는 클래식 Supertrend와 여러 지능형 확인 필터를 결합한 고급 스캘핑 지표로, 거래 기회를 식별하는 데 도움을 줍니다. M1부터 H4까지 다양한 시간대에서 효율적으로 작동하며, XAUUSD, BTCUSD 및 주요 Forex 통화쌍에 최적화되어 있습니다. 이 지표는 명확한 매수 및 매도 신호를 제공하며, ATR 기반으로 진입가, 손절가, 익절가를 자동 계산하여 보다 효과적인 리스크 관리를 지원합니다. Fibonacci Take Profit 기능은 중요한 가격 구간에서 더 빠르게 포지션을 청산할 수 있도록 하며, 해당 수준 도달 시 알림을 전송합니다. 기본 설정은 Fibonacci Take Profit이 활성화된 상태로 최적화되어 있으며, 보다 안정적이고 일관된 거래 경험에 중점을 둡니다. 차트에 적용하는 것만으로 즉시 사용할 수 있습니다. 고급 사용자를 위해 모든 파라미터는 자유롭게 사용
Divergence Bomber
Ihor Otkydach
4.9 (89)
이 지표를 구매하신 분께는 다음과 같은 혜택이 무료로 제공됩니다: 각 거래를 자동으로 관리하고, 손절/익절 수준을 설정하며, 전략 규칙에 따라 거래를 종료하는 전용 도우미 툴 "Bomber Utility" 다양한 자산에 맞게 지표를 설정할 수 있는 셋업 파일(Set Files) "최소 위험", "균형 잡힌 위험", "관망 전략" 모드로 설정 가능한 Bomber Utility의 셋업 파일 이 전략을 빠르게 설치, 설정, 시작할 수 있도록 돕는 단계별 영상 매뉴얼 주의: 위의 모든 보너스를 받기 위해서는 MQL5 개인 메시지 시스템을 통해 판매자에게 연락해 주세요. 독창적인 커스텀 지표인 “Divergence Bomber(다이버전스 봄버)”를 소개합니다. 이 지표는 MACD 다이버전스(괴리) 전략을 기반으로 한 올인원(All-in-One) 거래 시스템입니다. 이 기술 지표의 주요 목적은 가격과 MACD 지표 간의 다이버전스를 감지하고, **향후 가격이 어느 방향으로 움직일지를 알려주는
Entry In The Zone and SMC Multi Timeframe is a real-time 2-in-1 market analysis tool that combines market structure analysis and a No Repaint BUY / SELL signal system into a single indicator, built on Smart Money Concepts (SMC) — a widely adopted framework used by professional traders to understand market structure. This indicator helps you see the market more clearly, make decisions based on structure rather than guesswork, and focus on high-probability zones where price is more likely to react
Gold Entry Sniper
Tahir Mehmood
5 (9)
Gold Entry Sniper – 골드 스캘핑 & 스윙 트레이딩을 위한 전문 다중 시간 프레임 ATR 대시보드 Gold Entry Sniper 는 XAUUSD 및 기타 종목에 대해 정확한 매수/매도 신호 를 제공하는 고급 MetaTrader 5 지표입니다. ATR 트레일링 스톱 로직 과 다중 시간 프레임 분석 을 기반으로 설계되어 스캘핑과 스윙 트레이딩 모두에 적합합니다. 주요 기능 및 장점 다중 시간 프레임 분석 – M1, M5, M15 추세를 한눈에 확인. ATR 기반 트레일링 스톱 – 변동성에 따라 자동 조정. 전문 차트 대시보드 – 신호 상태, ATR 레벨, 회귀선, 매매 방향 표시. 명확한 매수/매도 마커 – 자동 화살표와 텍스트 라벨. 종료 알림 & 거래 관리 – 수익 보호를 위한 자동 종료 감지. 완전 사용자 설정 가능 – 대시보드 위치, 색상, ATR/회귀선 파라미터 조정. 골드(XAUUSD) 최적화 – M1~M15 스캘핑에 완벽, 외환/지수/암호화폐에도 적용 가능.
Power Candles MT5
Daniel Stein
5 (8)
Power Candles V3 - 자체 최적화 강도 지표 파워 캔들 V3는 적용된 모든 차트에서 통화 및 상품의 강세를 실행 가능한 거래 계획으로 전환합니다. 단순히 캔들에 색상을 입히는 대신, 백그라운드에서 실시간 자동 최적화를 수행하여 현재 보고 있는 종목에 대한 최적의 손절매, 익절 및 신호 임계값을 제공합니다. 한 번의 클릭으로 실시간 거래에 적용할 수 있으며, 진입점, 손절매 및 익절 선이 정확한 가격에 맞춰 차트에 표시되고, 방향과 함께 알림이 발령됩니다. 이 도구는 Stein Investments 에코시스템의 일부입니다. 18개 이상의 도구와 함께 당신의 1대1 AI 트레이딩 멘토 Max.  항상 대기 중, 모든 인디케이터를 깊이 있게 이해, 무언가를 차근차근 생각해보고 싶은 순간에 도움을 줍니다.  https://stein.investments 에서 만나보세요 매 종가 바마다 3,000회 이상의 트레이딩 시뮬레이션. 9가지 강도 상태. 2가지 전략을 병렬로 테스트.
이 지표를 구매하면 제 프로페셔널 트레이드 매니저를 무료로 드립니다. 우선 이 거래 시스템이 리페인팅, 리드로잉 및 레이그 인디케이터가 아니라는 점을 강조하는 것이 중요합니다. 이는 수동 및 로봇 거래 모두에 이상적인 것으로 만듭니다. 온라인 강좌, 설명서 및 프리셋 다운로드. "스마트 트렌드 트레이딩 시스템 MT5"은 새로운 및 경험이 풍부한 트레이더를 위해 맞춤형으로 제작된 종합적인 거래 솔루션입니다. 10개 이상의 프리미엄 인디케이터를 결합하고 7개 이상의 견고한 거래 전략을 특징으로 하여 다양한 시장 조건에 대한 다목적 선택이 가능합니다. 트렌드 추종 전략: 효과적인 트렌드 추이를 타기 위한 정확한 진입 및 손절 관리를 제공합니다. 반전 전략: 잠재적인 트렌드 반전을 식별하여 트레이더가 범위 시장을 활용할 수 있게 합니다. 스캘핑 전략: 빠르고 정확한 데이 트레이딩 및 단기 거래를 위해 설계되었습니다. 안정성: 모든 인디케이터가 리페인팅, 리드로잉 및 레이그가 아니므로 신뢰
SignalTech MT5
Yue Wang
5 (21)
SignalTech MT5 is a fully rule based trading system for EURUSD, USDCHF, USDJPY, AUDUSD, NZDUSD, EURJPY, AUDJPY, NZDJPY, CADJPY.  All the winning trades with chart setups are published on the comments page. 2025-12 1174 Pips 2026-01 2624 Pips 2026-02 2937 Pips 2026-03 2165 Pips 2026-04 2243 Pips It can generate signals with Buy/Sell Arrows and Pop-Up/Sound Alerts. Each signal has clear Entry and Stop Loss levels, which should be automatically flagged on the chart, as well as potential Targets 1,
Gann Made Easy MT5
Oleg Rodin
5 (4)
Gann Made Easy 는 mr.의 이론을 사용하여 최고의 거래 원칙을 기반으로 하는 전문적이고 사용하기 쉬운 Forex 거래 시스템입니다. W.D. 간. 이 표시기는 Stop Loss 및 Take Profit Levels를 포함하여 정확한 BUY 및 SELL 신호를 제공합니다. PUSH 알림을 사용하여 이동 중에도 거래할 수 있습니다. 구매 후 거래 방법 안내 및 유용한 추가 지표를 무료로 받으시려면 저에게 연락주세요! 아마도 Gann 거래 방법에 대해 이미 여러 번 들었을 것입니다. 일반적으로 Gann의 이론은 초보자 거래자뿐만 아니라 이미 거래 경험이 있는 사람들에게도 매우 복잡한 것입니다. Gann의 거래 방식은 이론적으로 적용하기 쉽지 않기 때문입니다. 나는 그 지식을 연마하고 Forex 지표에 최고의 원칙을 적용하기 위해 몇 년을 보냈습니다. 표시기는 적용하기가 매우 쉽습니다. 차트에 첨부하고 간단한 거래 권장 사항을 따르기만 하면 됩니다. 지표는 지속적으로 시장 분석
소개       Quantum Breakout PRO   , 브레이크아웃 존 거래 방식을 변화시키는 획기적인 MQL5 지표! 13년 이상의 거래 경험을 가진 숙련된 트레이더 팀이 개발한       퀀텀 브레이크아웃 PRO       혁신적이고 역동적인 브레이크아웃 존 전략으로 거래 여정을 새로운 차원으로 끌어올리도록 설계되었습니다. Quantum Breakout Indicator는 5개의 이익 목표 영역이 있는 브레이크아웃 영역의 신호 화살표와 브레이크아웃 상자를 기반으로 한 손절 제안을 제공합니다. 초보자 거래자와 전문 거래자 모두에게 적합합니다. Quantum EA 채널:       여기를 클릭하세요 중요한! 구매 후 설치 매뉴얼을 받으려면 개인 메시지를 보내주십시오. 추천: 기간: M15 통화쌍: GBPJPY, EURJPY, USDJPY,NZDUSD, XAUUSD 계정 유형: 스프레드가 매우 낮은 ECN, Raw 또는 Razor 브로커 시간: GMT +3 중개인 :
Azimuth Pro
Ottaviano De Cicco
5 (7)
Azimuth Pro V2: Synthetic Fractal Structure and Confirmed Entries for MT5 Overview Azimuth Pro is a multi-level swing structure indicator by Merkava Labs . Four nested swing layers, swing-anchored VWAP, ABC pattern detection, three-timeframe structural filtering, and closed-bar confirmed entries — one chart, one workflow from micro-swings to macro-cycles. This is not a blind signal product. It is a structure-first workflow for traders who care about location, context, and timing. V2 Launch Offe
우선적으로, 이 거래 도구는 전문적인 거래에 이상적인 비-다시 그리기 및 지연되지 않는 지표입니다.  온라인 강좌, 사용자 매뉴얼 및 데모. 스마트 가격 액션 컨셉트 인디케이터는 신규 및 경험 많은 트레이더 모두에게 매우 강력한 도구입니다. Inner Circle Trader Analysis 및 Smart Money Concepts Trading Strategies와 같은 고급 거래 아이디어를 결합하여 20가지 이상의 유용한 지표를 하나로 결합합니다. 이 인디케이터는 스마트 머니 컨셉트에 중점을 두어 대형 기관의 거래 방식을 제공하고 이동을 예측하는 데 도움을 줍니다.  특히 유동성 분석에 뛰어나 기관이 어떻게 거래하는지 이해하는 데 도움을 줍니다. 시장 트렌드를 예측하고 가격 변동을 신중하게 분석하는 데 탁월합니다. 귀하의 거래를 기관 전략에 맞추어 시장의 동향에 대해 더 정확한 예측을 할 수 있습니다. 이 인디케이터는 시장 구조를 분석하고 중요한 주문 블록을 식별하고 다양
SMC Intraday Formula
Kareem Abbas
5 (9)
먼저 솔직하게 말하겠습니다. 어떤 인디케이터도 단독으로 당신을 수익성 있게 만들어주지 않습니다. 누군가 그렇게 말한다면, 그는 당신에게 꿈을 파는 것입니다. 완벽한 매수/매도 화살표를 보여주는 모든 인디케이터는 완벽하게 보이도록 만들 수 있습니다 — 단지 올바른 과거 구간을 확대하고 승리한 거래만 캡처하면 됩니다. 우리는 그렇게 하지 않습니다.  SMC Intraday Formula는 도구입니다. 시장 구조를 읽고, 가장 높은 확률의 가격 구간을 표시하며, 현재 스마트 머니의 흐름이 어떻게 보이는지 아주 단순한 언어로 보여줍니다. 최종 결정은 여전히 당신이 합니다. 실행도 당신이 합니다. 하지만 이제는 희망이 아니라 정확성으로 거래하게 됩니다. 우리는 이 인디케이터를 지난 약 3년 동안 골드(XAUUSD) 및 주요 외환 통화쌍의 데이 트레이딩 스캘핑에 사용해 왔습니다. M1, M5, M15, M30에서 우리의 핵심 도구입니다. 이 도구는 미래를 예측하려 하지 않습니다 — 지금 형성
RelicusRoad Pro MT5
Relicus LLC
4.96 (24)
RelicusRoad Pro: 퀀트 시장 운영 체제 70% 할인 평생 이용권 (한정 시간) - 2,000명 이상의 트레이더와 함께하세요 왜 대부분의 트레이더는 "완벽한" 지표를 가지고도 실패할까요? 진공 상태에서 단일 개념 만으로 거래하기 때문입니다. 문맥 없는 신호는 도박입니다. 지속적인 승리를 위해서는 컨플루언스(중첩) 가 필요합니다. RelicusRoad Pro는 단순한 화살표 지표가 아닙니다. 완전한 퀀트 시장 생태계 입니다. 독점적인 변동성 모델링을 사용하여 가격이 이동하는 "공정 가치 로드"를 매핑하고, 단순 노이즈와 실제 구조적 돌파를 구분합니다. 추측은 그만두세요. 기관급 로드 로직으로 거래를 시작하세요. 핵심 엔진: "Road" 알고리즘 시스템의 중심에는 시장 상황에 실시간으로 적응하는 동적 변동성 채널인 Road Algo 가 있습니다. 세이프 라인(평형) 과 가격이 수학적으로 반전될 가능성이 높은 확장 레벨 을 투영합니다. Simple Road: 일반적인 시장을 위
Meridian Pro
Ottaviano De Cicco
5 (2)
Meridian Pro 2.00: Professional Multi-Timeframe Trend Matrix for MT5 Meridian Pro 2.00 is a professional adaptive trend matrix for MetaTrader 5. It combines the original Meridian trend engine, a clean chart ribbon, closed-bar signal arrows, an 8-timeframe dashboard, Fuel momentum, weighted consensus, synthetic HTF processing and chart-native higher-timeframe context lines. The goal is simple: read current trend, multi-timeframe structure, strength, momentum and EA-ready state from one discipline
Quantum TrendPulse
Bogdan Ion Puscasu
5 (25)
SuperTrend   ,   RSI   ,   Stochastic   의 힘을 하나의 포괄적인 지표로 결합하여 트레이딩 잠재력을 극대화하는 궁극의 트레이딩 도구   인 Quantum TrendPulse를   소개합니다. 정밀성과 효율성을 추구하는 트레이더를 위해 설계된 이 지표는 시장 추세, 모멘텀 변화, 최적의 진입 및 종료 지점을 자신 있게 식별하는 데 도움이 됩니다. 주요 특징: SuperTrend 통합:   주요 시장 추세를 쉽게 따라가고 수익성의 물결을 타세요. RSI 정밀도:   매수 과다 및 매도 과다 수준을 감지하여 시장 반전 시점을 파악하는 데 적합하며 SuperTrend 필터로 사용 가능 확률적 정확도:   변동성이 큰 시장에서 숨겨진 기회를 찾기 위해 확률적 진동   을 활용하고 SuperTrend의 필터로 사용 다중 시간대 분석:   M5부터 H1 또는 H4까지 다양한 시간대에 걸쳐 시장을 최신 상태로 유지하세요. 맞춤형 알림:   맞춤형 거래 조건이 충족되면
FX Trend MT5 NG
Daniel Stein
5 (4)
FX Trend NG: 차세대 멀티 마켓 트렌드 인텔리전스 개요 FX Trend NG 는 다중 시간 프레임 기반의 전문 트렌드 분석 및 시장 모니터링 도구입니다. 몇 초 만에 전체 시장 구조를 파악할 수 있도록 설계되었습니다. 여러 차트를 일일이 전환할 필요 없이, 어떤 종목이 추세에 있는지, 어디에서 모멘텀이 약화되고 있는지, 그리고 어떤 시간 프레임이 서로 정렬되어 있는지 즉시 확인할 수 있습니다. 출시 기념 특별 혜택 – FX Trend NG 를 $30 (6개월) 또는 $80 평생 라이선스 로 이용할 수 있습니다. 이미 Stein Investments 고객이신가요? -> 메시지를 보내 전용 고객 그룹에 참여하세요. 설정이나 사용 방법이 필요하신가요? -> Stein Investments 공식 페이지 를 방문하세요. 1. FX Trend NG가 특별한 이유 3단계 추세 로직 – 단순한 Buy / Sell이 아닙니다 • 대부분의 지표는 Buy 또는 Sell 두 가지 상태만 제
Atomic Analyst MT5
Issam Kassas
3.94 (31)
우선적으로 언급할 점은이 거래 지표가 다시 그리지 않고 지연되지 않으며 이를 통해 수동 및 로봇 거래 모두에 이상적이라는 점입니다. 사용자 매뉴얼: 설정, 입력 및 전략. Atomic Analyst는 가격의 강도와 모멘텀을 활용하여 시장에서 더 나은 이점을 찾는 PA Price Action Indicator입니다. 고급 필터를 장착하여 잡음과 거짓 신호를 제거하고 거래 잠재력을 높이는 데 도움이 됩니다. 복잡한 지표의 다중 레이어를 사용하여 Atomic Analyst는 차트를 스캔하고 복잡한 수학적 계산을 간단한 신호와 색상으로 변환하여 초보 트레이더가 이해하고 일관된 거래 결정을 내릴 수 있도록합니다. "Atomic Analyst"는 새로운 및 경험이 풍부한 트레이더를위한 종합적인 거래 솔루션입니다. 프리미엄 지표와 최고 수준의 기능을 하나의 거래 전략에 결합하여 모든 종류의 트레이더에 대한 다재다능한 선택지가되었습니다. 인트라데이 거래 및 스캘핑 전략 : 빠르고 정확한 일일
FX Power MT5 NG
Daniel Stein
5 (31)
FX Power: 통화 강세 분석으로 더 스마트한 거래 결정을 개요 FX Power 는 어떤 시장 상황에서도 주요 통화와 금의 실제 강세를 이해하기 위한 필수 도구입니다. 강한 통화를 매수하고 약한 통화를 매도함으로써 FX Power 는 거래 결정을 단순화하고 높은 확률의 기회를 발견합니다. 트렌드를 따르거나 극단적인 델타 값을 사용해 반전을 예측하고자 한다면, 이 도구는 귀하의 거래 스타일에 완벽히 적응합니다. 단순히 거래하지 말고, FX Power 로 더 스마트하게 거래하세요. 1. FX Power가 거래자에게 매우 유용한 이유 통화와 금의 실시간 강세 분석 • FX Power 는 주요 통화와 금의 상대적 강세를 계산하고 표시하여 시장 역학에 대한 명확한 통찰력을 제공합니다. • 어떤 자산이 앞서고 있고 어떤 자산이 뒤처지는지 모니터링하여 보다 현명한 거래 결정을 내릴 수 있습니다. 포괄적인 멀티 타임프레임 뷰 • 단기, 중기 및 장기 타임프레임에서 통화와 금의 강세를
KT Alpha Hunter Arrows MT5
KEENBASE SOFTWARE SOLUTIONS
대부분의 화살표 인디케이터는 신호만 보여주고, 나머지 판단은 모두 트레이더에게 맡깁니다. KT Alpha Hunter Arrows는 완성된 트레이딩 플랜을 제공합니다. 각 신호 화살표가 표시될 때마다 진입선, 손절선, 네 개의 익절 목표, 그리고 현재 심볼과 시간대가 지금 거래할 가치가 있는지 알려주는 실시간 엣지 판정이 함께 그려집니다. 포함된 Trade Manager EA는 사용자가 직접 진입한 뒤의 실행 관리를 맡아, 시장이 흔들리고 감정이 개입되기 쉬운 상황에서도 거래 원칙을 유지할 수 있도록 도와줍니다. 리페인트 없음. 종가 확정 후 신호만 표시. Forex, Gold, Indices 및 사용자가 거래하는 다양한 MT5 지원 상품에 맞게 설계되었습니다. 주요 기능 캔들이 마감된 후에만 표시되는 리페인트 없는 매수 및 매도 화살표. 각 신호마다 진입선, 구조적 손절선, 네 개의 익절 목표 표시. 현재 차트에서 매수와 매도 셋업을 별도로 평가하는 Edge Dashboard.
Market Structure Order Block Dashboard MT5는 시장 구조와 주요 가격 반응 구역을 차트에서 직접 읽고자 하는 트레이더를 위해 설계된 MT5 지표입니다. BOS, ChoCH, 오더 블록, Fair Value Gap (FVG), 유동성, Kill Zones, Volume Profile 그리고 빠른 분석을 위한 콤팩트한 대시보드를 결합합니다. 이 지표는 시장 구조, ICT 및 Smart Money 개념을 의사결정 프레임워크로 사용하는 트레이더를 대상으로 합니다. 추세 지속, 가능한 반전, 가격 불균형, 유동성 타겟 및 관심 구역을 보다 체계적으로 식별하는 데 도움을 줄 수 있습니다. 구매자를 위한 포함 리소스 구매 후 MQL5 개인 메시지로 요청하시면 완전한 PDF 사용 설명서와 파라미터 설정 팁을 제공해 드립니다. MQL5 개인 메시지를 통한 직접 기술 지원. 1.20 버전은 두 가지 주요 추가 기능을 제공합니다: Pending BOS / Pending
Btmm state engine pro
Garry James Goodchild
5 (4)
BTMM State Engine Pro is a MetaTrader 5 indicator for traders who use the Beat The Market Maker approach: Asian session context, kill zone timing, level progression, peak formation detection, and a multi-pair scanner from a single chart. It combines cycle state logic with a built-in scanner dashboard so you do not need the same tool on many charts at once. What it does Draws the Asian session range; session times can follow broker server offset or be set in inputs. Tracks level progression (L
Trend Screener Pro MT5
STE S.S.COMPANY
4.85 (104)
트렌드 표시기, 트렌드 트레이딩 및 필터링을 위한 획기적인 고유 솔루션, 하나의 도구 안에 내장된 모든 중요한 트렌드 기능! Forex, 상품, 암호 화폐, 지수 및 주식과 같은 모든 기호/도구에 사용할 수 있는 100% 다시 칠하지 않는 다중 시간 프레임 및 다중 통화 표시기입니다. Trend Screener는 차트에 점이 있는 화살표 추세 신호를 제공하는 효율적인 지표 추세 추종 지표입니다. 추세 분석기 표시기에서 사용할 수 있는 기능: 1. 트렌드 스캐너. 2. 최대 이익 분석이 있는 추세선. 3. 추세 통화 강도 측정기. 4. 경고가 있는 추세 반전 점. 5. 경고가 있는 강력한 추세 점. 6. 추세 화살표 Trend Screener Indicator가 있는 일일 분석 예, 일일 신호 성능...등은 여기에서 찾을 수 있습니다. 여기를 클릭하십시오. LIMITED TIME OFFER : Trend Screener Indicator는 50$ 및 평생 동안만 사용할 수 있습니다.
Grabber System MT5
Ihor Otkydach
4.83 (23)
탁월한 기술적 지표인 Grabber를 소개합니다. 이 도구는 즉시 사용 가능한 “올인원(All-Inclusive)” 트레이딩 전략으로 작동합니다. 하나의 코드 안에 강력한 시장 기술 분석 도구, 매매 신호(화살표), 알림 기능, 푸시 알림이 통합되어 있습니다. 이 인디케이터를 구매하신 모든 분들께는 다음의 항목이 무료로 제공됩니다: Grabber 유틸리티: 오픈 포지션을 자동으로 관리하는 도구 단계별 영상 매뉴얼: 설치, 설정, 그리고 실제 거래 방법을 안내 맞춤형 세트 파일: 인디케이터를 빠르게 자동 설정하여 최고의 성과를 낼 수 있도록 도와줍니다 다른 전략은 이제 잊어버리세요! Grabber만이 여러분을 새로운 트레이딩의 정점으로 이끌어 줄 수 있습니다. Grabber 전략의 주요 특징: 거래 시간 프레임: M5부터 H4까지 거래 가능한 자산: 어떤 자산이든 사용 가능하지만, 제가 직접 테스트한 종목들을 추천드립니다 (GBPUSD, GBPCAD, GBPCHF, AUDCAD, AU
Entry Points Pro for MT5
Yury Orlov
4.48 (138)
다시 색을 칠하지 않고 거래에 진입할 수 있는 정확한 신호를 제공하는 MT5용 지표입니다. 외환, 암호화폐, 금속, 주식, 지수 등 모든 금융 자산에 적용할 수 있습니다. 매우 정확한 추정값을 제공하고 매수와 매도의 가장 좋은 시점을 알려줍니다. 하나의 시그널로 수익을 내는 지표의 예와 함께 비디오 (6:22)시청하십시오! 대부분의 거래자는 Entry Points Pro 지표의 도움으로 첫 거래 주 동안 트레이딩 결과를 개선합니다. 저희의   Telegram Group 을 구독하세요! Entry Points Pro 지표의 좋은점. 재도색이 없는 진입 신호 신호가 나타나고 확인되면(시그널 캔들이 완성된 경우) 신호는 더 이상 사라지지 않습니다. 여타 보조지표의 경우 신호를 표시한 다음 제거되기 때문에 큰 재정적 손실로 이어집니다. 오류 없는 거래 게시 알고리즘을 통해 트레이드(진입 또는 청산)를 할 이상적인 순간을 찾을 수 있으며, 이를 통해 이를 사용하는 모든 거래자의 성공률이
Trend Forecaster
Alexey Minkov
5 (7)
Trend Forecaster – Since 2023. The Trend Forecaster indicator utilizes a unique proprietary algorithm to determine entry points for a breakout trading strategy. The indicator identifies price clusters, analyzes price movement near levels, and provides a signal when the price breaks through a level. The Trend Forecaster indicator is suitable for all financial assets, including currencies (Forex), metals, stocks, indices, and cryptocurrencies. You can also adjust the indicator to work on any time
Basic Harmonic Patterns Dashboard MT5
Mehran Sepah Mansoor
4.36 (11)
이 대시보드는 선택한 심볼에 대해 사용 가능한 최신 고조파 패턴을 표시하므로 시간을 절약하고 더 효율적으로 사용할 수 있습니다 /   MT4 버전 . 무료 인디케이터:   Basic Harmonic Pattern 인디케이터 열 Symbol :   선택한 심볼이 나타납니다 Trend :   강세 또는 약세 Pattern :   패턴 유형(가틀리, 나비, 박쥐, 게, 상어, 사이퍼 또는 ABCD) Entry :   진입 가격 SL:   스톱로스 가격 TP1:   1차 테이크프로핏 가격 TP2:   2차 테이크프로핏 가격 TP3:   3차 테이크프로핏 가격 Current price:   현재 가격 Age (in bars):   마지막으로 그려진 패턴의 나이 주요 입력 Symbols :   "28개 주요 통화쌍" 또는 "선택한 심볼" 중에서 선택합니다. Selected Symbols :   쉼표로 구분하여 모니터링하려는 원하는 심볼("EURUSD,GBPUSD,XAUUSD")을 선택
Trend Lines PRO MT5
Roman Podpora
5 (1)
트렌드 라인즈 프로       이 지표는 시장이 실제로 어떤 방향으로 전환되는지 파악하는 데 도움이 됩니다. 실제 추세 반전 지점과 주요 시장 참여자들이 다시 진입하는 지점을 보여줍니다. 보시다시피       BOS 라인       복잡한 설정이나 불필요한 노이즈 없이 더 높은 시간대의 추세 변화와 주요 레벨을 확인할 수 있습니다. 신호는 차트에 다시 그려지지 않고 캔들이 마감된 후에도 계속 표시됩니다. MT4 버전   -   RFI LEVELS PRO   표시기   와 결합 시 최대 잠재력을 발휘합니다. 지표가 보여주는 내용: 실제 변화       추세(BOS 라인) 한 번 신호가 나타나면 그 신호는 계속 유효합니다! 이는 신호를 발생시킨 후 변경될 수 있는 리페인팅 방식의 지표와 중요한 차이점입니다. 리페인팅 방식의 지표는 잠재적으로 자금 손실로 이어질 수 있습니다. 이제 더욱 높은 확률과 정확도로 시장에 진입할 수 있습니다. 또한 화살표가 나타난 후 목표가(익절)에 도달하거나
RFI levels PRO MT5
Roman Podpora
3.67 (3)
이 지표는 추세 반전 지점과 가격 반등 영역을 정확하게 보여줍니다.       주요 투자자들   . 새로운 트렌드가 형성되는 곳을 파악하고 최대한 정확하게 의사결정을 내리며 모든 거래를 완벽하게 통제합니다. TREND LINES PRO   지표와 함께 사용할 때 최대의 잠재력을 발휘합니다.  VERSION MT4 지표가 보여주는 내용: 새로운 추세의 시작 시 활성화되는 반전 구조 및 반전 수준. 최소한의 위험 대비 수익률을 갖는 이익 실현   (TAKE PROFIT)   및   손절매(STOP LOSS)   레벨 표시       RR 1:2   . 지능형 손실 감소 로직이 적용된 손절매 기능. 지정된 지표에서 두 가지 추세 유형에 대한 반전 패턴을 표시합니다. 지표: 트렌드를 따라   트렌드 라인 프로   (글로벌 트렌드 변화) 트렌드 프로   (빠른 트렌드 변화) 간단하고 효과적입니다       스캐너       실시간 추세 (신규). 다중 시간 프레임 도구 필터링. 표시하다  
Super Signal Market Slayer 비재페인트 | 고정확도 | 멀티 마켓 지능형 추세 지표 트레이딩에서 진짜 어려운 것은 주문이 아니라, 시장 변동 속에서 추세가 시작되는 순간을 정확히 파악하는 것입니다. Market Slayer 는 이를 위해 만들어졌습니다. 이 지표는 데이 트레이딩을 위해 설계된 비재페인트 지능형 지표입니다. 다중 확인 및 추세 필터링을 통해 중요한 시점에서만 명확하고 신뢰할 수 있는 Buy / Sell 신호를 제공합니다. 핵심 장점 비재페인트 신호 한 번 생성된 신호는 이동하거나 사라지지 않습니다. 고정확도 추세 판단 다양한 종목에서 테스트되었으며, 특히 골드 M5 / M15에서 안정적인 성과를 보입니다. 멀티 마켓 지원 골드, 외환, 지수, 주요 암호화폐 지원. 데이 트레이딩 최적화 M5, M15에 집중하여 노이즈를 줄이고 실행력을 향상. 직관적 구조 초보자도 쉽게 이해하고 사용할 수 있습니다. 기술 로직 요약 Market Slayer 는 단일
제작자의 제품 더 보기
Iceblock Volume
Vincent Jose Proenca
5 (1)
짧은 문구: Iceblock — 가격 움직임은 작지만 거래량이 높은 클러스터를 식별하는 MT4 지표(아이스버그 유사 행동). TF: 모든 타임프레임에서 작동 (M1 ~ D1). 종목: Forex, 지수, 금, CFD와 호환. 설정: VolumeLookback – 평균 거래량 계산용 캔들 수 VolumeThreshold – 비정상적 거래량 판단 배수 ClusterSize – 클러스터 확인을 위한 인접 캔들 수 RangeComparisonPeriod – 캔들 범위(High–Low) 평균 기간 간단 결론: Iceblock은 거래량은 높으나 가격 변동은 작은 구역을 강조합니다. 아이스버그 주문과 유사한 현상을 시사하지만 MT4의 거래량과 가격 데이터에만 근거합니다. 화살표는 이상 활동 표시이며 매매 신호가 아닙니다.
FREE
VWAP Personnal Custom
Vincent Jose Proenca
VWAP_PC_MQL5 — a simple home-built VWAP indicator showing real-time volume-weighted price levels directly on your MT5 chart. TF: Works on all timeframes. Pair: Compatible with all symbols — Forex, indices, commodities, and stocks. Settings: Applied Price – price type used for VWAP calculation (Close, Typical, Weighted, etc.) Line Color / Width / Style – customize VWAP line appearance Session Reset – optional reset per day or continuous mode How it works (VWAP principle): VWAP (Volume Weighted
FREE
CustomBreakout
Vincent Jose Proenca
Range Breakout EA – Simple Description Concept An automated trading robot for MetaTrader 5 that exploits range breakouts with two key periods: Features Automatic market hours management Customizable Stop Loss and Take Profit Smart Trailing Stop Built-in testing mode for simulation Detailed logs for monitoring How It Works Records extreme prices at the start of the day Waits for a breakout of the secondary range Opens a position in the breakout direction Automatically manages the trade (SL/TP/Tr
FREE
Previous Daily HighLow
Vincent Jose Proenca
PDHL – simply displays the highs and lows of previous days directly on your chart, providing a quick and visual reference of past key levels. The indicator is lightweight and easily customizable , allowing you to adjust the number of days displayed, the colors, as well as the style and thickness of the lines to suit your preferences. It is designed to be simple and practical, but may not work on all instruments or platforms . Only teste Tested only with CFDs
FREE
VolumeSR MT4
Vincent Jose Proenca
his indicator automatically identifies key support and resistance levels by analyzing volume patterns. Unlike traditional S/R tools that rely only on price, Volume S/R finds levels where the market truly reacted.   DETECTION LOGIC: - High Volume Zones: Price levels where strong buying/selling occurred - Low Volume Zones: Areas of weak interest - potential breakout or reversal zones   SMART FILTERING: - Nearby levels are automatically merged to avoid chart clutter - Maximum levels limit keeps yo
FREE
Dynamic Pivot Zones
Vincent Jose Proenca
Dynamic Pivot Zones – Your Level Assistant on the Chart This indicator is a bit like a GPS for your trading . It shows you where the price likes to hang out, where it gets nervous, and where it flies through. No more calculating pivots by hand or guessing support and resistance levels. What it does: Automatically plots H1, H4, and D1 pivots . Shows support and resistance zones : R1, R2, S1, S2. Lines are colored and easy to read , so you can instantly see what’s hot or cold. Why you’ll love it:
FREE
Volume-to-Price Movement Oscillator (VP Oscillator) for MT5 The VP Oscillator highlights the balance (or imbalance) between trading volume and price movement, helping traders spot hidden accumulation, distribution, or weakening trends. How It Works: Calculates each bar’s price range (High–Low) and tick volume. Normalizes both values over a set period (default: 14). Plots the absolute difference between them ×100 — showing how closely price action aligns with trading activity. Interpretation: Hig
FREE
Better Moving Average MT5
Vincent Jose Proenca
STRUCTURAL TREND LINES - MT4/MT5 Indicator Simple indicator that automatically draws trend lines based on market structure. Features: - 3 degrees of structure detection (short, medium, long term) - Configurable swing strength for each degree - Single color per degree for clean visualization - Adjustable number of lines per degree - Customizable colors and line widths How it works: The indicator identifies swing highs and lows based on the strength parameter, then connects these points to crea
FREE
Custom Box CFDs
Vincent Jose Proenca
Range Box Indicator for Trading Sessions This indicator allows traders to visualize and analyze specific time ranges directly on their chart by drawing rectangular boxes for each trading session. Key Features: Customizable session interval: set your own session start and end times. Number of days displayed: choose how many past sessions are visible. Default color and special color for Monday: easily highlight weekly patterns. Adjustable border width: customize the appearance of the rectangles to
FREE
VMS Oscillator
Vincent Jose Proenca
Volume & Move Strength (VMS) Indicator for MT5 The VMS Indicator displays the relationship between trading volume and price movement strength, helping traders assess how well market activity supports price action. How It Works: Measures tick volume as trading activity. Calculates move strength using a normalized True Range (%). Both values can be smoothed (default: 5) and optionally normalized (0–100) for consistency across markets. Plots two lines in a separate window: Blue (Volume) – trading a
FREE
This indicator allows you to number bars within a trading session for CFDs. It works on GER40, UK100, US30, US100, and US500 and is fully customizable to fit your trading style and chart preferences. Key Features & Parameters: Customizable session interval: define your own session start and end times Option to hide even numbers for a cleaner chart Adjust number distance to position the bar numbers as you prefer Font size and color: choose the size and color that suit your chart Number of days di
FREE
Adaptive Flow MAs
Vincent Jose Proenca
Adaptive Flow MAs is a moving average indicator designed to naturally adjust to market movements. Unlike traditional averages, it dynamically adapts its periods based on recent volatility and the current trend. The EMA closely follows rapid price swings to capture every impulse, while the SMA remains smoother, providing a stable and reliable reference. With a clean display showing the current adaptive periods, this tool helps traders feel the “flow” of the market without visual clutter. It’s cr
FREE
Better Moving Average
Vincent Jose Proenca
STRUCTURAL TREND LINES - MT4 Indicator Simple indicator that automatically draws trend lines based on market structure. Features: - 3 degrees of structure detection (short, medium, long term) - Configurable swing strength for each degree - Single color per degree for clean visualization - Adjustable number of lines per degree - Customizable colors and line widths How it works: The indicator identifies swing highs and lows based on the strength parameter, then connects these points to create t
FREE
Daily Bar Number CFD
Vincent Jose Proenca
indicator that numbers the bars (candles) in a custom trading session. The indicator allows: Defining the session start time (StartHour and StartMinute) Displaying numbers only on odd bars (if AfficherUniquementImpairs is true) Displaying numbers on the last N days (NbJours) Customizing the color and font size of the text The indicator will loop through the bars of the last N days and, for each day, start counting from the session start time. It will display the bar number (starting at 1) belo
FREE
The Candle Activity Visualizer turns your chart into a dynamic heatmap, giving you a clear view of buying and selling pressure. In-Depth Market Insight: Active Zone Detection: The algorithm highlights areas where high volume builds up within a narrow price range, revealing key pressure zones. Real-Time Intensity: Colors adjust in real time, shifting smoothly from cool tones to warmer shades as activity increases. Visual Customization: 5 Color Palettes: Choose from five professionally designed th
Rainbow Price Visualizer
Vincent Jose Proenca
Rainbow Price Visualizer v1.21 See where the market really breathes. Turns your MT4 chart into an ultra-precise heatmap that highlights price zones favored by big players. Why it matters 300 price levels at 0.2‑pip resolution — microscopic detail. 8 visual themes (Rainbow, Fire, Ocean…) for instant readibility. Smart opacity: low noise fades, real zones pop. Lightweight rendering with automatic cleanup. Fully customizable: saturation, opacity, resolution, history depth. Bands project into the f
SmartBubbles Accumulation
Vincent Jose Proenca
버블 지표 — 가격 둔화 + 거래량 스파이크 감지 가격이 갑자기 둔화되고 동시에 거래량이 급증할 때, 차트에 색상 사각형을 표시하는 간단한 시각적 도구입니다. (채우기 기능과 동심 원형 버블 효과 포함) 시장이 움직이기 전의 중요한 타이밍을 식별하는 데 도움이 됩니다. 지표 기능: 시장이 움직이기 전 “주저하는” 순간을 감지 거래량이 많아도 가격 변동이 적은 구간 표시 잠재적 돌파 또는 전환점을 사전에 예측 작동 원리: 현재 차트보다 작은 시간 프레임 분석 비정상적으로 작은 캔들 감지 (가격 둔화) 비정상적으로 높은 거래량 감지 (거래량 스파이크) 초록색(강세) 또는 빨간색(약세) 사각형 표시 주요 설정: 가격 민감도: 값이 낮을수록 민감도가 높음 거래량 배수: 값이 높을수록 선별적 분석 버블 크기: 지표 표시 가시성 조정 유용한 이유: 간단하고 시각적으로 직관적 복잡한 계산 불필요 흥미로운 시장 패턴 탐지 완전히 사용자 정의 가능 횡보장, 돌파 거래 또는 시장 동향 이해에 최적화되
Institutional Flow Indicator A smart volume-based tool that detects institutional activity zones through direct order flow patterns. It reveals where large institutions operate. An advanced volume indicator that filters out noise to identify probable institutional patterns. Key Features Smart cluster detection Automatic identification Signal classification: Violet / Yellow – Institutional Zone – Strong, sustained institutional activity Red / Green – Strong Signal – Significant buying/selling pre
Pivot PDHL Levels
Vincent Jose Proenca
AutoPivot - 자동 피벗 포인트 지표 MT4용 고급 인디케이터로, 일간·주간·월간 주요 피벗 포인트(PP, R1, R2, R3, S1, S2, S3)를 자동 계산 및 표시하며, 전일 고점(PDH)과 저점(PDL)을 함께 표시하여 트레이더가 잠재적 지지·저항 구역을 한눈에 파악할 수 있도록 돕습니다. 주요 기능: 지능형 시간 프레임 인식 : 차트의 주기(H4, D1, W1)를 자동 감지하여 각 시간대에 맞는 정확한 피벗 계산 수행. 전일 고점/저점 표시 : PDH/PDL을 자동으로 표시하고, 현재 가격과의 상대적 위치를 직관적으로 확인 가능. 지지/저항 구역 시각화 : PDH/PDL과 인접한 피벗 라인 사이에 반투명 영역을 생성하여 반전 또는 돌파 가능 구간을 명확히 표현. 8가지 색상 테마 : 클래식, 다크, 라이트, 블루, 프로페셔널 등 8가지 프리셋 테마 제공. 색상, 선 스타일, 투명도 모두 사용자 맞춤 설정 가능. 가격 라벨 옵션 : 각 피벗
AMD Adaptive MA MT4
Vincent Jose Proenca
5 (1)
AMD 적응형 이동평균 (AAMA) AAMA는 MetaTrader 4용 적응형 이동평균 지표로, 시장 상황에 따라 반응 속도를 자동으로 조정합니다. 주요 기능: 카우프만 효율 비율(Kaufman Efficiency Ratio)을 기반으로 한 적응형 이동평균 – 강한 추세에서는 빠르게 반응하고, 횡보장에서는 노이즈를 필터링 AMD의 4가지 시장 단계 자동 감지: 축적기(Accumulation), 상승기(Markup), 분배기(Distribution), 하락기(Markdown) ATR을 통한 변동성 적응 – 현재 시장 조건에 따라 민감도를 자동 조정 실시간 정보 패널: 감지된 시장 단계, 신뢰 수준, 적응 속도 표시 다중 지표 통합 시스템: ADX, RSI, MACD를 활용하여 시장 단계를 정확히 식별 빠름/느림(Fast/Slow) 참조 구역을 통해 적응 행동 시각화 사용법: 이 지표는 시장 상황에 따라 자동으로 적응 속도를 조정합니다. 강한 추세에서는 빠르게, 횡보 구간에서는 느리
Structural Trend Lines
Vincent Jose Proenca
STRUCTURAL TREND LINES - MT4 Indicator Simple indicator that automatically draws trend lines based on market structure. Features: - 3 degrees of structure detection (short, medium, long term) - Configurable swing strength for each degree - Single color per degree for clean visualization - Adjustable number of lines per degree - Customizable colors and line widths How it works: The indicator identifies swing highs and lows based on the strength parameter, then connects these points to create t
Volume Profil MT4
Vincent Jose Proenca
Volume Profile Rectangle 요약 선택한 영역 내에서 각 가격 수준별 거래량의 수평 분포를 시각화하는 인터랙티브 볼륨 프로파일 지표 입니다. 자동으로 이동 가능한 직사각형을 생성하고, 매수/매도 우세 거래량을 색상 막대로 표시합니다. 주요 기능: 수평 거래량 표시 : 각 가격 수준에서의 거래량 분포를 수평 막대 형태로 시각화 강세/약세 분석 : 매수 우세 거래량은 초록색, 매도 우세 거래량은 빨간색으로 표시 인터랙티브 직사각형 : 선택 영역(직사각형)을 이동하면 자동으로 분석이 업데이트됨 자동 생성 : 시작 시 기본 직사각형을 자동으로 생성하여 즉시 사용 가능 작동 방식: 영역 선택 : 자동 또는 수동으로 생성된 직사각형이 분석할 구간(시간 + 가격)을 정의 거래량 분포 계산 : 가격 구간을 여러 수준으로 나누고(해상도 설정 가능), 선택된 캔들의 거래량을 해당 구간에 분배 스마트 색상 분석 : 각 가격 수준별로 매수/매도 중 어느 쪽 거래량이 우세한지 판별 동적
Proxy OrderFlow MT4
Vincent Jose Proenca
5 (1)
틱 스프레드 불균형 기반 지표. TF: 모든 타임프레임(M1 ~ D1)에서 작동. 통화쌍: Forex, 지수, 금 및 CFD 지원 (JPY, Gold, CFD 상품 자동 조정). 설정: TickWindow (200) – 틱 관찰 윈도우 SpreadWeight (1.5) – 스프레드 가중치 NormalizationPeriod (20) – 정규화 기간 (z-score) Overbought / Oversold (±3.0) – 알림 임계값 AlertCooldown (300s) – 알림 쿨다운 시간 결론: Proxy Order Flow – Imbalance Tick-Spread v2.4 는 OHLC 변동과 스프레드를 분석하여 매수/매도 압력을 감지하고, 시장 방향성과 불균형 구역을 명확히 보여줍니다.
Nexus Signal System
Vincent Jose Proenca
기술 설명 Nexus Signal System은 MT4용 인디케이터로, 12개의 기술적 기준을 결합하여 거래 신호를 생성합니다. 이 시스템은 신호를 확인하기 전에 여러 요소(추세, 모멘텀, 거래량, 지지/저항 구간)의 컨플루언스를 분석하여, 단일 기준만 사용하는 인디케이터보다 잘못된 신호 발생을 줄입니다. 분석 기준 (점수 0–15): 패턴 감지 (핀바, 엔골핑) 다중 타임프레임 분석 (상위 타임프레임 추세 확인) ADX 시장 상태 (추세 없는 시장 회피) 지지/저항 구간 (자동 스윙 포인트) 이동평균선 20/50/200 (추세 정렬) RSI 14 기간 (모멘텀) 상대 거래량 (기관 확인) ATR (변동성) 기능: 투명한 품질 점수 표시 신호 (0–15) 자동 감지된 지지/저항 구간 차트 표시 예비 신호(현재 캔들) 및 확정 신호(종가 캔들) ATR 기반 손절매(Stop Loss) 및 이익실현(Take Profit) 실시간 시장 정보 대시보드 8가지 색상 테마로 시각적 맞춤 설정 가
NexusSignal Scalping
Vincent Jose Proenca
기술 설명 Nexus Signal System은 MT4용 인디케이터로, 12개의 기술적 기준을 결합하여 거래 신호를 생성합니다. 이 시스템은 신호를 확인하기 전에 여러 요소(추세, 모멘텀, 거래량, 지지/저항 구간)의 컨플루언스를 분석하여, 단일 기준만 사용하는 인디케이터보다 잘못된 신호 발생을 줄입니다. 분석 기준 (점수 0–15): 패턴 감지 (핀바, 엔골핑) 다중 타임프레임 분석 (상위 타임프레임 추세 확인) ADX 시장 상태 (추세 없는 시장 회피) 지지/저항 구간 (자동 스윙 포인트) 이동평균선 20/50/200 (추세 정렬) RSI 14 기간 (모멘텀) 상대 거래량 (기관 확인) ATR (변동성) 기능: 투명한 품질 점수 표시 신호 (0–15) 자동 감지된 지지/저항 구간 차트 표시 예비 신호(현재 캔들) 및 확정 신호(종가 캔들) ATR 기반 손절매(Stop Loss) 및 이익실현(Take Profit) 실시간 시장 정보 대시보드 8가지 색상 테마로 시각적 맞춤 설정 가
VR Signal
Vincent Jose Proenca
VolumeRejectionSignals v5.0 고급 거래량 분석 지표 일반 설명 VolumeRejectionSignals v5.0은 거래량 거부를 심층 분석하여 중요한 가격 움직임을 정확하게 식별하도록 설계된 고급 기술 지표입니다. 주문 흐름 동적과 시장 구조를 결합하여 매수 또는 매도 압력이 약해지는 구간을 탐지하고, 이를 통해 반전이나 추세 가속을 예측할 수 있습니다. 지능형 스코어링 시스템 이 지표는 각 신호의 품질을 0~100% 범위로 평가하는 가중 스코어링 시스템을 기반으로 합니다. 신호는 세 가지 범주로 나뉩니다: 표준: 50–65% 강력: 65–80% 프리미엄: 80% 이상 이 분류는 신호의 신뢰성을 우선순위로 설정하고 감지된 신뢰 수준에 따라 거래 전략을 조정할 수 있게 합니다. 필터 및 사용자 정의 VolumeRejectionSignals v5.0은 시장 상황에 따라 신호 탐지를 세밀하게 조정할 수 있는 여러 구성 가능한 필터를 제공합니다: 추세 필터 (상승
Liquidity Compression MT4
Vincent Jose Proenca
5 (1)
기관 유동성 압축 지표 (Institutional Liquidity Compression Indicator) 이 지표는 볼린저 밴드의 표준화된 폭, 거래량 및 평균 스프레드를 기반으로 실시간 유동성 축소를 측정하여 가격 돌파 전의 압축 단계를 식별합니다. 표시 형식: 전문가용 별도 창에 “Compression Score” 히스토그램과 “Threshold” 기준선을 표시합니다. 주요 특징 조기 감지: 가격 변동 전 유동성 축소 구간을 식별합니다. 다중 요소 측정: 표준화된 볼린저 밴드 폭, 거래량, 평균 스프레드를 결합합니다. 실시간 업데이트: 현재 캔들의 틱마다 갱신됩니다. 명확한 시각화: “Compression” 히스토그램과 점선 “Threshold” 표시. 호환성: MT4 및 MT5 버전 모두 지원합니다. 사용 방법 분석하려는 종목의 차트에 지표를 추가합니다. 변동성과 거래 세션에 따라 임계값 및 가중치를 조정합니다. 해석: 점수가 높을수록 유동성 압축 단계임을 의미합니다. 잠
Mean Reversion Probability – 통계적 반전 지표 간략 설명 기관급 수준의 지표로, 과거 초과 확장 데이터를 기반으로 200 이동평균선(MA200)으로의 회귀 확률을 통계적으로 계산합니다. 시장 피로 구간을 정량적으로 탐지합니다. 주요 기능 고급 통계 분석 – 500개 이상의 과거 확장 데이터를 사용하여 실제 확률 계산 확률 점수 (0–99%) – 평균 회귀 가능성을 정밀 수치화 피로 탐지 – 초과 확장의 지속 시간 및 강도 측정 다중 자산 표준화 – Forex, 지수, 금, 암호화폐, CFD 자동 적용 스마트 알림 – 드물지만 매우 신뢰성 높은 신호 (확률 >80%, 기간 >15봉) 기관형 인터페이스 – 깔끔하고 계층적인 구조로 빠른 판독 가능 방법론 실시간 분석 항목: 가격/MA200 표준화 거리 (ATR 기준) 마지막 회귀 이후의 확장 기간 최대 확장까지의 시간 과거 평균값과 비교 확률 계산: 거리 점수 (최대 60%): 현재 값 vs 과거 비율 기간
WBP Chart Signals
Vincent Jose Proenca
한국어 – WBP 차트 시그널 – 멀티타임프레임 매수/매도 압력 지표 설명: WBP Chart Signals는 거래량, 스프레드, 가격 움직임을 분석하여 시장의 매수/매도 압력을 측정하는 고급 지표입니다. 멀티타임프레임 확인과 기관급 분석을 원하는 트레이더에게 적합합니다. 주요 기능: Weighted Buy Pressure (WBP): VWAP, MA200, 거래량 강도, 유동성, 모멘텀을 결합한 독자 알고리즘 멀티타임프레임 분석: 상위 타임프레임에서 자동 신호 확인 실시간 멀티심볼 스캐너: 6개의 주요 통화쌍을 동시에 모니터링 정밀 신호 필터링: 다이버전스, 거래량, 추세, HTF 등 7개의 확인 필터 전문 대시보드: WBP 값, 신호, HTF 분석을 실시간 표시 기관급 계산: 로그 스케일 거래량, VWAP 가중치, 확신도 요인 신호 시스템: 매수(BUY): 강한 매수 > 75, 보통 매수 > 65 매도(SELL): 강한 매도 < 25, 보통 매도 < 35 인디케이터 창에 화살표
ARB 는 적응형 ATR 채널 시스템과 정교한 다중 요인 점수 모델(0–100)을 통해 높은 확률의 브레이크아웃 기회를 식별하도록 설계된 지표입니다. 변동성, 거래량, 모멘텀 및 다중 시간 프레임 추세를 결합하여 필터링된 시각적이고 실시간으로 활용 가능한 신호를 제공합니다. 작동 원리 이 지표는 Adaptive Range Breakout (ARB) 개념을 기반으로 하며, 시장 변동성(ATR)과 가격의 동적 구조에 따라 임계값을 자동으로 조정하는 현대적인 브레이크아웃 트레이딩 접근 방식입니다. 각 신호는 확인 전에 설정의 품질과 신뢰성을 측정하는 가중 점수를 통해 평가됩니다. 점수 시스템 구성 (0–100) 각 요인은 신호의 강도를 평가하는 전체 점수에 기여합니다. 요인 가중치 설명 채널 내 위치 40% 현재 ATR 영역 내에서 가격의 위치를 측정 브레이크아웃 근접도 25% 주요 임계값까지의 거리를 평가 거래량 확인 15% 현재 거래량을 이동 평균과 비교 상위 타임프레임 추세 (HTF
필터:
Lamar Jackson
381
Lamar Jackson 2026.02.17 08:39 
 

사용자가 평가에 대한 코멘트를 남기지 않았습니다

리뷰 답변