Visual Dynamic Envelope Crossover Indicator
- Indicators
-
AL MOOSAWI ABDULLAH JAFFER BAQER
 To trade successfully we need to go through the proven path that others had gone and reached!
Here are 17 quotes from such successful investors:
1- Limit your size in any position so that fear does not become the prevailing instinct guiding your judgment.
Joe Vidich - Version: 1.0
- Activations: 5
Visual Dynamic Envelope Crossover: Precision Signals for Modern Traders
Unlock a new level of clarity in your trading with the Visual Dynamic Envelope Crossover indicator. Designed for traders who demand precision and simplicity, this powerful tool eliminates guesswork by identifying high-probability entry points with clear, non-repainting buy and sell arrows directly on your chart.
For just $30, you get a sophisticated yet easy-to-use indicator that can become the cornerstone of your trading strategy.
The Core Logic: How It Works
The indicator is built on a robust and proven trading concept: price breakouts from a volatility-based envelope. It intelligently adapts to market conditions, providing signals that are both timely and relevant.
-
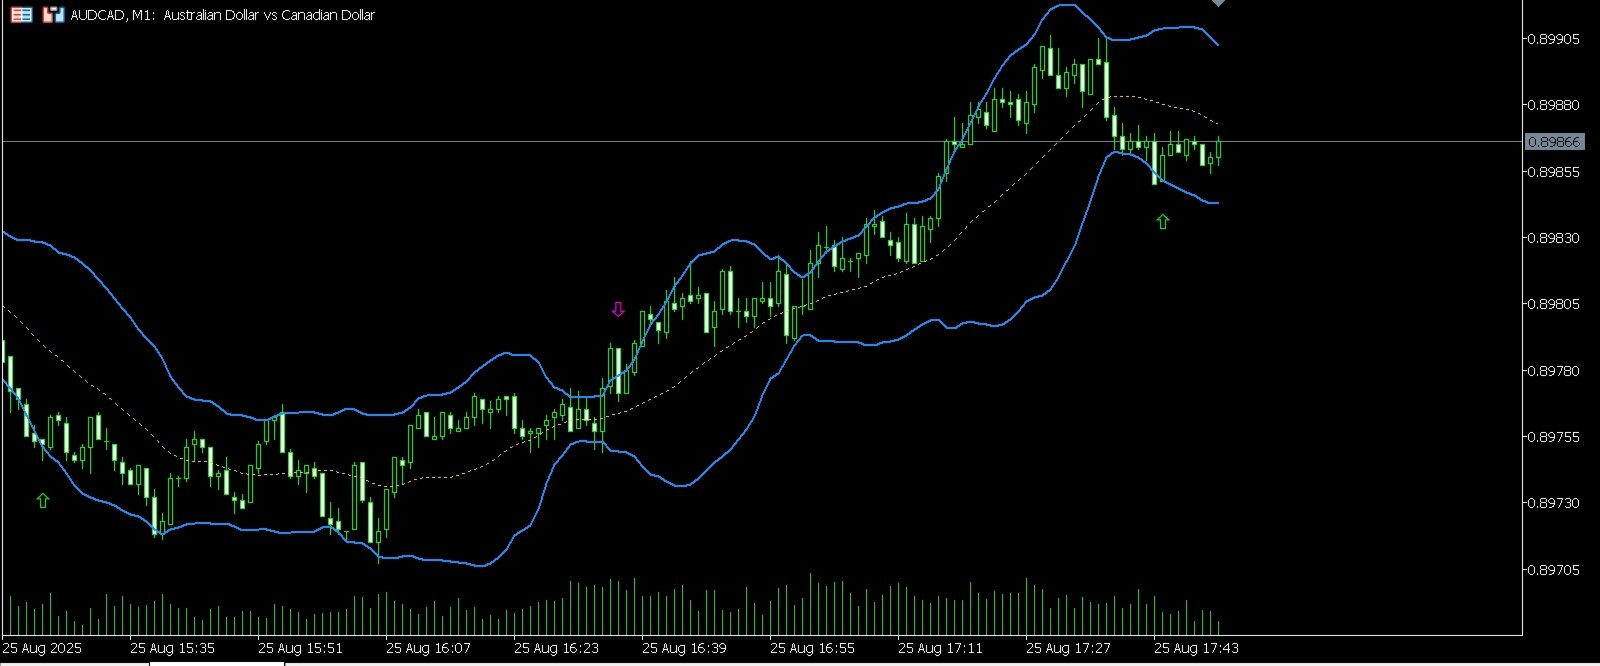
The Dynamic Envelope: At its heart, the indicator uses a dynamic envelope that expands and contracts based on recent market volatility. This is similar in principle to Bollinger Bands. When the market is quiet, the bands tighten. When the market is volatile, the bands widen. This dynamic nature ensures that the signals are always in context with the current trading environment.
-
The Crossover Signal: The magic happens when the price interacts with these outer bands, signaling a potential reversal or a return to the mean.
-
Buy Signal: A buy arrow is generated when the price first closes below the lower envelope band and then, on the next bar, closes back above it. This classic "crossover" indicates that selling momentum has likely exhausted, and the price is reverting from an oversold condition, presenting a potential buying opportunity.
-
Sell Signal: A sell arrow appears when the price first closes above the upper envelope band and then, on the next bar, closes back below it. This signals that buying pressure may be fading from an overbought condition, offering a potential selling or shorting opportunity.
-
Because the signals are only confirmed upon the close of the bar, they are non-repainting, giving you the confidence to act on them.
Key Features
-
Clear and Simple Visual Alerts: Clean, un-cluttered buy and sell arrows tell you exactly when a trade setup has occurred. No complex lines or confusing histograms.
-
Adaptive to Market Volatility: The underlying envelope automatically adjusts to the market's rhythm, providing more reliable signals than static, fixed-level indicators.
-
Built-in Signal Filter: Avoid over-trading in choppy markets. The indicator includes an optional "bars delay" feature, allowing you to set a minimum number of bars that must pass before a new signal can be generated. This helps filter out noise and focus on more significant market moves.
-
Fully Customizable: Tailor the indicator to your exact trading style and preferred market. You have full control over the envelope's period and deviation, the price source (Typical, Close, etc.), colors, arrow sizes, and more.
-
Comprehensive Logging for Analysis: For advanced traders and strategy developers, the indicator includes a detailed logging system. You can monitor every signal, including skipped ones, in the terminal or a dedicated file to fine-tune your settings and analyze performance.
How to Trade with the Visual Dynamic Envelope Crossover
This indicator is versatile and can be used in several ways:
-
As a Primary Entry Tool: Use the buy and sell arrows as your main entry signals, especially in ranging or mean-reverting markets.
-
As a Confirmation Tool: Combine the signals with your existing strategy. For example, you could take a buy signal only if it aligns with a major support level or a bullish trendline.
-
Across All Markets and Timeframes: The indicator's adaptable logic makes it effective for forex, commodities, indices, and stocks, from scalping on lower timeframes to swing trading on daily charts.
Input Parameters Explained
Dynamic Envelope Settings
-
Envelope Period: The number of bars used to calculate the central moving average and the standard deviation for the envelope. Higher values result in a smoother envelope and fewer signals.
-
Envelope Deviation: The multiplier for the standard deviation. A higher value pushes the upper and lower bands further away from the center line, resulting in fewer but potentially more significant signals.
-
Applied Price: The price data used for the calculation (e.g., Close, Open, High, Low, Typical).
-
Show Envelope Lines: Toggles the visibility of the upper, middle, and lower envelope lines on the chart.
-
Lot Size (Manual Trading): A reference field for your manual trading lot size. Does not automate trading.
-
Arrow Offset (Points): Adjusts how far the entry arrow appears above or below the price bar, measured in points.
Signal Controls
-
Enable bars between signals: Activates or deactivates the signal filter.
-
Bars to wait between signals: If the filter is enabled, this sets the minimum number of bars that must pass after a signal before a new one can appear.
Visual Settings
-
Arrow Size (1-5): Sets the visual size of the buy and sell arrows.
-
Buy Signal Color: Customizes the color of the buy arrows.
-
Sell Signal Color: Customizes the color of the sell arrows.
Logging Settings
-
Show detailed logs in journal: Enables or disables the printing of signal information to the Experts journal.
-
Log to file instead of terminal: When enabled, logs are written to a file in your MQL5/Files directory instead of the terminal.
-
Log file name prefix: Sets the base name for the log file.
-
Maximum log file size in MB: Sets a size limit for log files to prevent them from becoming too large. The indicator will automatically create a new file when the limit is reached.