Stochastic Divergence Indicator for MT5
- Indicators
- Eda Kaya
- Version: 3.1
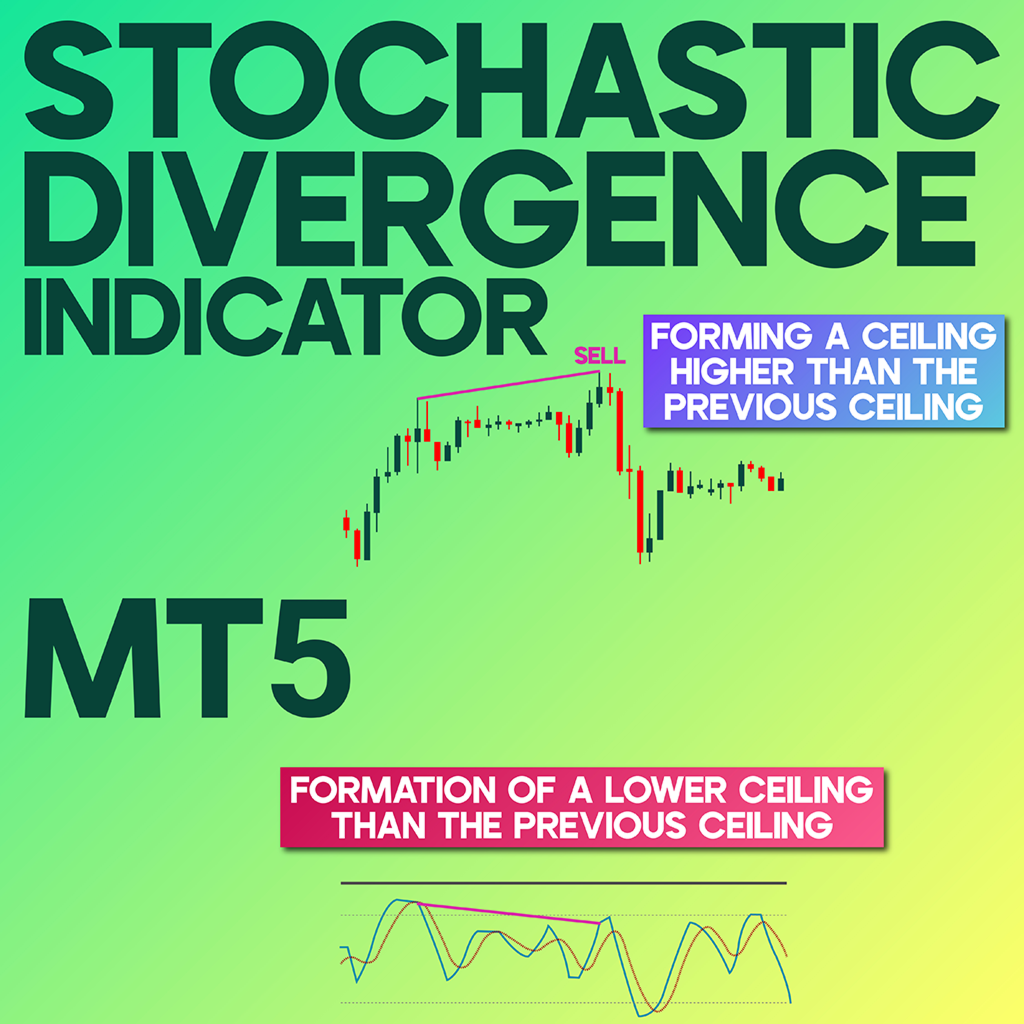
Stochastic Divergence Indicator MetaTrader 5
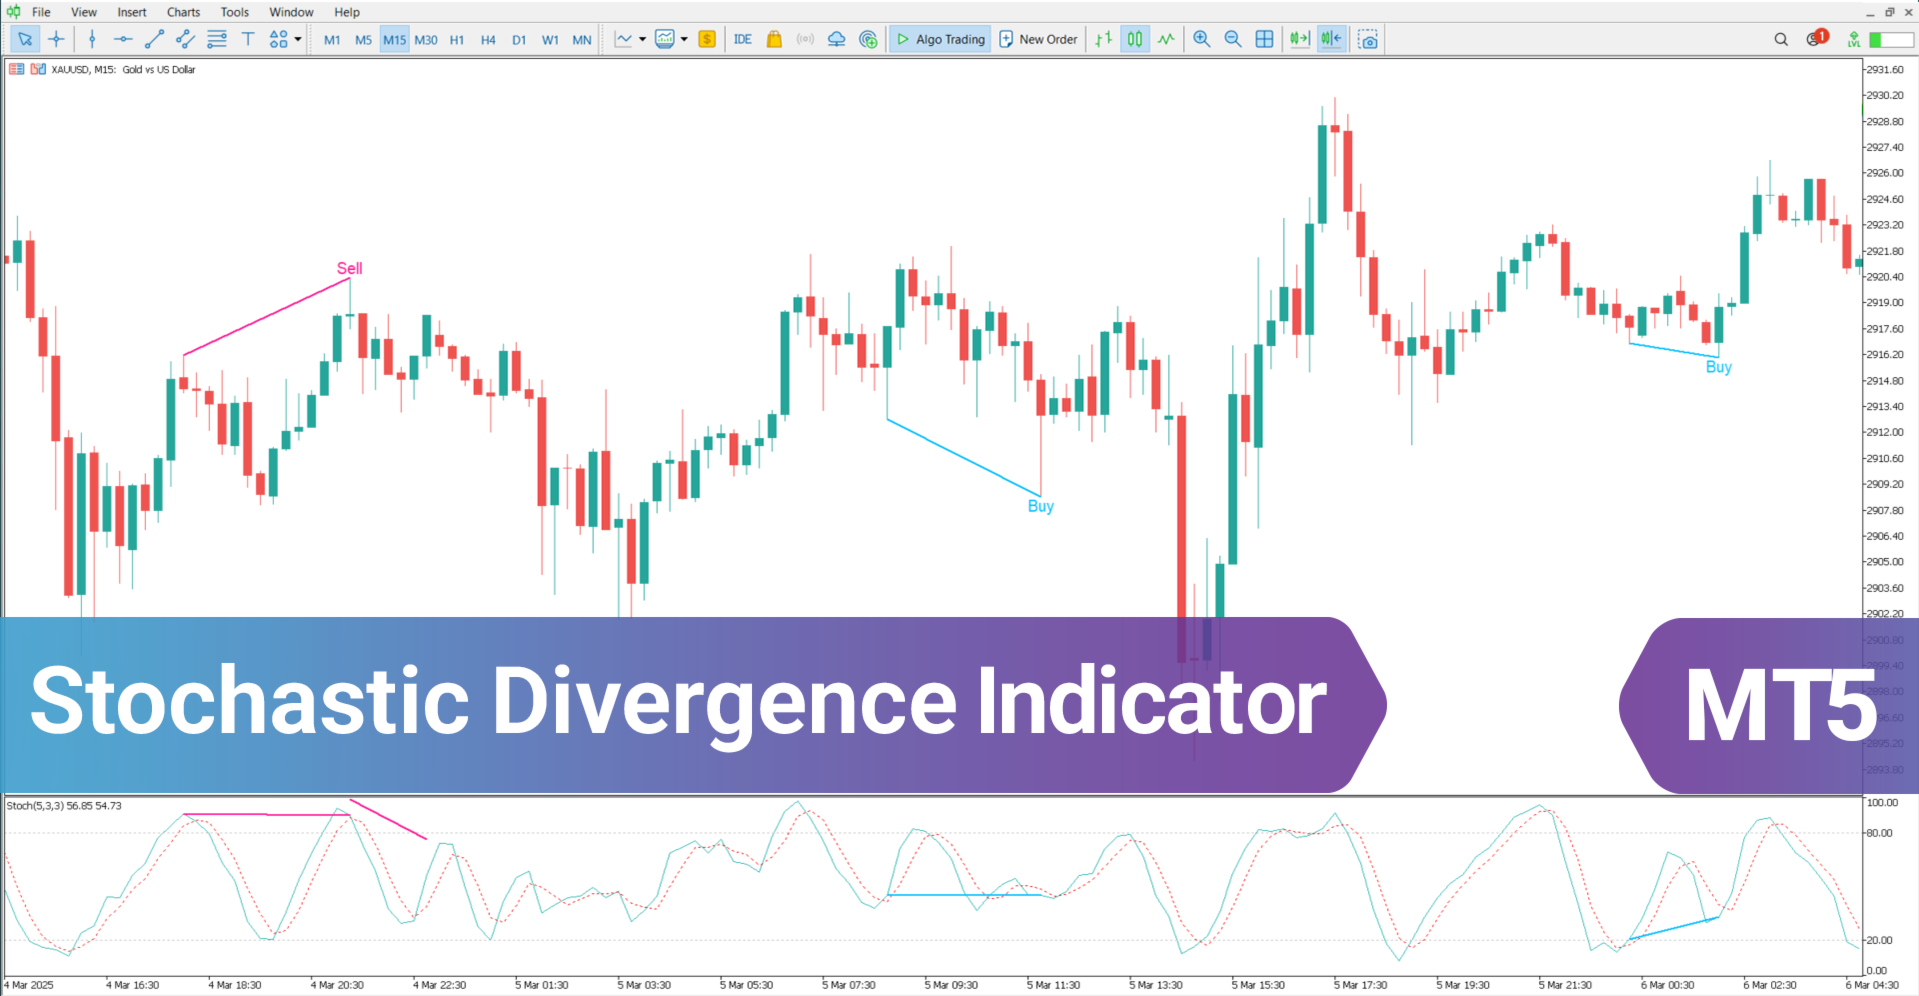
The Stochastic Divergence Indicator is designed to detect trend divergences between price action and the Stochastic Oscillator. This MetaTrader 5 tool automatically highlights divergence zones using blue and pink lines. It also displays “Buy” and “Sell” signals directly on these lines, indicating potential entry and exit points.
«Indicator Installation & User Guide»
MT5 Indicator Installation | Stochastic Divergence Indicator for MT4 | ALL Products By TradingFinderLab | Best MT5 Indicator: Refined Order Block Indicator for MT5 | Best MT5 Utility: Trade Assistant Expert TF MT5 | TP & SL Tool: Risk Reward Ratio Calculator RRR MT5 | Prop Firm Protector: Trade Assist Prop Firm Plus TF Expert MT5 | Money Management + DrawDown Protector: Trade Panel Prop Firm Drawdawn Limiter Pro MT5
Stochastic Divergence Specifications Table
The table below shows the specifications of the Stochastic Divergence Indicator:
| Category | Oscillator – Trading Tool – Price Action |
| Platform | MetaTrader 5 |
| Skill Level | Intermediate |
| Indicator Type | Reversal – Overbought and Oversold |
| Timeframe | Multi Timeframe |
| Trading Style | Intraday Trading |
| Trading Market | All Markets |
Stochastic Divergence Indicator Overview
Stochastic Divergence signals potential trend reversals when there is a mismatch between the price direction and the Stochastic Oscillator. This MetaTrader 5 oscillator analyzes the momentum and strength of price movements, identifying overbought and oversold zones, and forecasting possible trend changes.
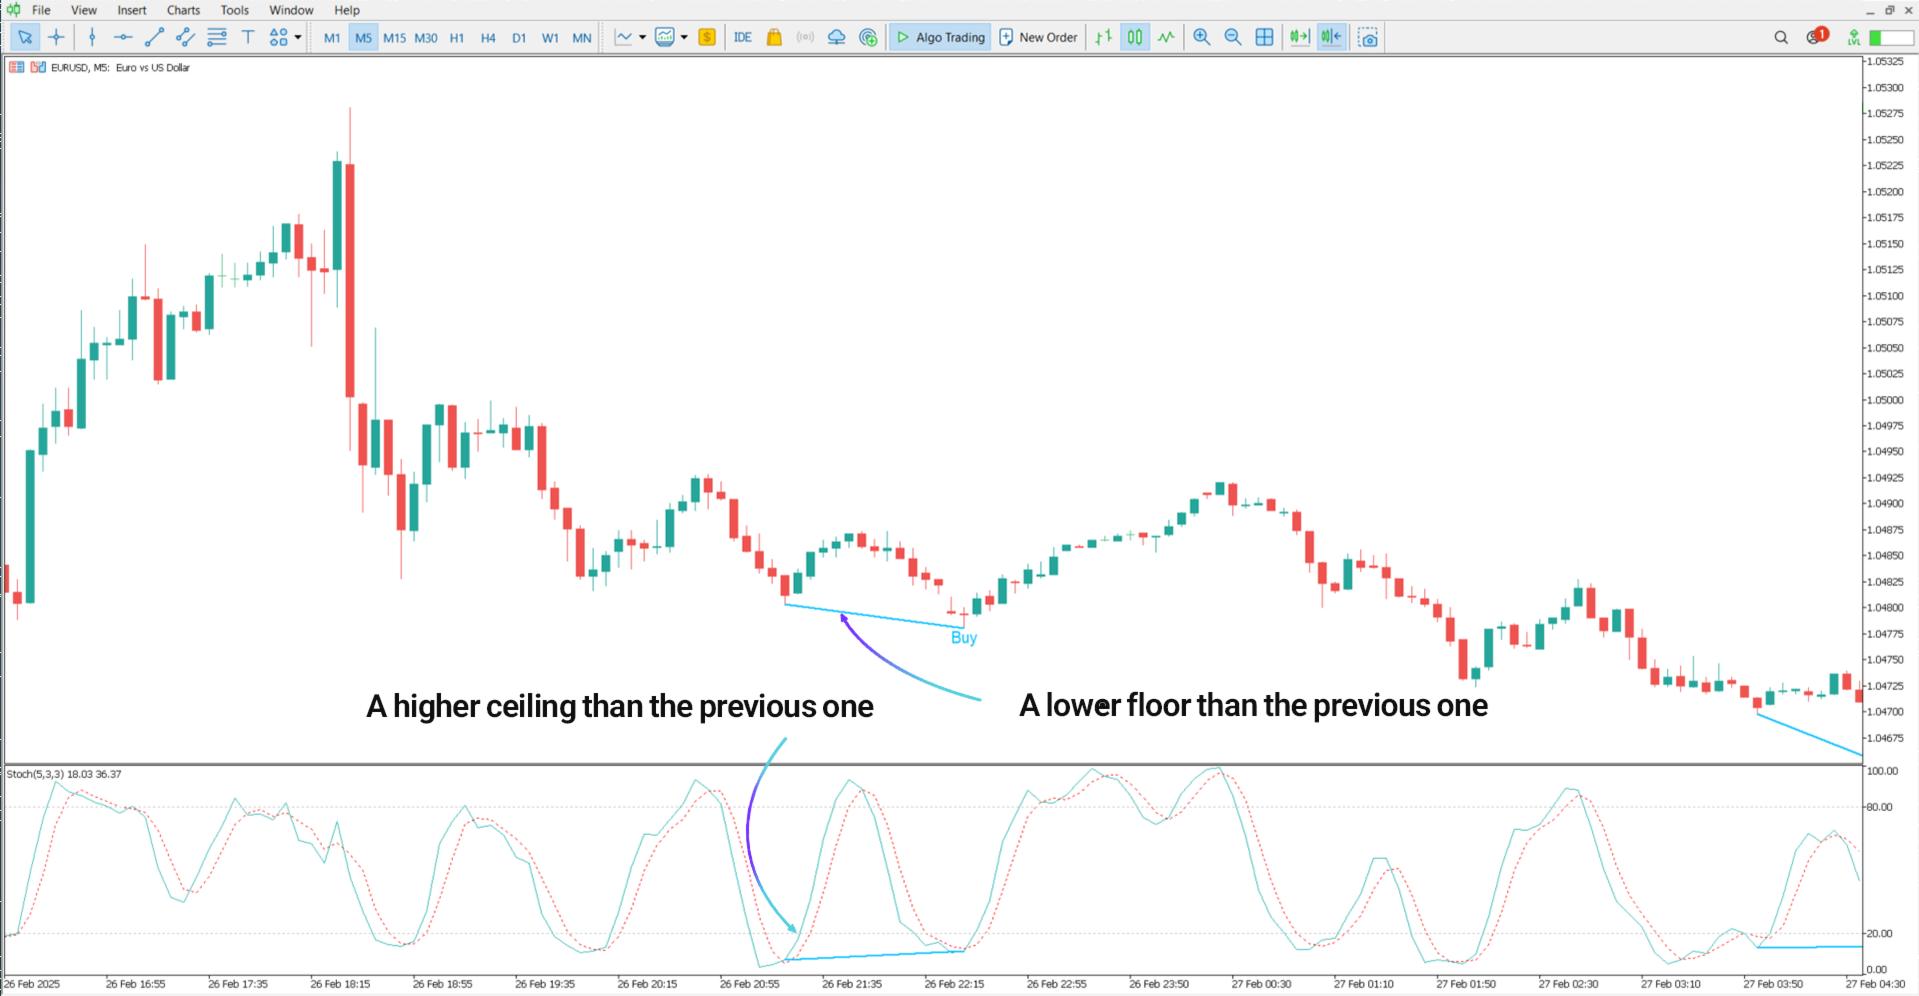
Uptrend Conditions
The chart below illustrates the EUR/USD pair on a 5-minute timeframe. A bullish divergence occurs when the price records a new lower low, while the Stochastic Oscillator forms a higher low. This suggests declining selling pressure and the possibility of an upward trend reversal, prompting a Buy signal to appear on the chart.
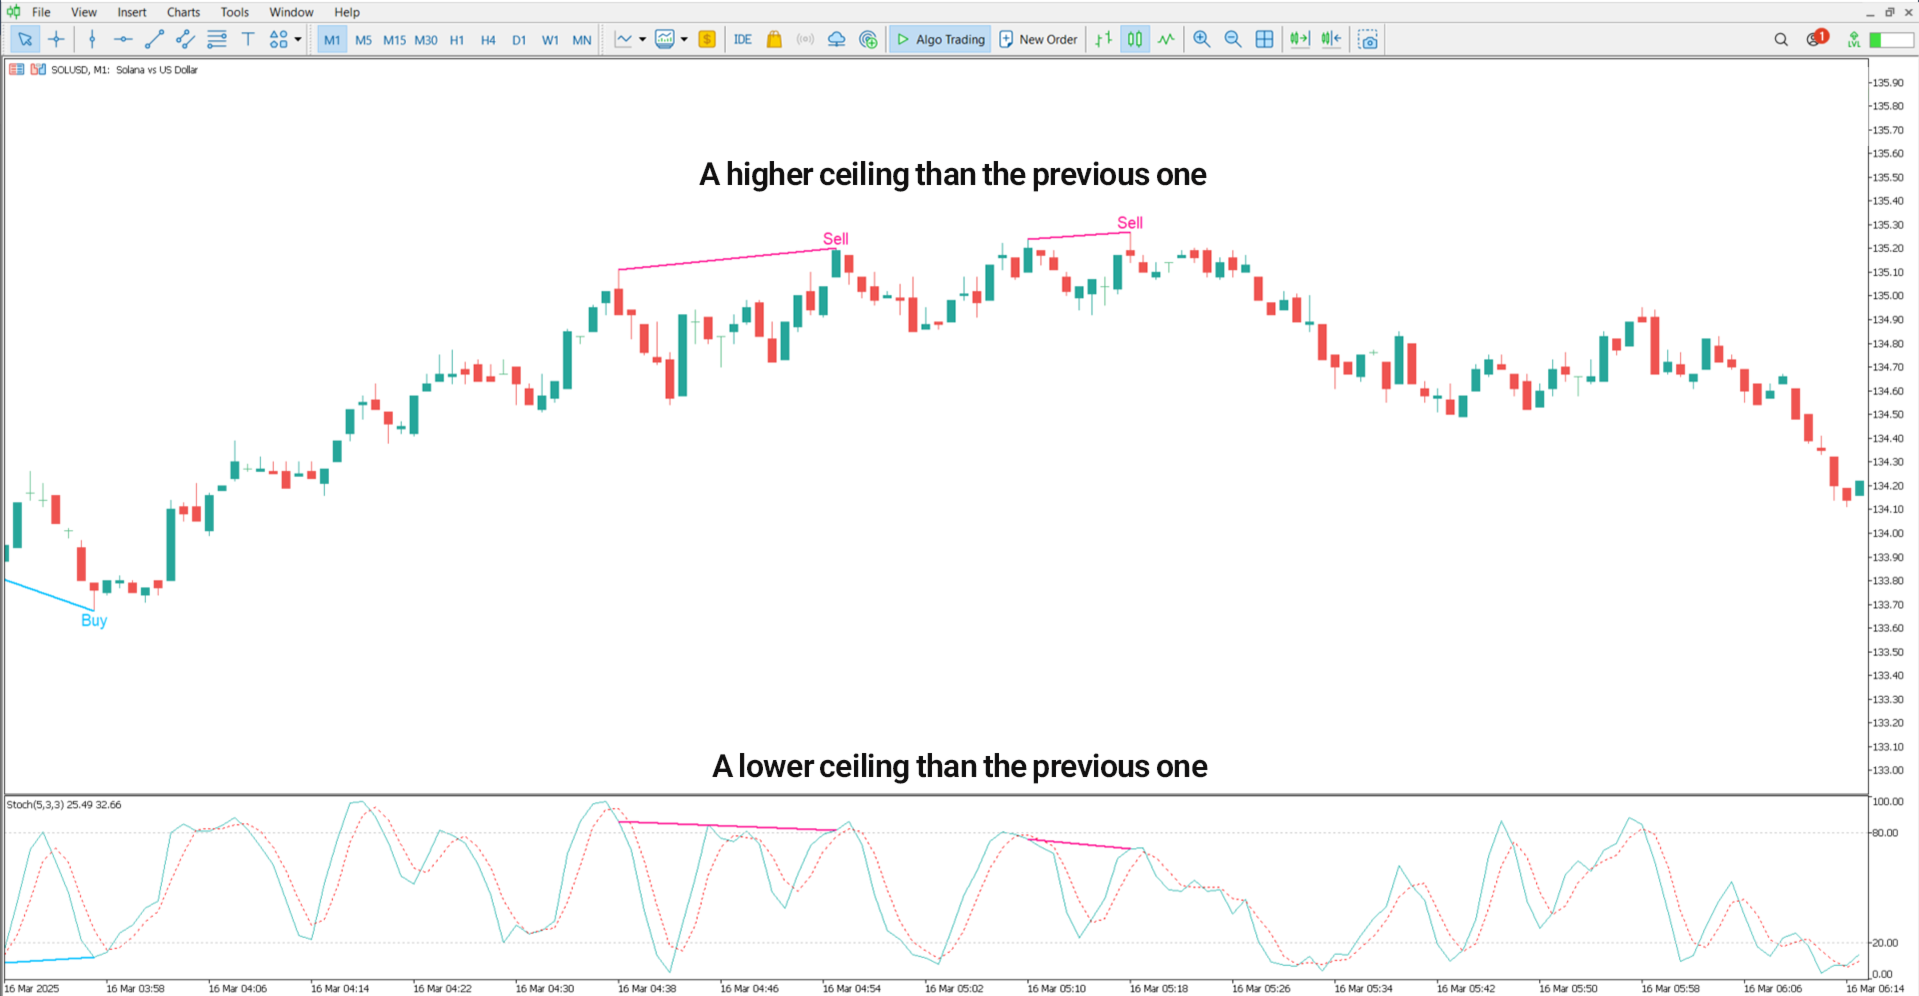
Downtrend Conditions
On the 1-minute chart of Solana (SOL/USD), a bearish divergence is observed when the price hits a new higher high, but the oscillator registers a lower high. This discrepancy indicates fading buying strength and the potential for a downward trend shift, signaling Sell opportunities.
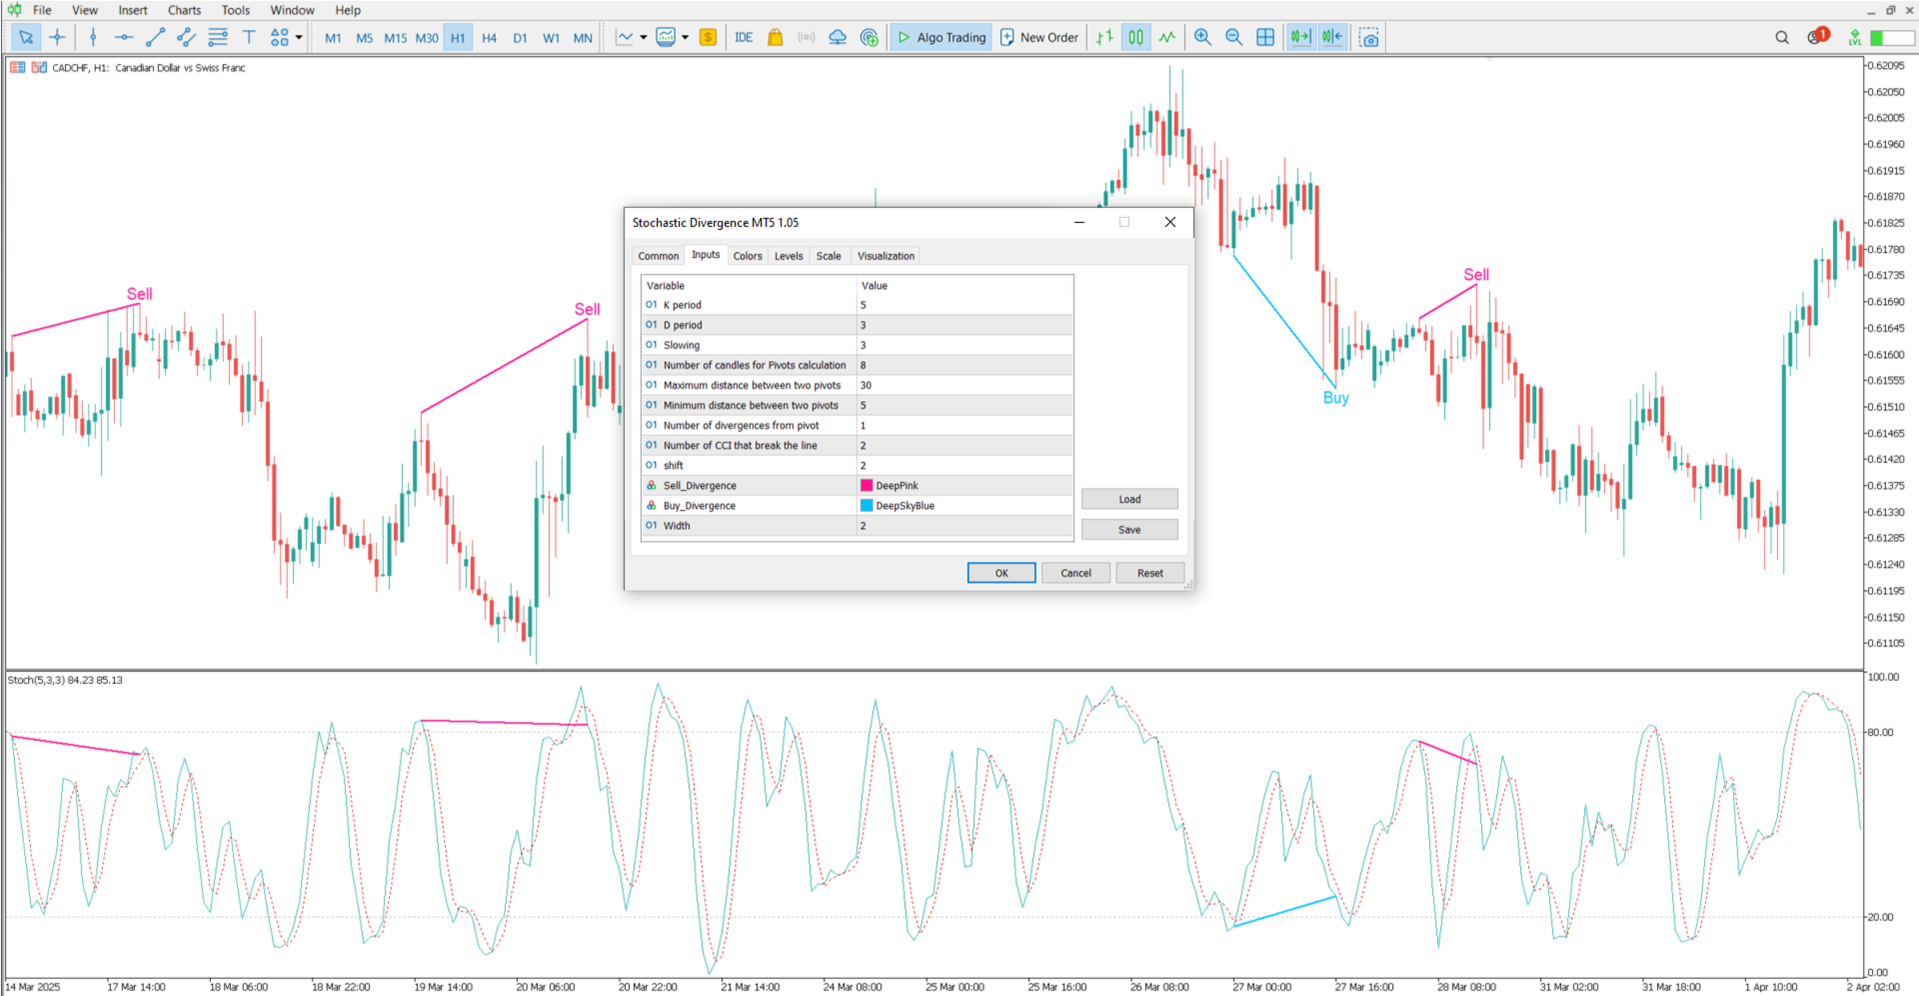
Indicator Settings
The image below displays the customizable settings available in the Stochastic Divergence Indicator:
- K Period: K Length
- D Period: D Length
- Slowing: Deceleration
- Number of Candles for Pivots Calculation: Candle Count for Pivots
- Maximum Distance Between Two Pivots: Max Pivot Distance
- Minimum Distance Between Two Pivots: Min Pivot Distance
- Number of Divergences from Pivot: Divergence Count
- Number of Main Stochastic Breaks: Main Stochastic Breaks Count
- Shift: Displacement or Offset
- Sell Divergence: Color for Sell signals
- Buy Divergence: Color for Buy signals
- Width: Line thickness
Conclusion
The Stochastic Divergence Indicator for MetaTrader 5 automatically detects and marks divergences between price movements and the Stochastic Oscillator. It serves as a reliable price action tool by providing real-time Buy and Sell signals via colored lines on the chart.