Range Canvas MT5
- Indicators
- Luke Anthony Caras
- Version: 1.2
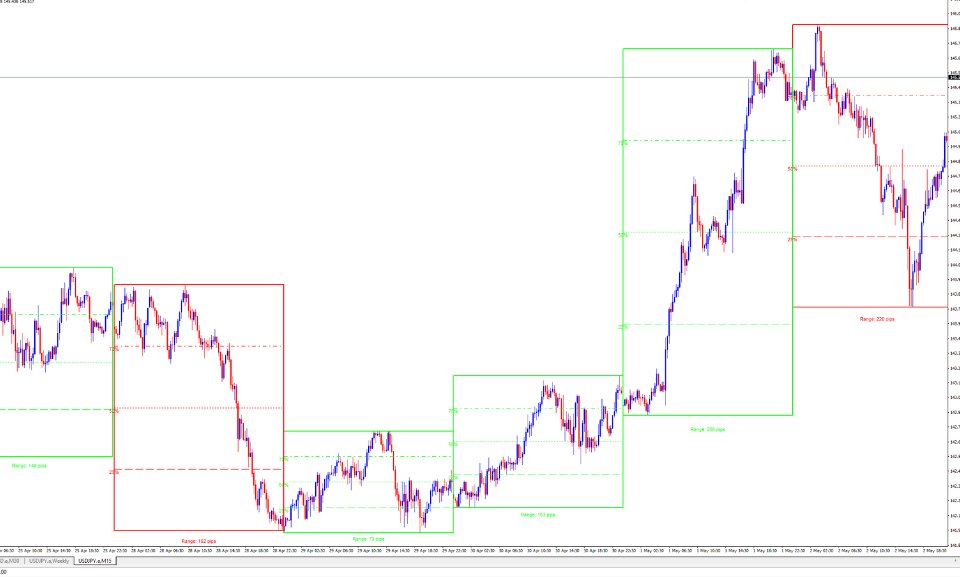
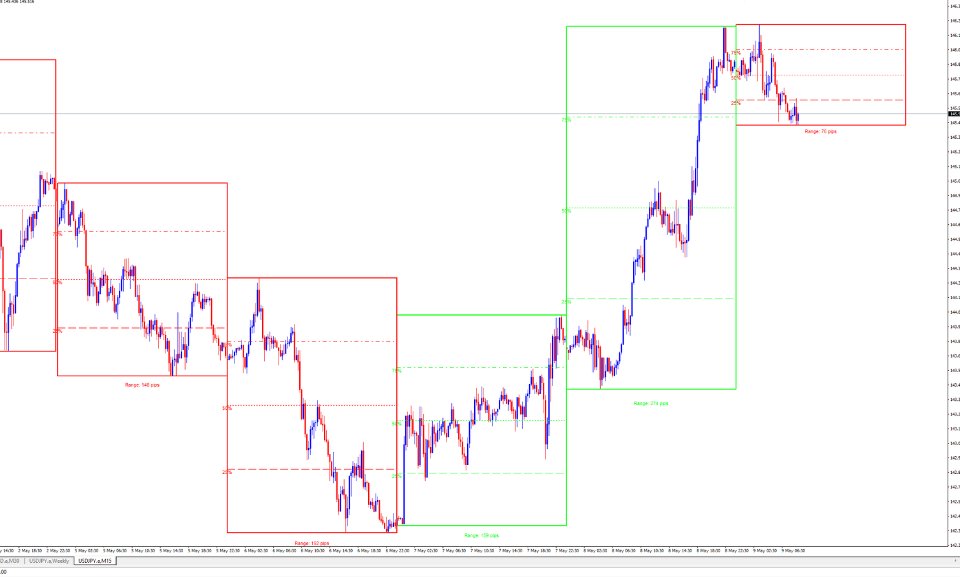
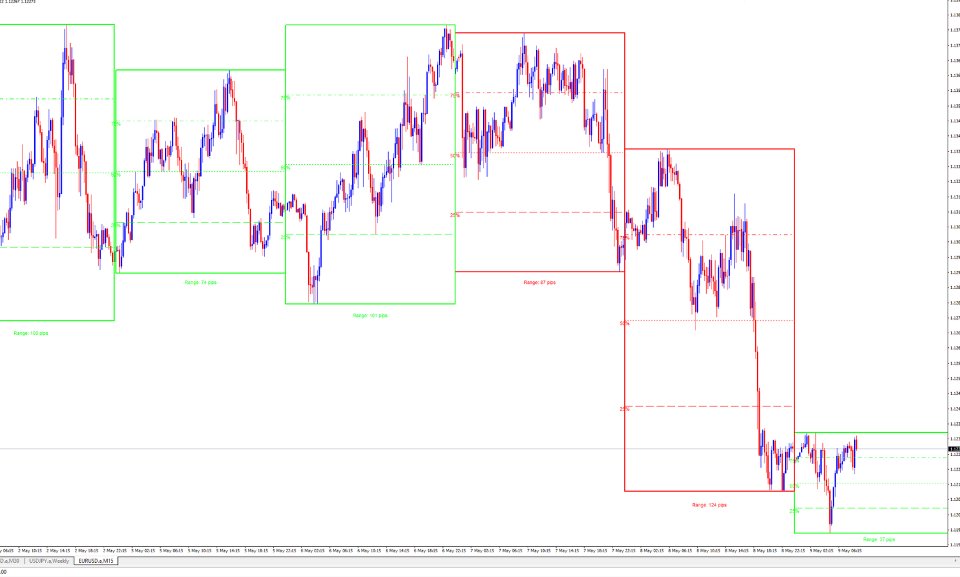
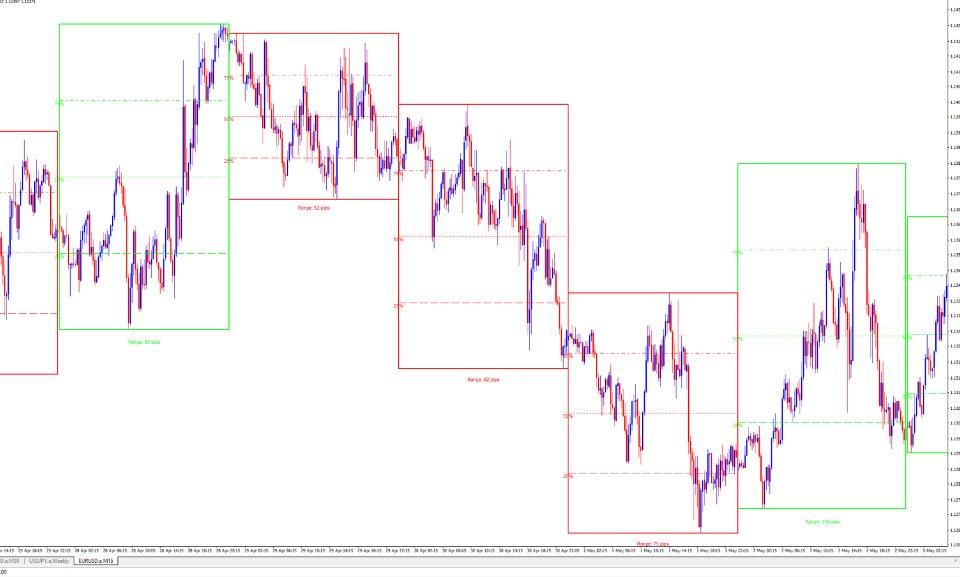
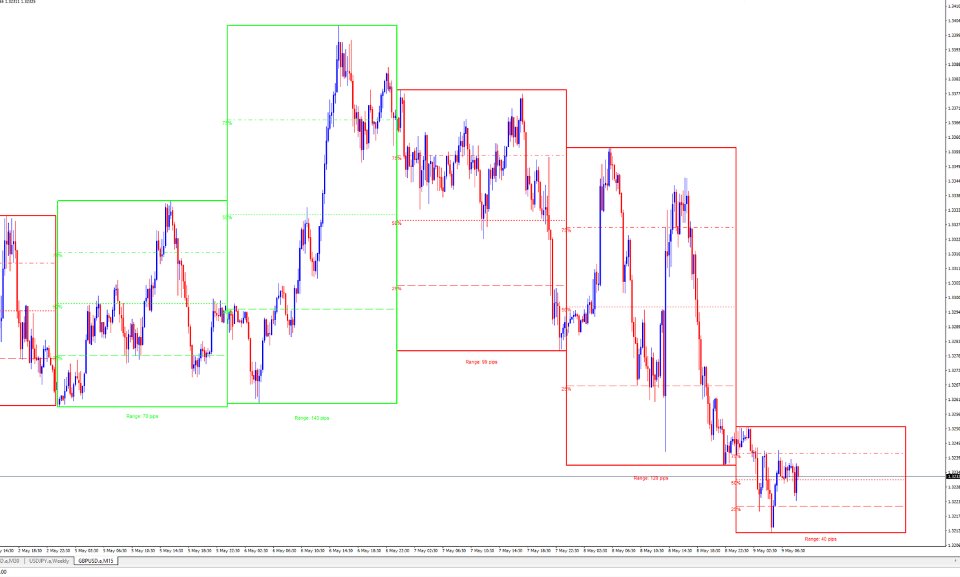
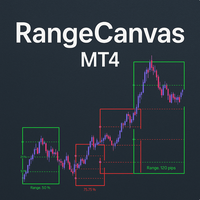
Daily Range Boxes: The indicator draws rectangular boxes around each day's high and low prices, creating a clear visual boundary for the daily trading range.
Color-Coded Logic:
- Green boxes when the current price (or close) is above the daily open
- Red boxes when the current price is below the daily open
Percentage Level Lines: Inside each box, it draws three horizontal lines at:
- 25% of the daily range
- 50% of the daily range (midpoint)
- 75% of the daily range
Range Information: Each box displays the pip range at the bottom, showing exactly how many pips the day moved from high to low.
Customizable Settings
The indicator offers extensive customization options:
- Number of days to display (default: 50)
- Box colors for bullish/bearish days
- Line styles and widths for both boxes and percentage lines
- Transparency level for the boxes
- Option to show/hide the percentage lines
Practical Use
This indicator is particularly useful for:
- Support/Resistance Analysis: Daily highs and lows often act as key levels
- Range Trading: Identifying when price is at the top, middle, or bottom of daily ranges
- Volatility Assessment: Quickly seeing which days had larger or smaller ranges
- Pattern Recognition: Spotting trends in how price interacts with daily levels
The visual representation makes it easy to spot patterns like whether price tends to respect certain percentage levels within daily ranges, or how current price action compares to recent daily ranges.














overall experience is good ....