Volume Profile DD 1A

5

IMPORTANT NOTICE – LICENSE & ACTIVATION REQUIRED
🚨 Activation Instructions:
Upon completing your purchase, please contact us immediately to receive your license key, password, or activation details. Without these, the software will not function. We are here to ensure a seamless activation process and assist you with any questions.

Multilingual Customization 🌍
To enhance your trading experience, we offer full customization of the software in multiple languages. Our team can provide translations in:
📌 Chinese | 📌 French | 📌 Portuguese | 📌 Spanish | 📌 Russian
📌 Japanese | 📌 German | 📌 Korean | 📌 Italian | 📌 Turkish

Simply inform us of your preferred language, and we will tailor the indicator to ensure a user-friendly experience.

Volume Profile – Advanced Market Analysis Tool
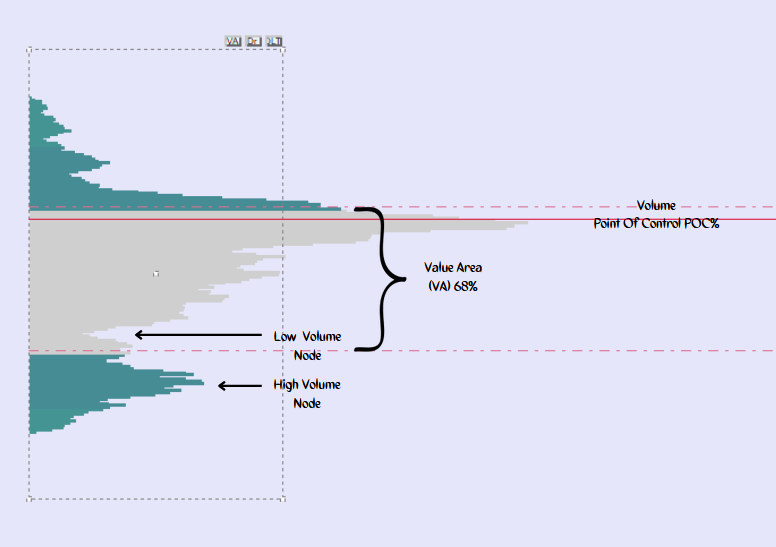
The Volume Profile is a sophisticated analytical tool designed to provide traders with deep insights into market dynamics. It captures price fluctuations over time, offering a live graphical representation of auction data that reveals collective behavioral patterns influencing price movements.

At its core, the Value Area represents the price range containing 68% of the day’s trading activity. This zone, aligned with standard deviation, highlights where the majority of trades occur.

Key Features:

  • Volume Point of Control (VPOC): Identifies the fair price level with the highest traded volume within a specified period.

  • Value Area High (VAH) & Value Area Low (VAL): Define the upper and lower boundaries of the value area.

  • Developing Value Area: Tracks the evolving value range in real-time, offering insights into market shifts.

This MT4-compatible indicator works seamlessly across tick, minute, and range bars, with flexible adjustments to suit your trading strategy. It helps traders accurately identify support and resistance levels by fine-tuning the Value Area and look-back period.

Additionally, the indicator continuously plots the Value Area and VPOC for both current and previous day’s candlesticks, making it particularly effective for lower time frames.

Enhanced Functionalities & Customization
To streamline your analysis, the Volume Profile indicator includes intuitive features:

  • Value Area Toggle (VA): Show or hide the Value Area instantly.

  • Drawing Toggle (DR): Enable or disable the Volume Profile drawing for a clear chart view.

  • Delete Profile (DLT): Quickly remove the profile to maintain a clean and focused chart.

A movable rectangular box allows for precise positioning of the profile to:

  • Measure specific price zones

  • Identify key supply and demand areas

  • Pinpoint critical support and resistance levels

This combination of customization, intuitive controls, and precision tools ensures every trader can tailor their analysis for maximum effectiveness.

Inputs/Features:
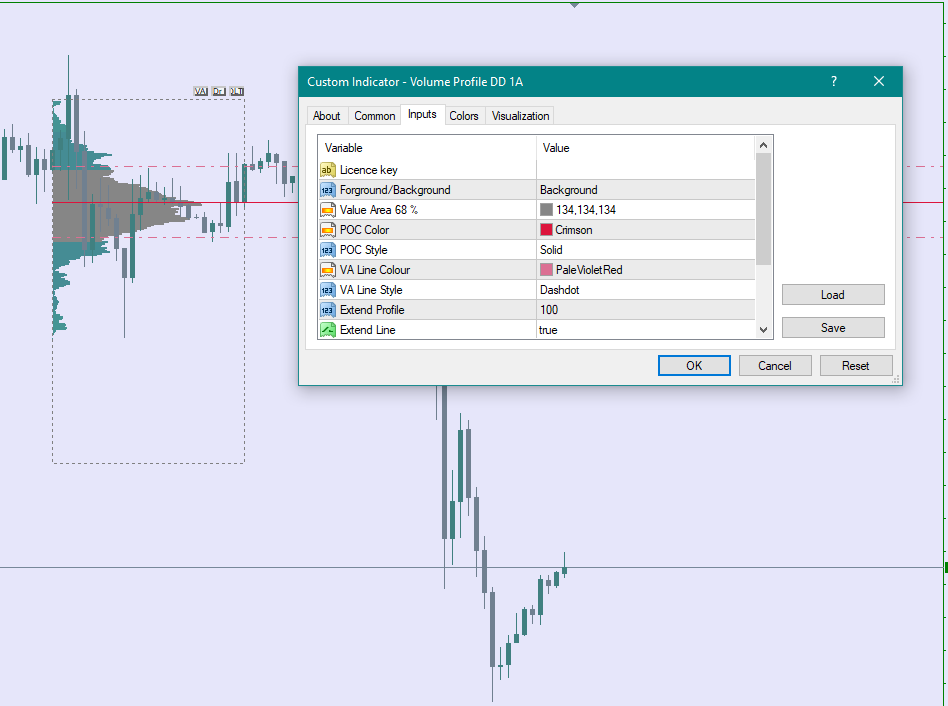
✔ Foreground or Background Display
✔ Value Area (VA) Toggle
✔ Point of Control (POC) 68%
✔ Value Area Line
✔ Extended POC

Visualization Options
Color Schemes:

  • PColor Enum:

    • C1: Mono Color

    • C2: Gauss Bell Color (gradient effect)

  • Customizable colors for:

    • Main profile (MainClr)

    • Point of Control (POC) (POCClr)

    • Statistical lines (e.g., 25% and 87% levels)

Profile Display:

  • Profiles can be drawn in the background (U1) or foreground (U2) via enum_bUp.

  • Interactive buttons:

    • Dr: Drag profile

    • DLT: Delete profile

    • VA: Toggle value area lines

Key Levels:

  • POC (Point of Control) displayed as a solid line.

  • Optional 25% and 87% lines with configurable styles and colors.

  • Price range divided into segments (div = 10 by default) for volume distribution.

Interactive Controls
Keyboard Shortcuts:

  • Q (KeyRoll): Toggles between mono and Gauss color schemes.

  • W (HShowLevels): Toggles horizontal level visibility.

  • A (KeyTop): Switches between background and foreground display.

  • Z (KeyFix): Toggles chart scale fixing.

Mouse Events:

  • Double-click to start drawing a rectangular profile area.

  • Drag to adjust the rectangle, then click to finalize.

Performance Optimization

  • Utilizes caching (ProfileData struct) to store profile data and reduce redraw overhead.

  • Limits redraw time to 500ms (maxTime) to avoid lag.

  • Only redraws profiles when necessary (e.g., on scroll, zoom, or data change).

Recommended System Specifications:

  • Minimum RAM: 2GB (4GB or more recommended for smoother performance).

  • Processor: Multi-core CPU (Intel i5/i7 or AMD Ryzen 5/7 and above preferred).

  • Graphics: Dedicated GPU (optional, but recommended for rendering large datasets).

  • Storage: SSD recommended for faster data access.

Data Processing

  • Fetches tick volume, high, and low prices from the M1 (1-minute) timeframe.

  • Calculates volume distribution across price levels within the defined time range.

  • Supports retry logic (up to 3 attempts) for data fetching to handle potential failures.

🚀 Get Started Today!
✔ Secure your license now and gain full access to this advanced trading tool.
✔ Contact us immediately after purchase to receive your license key, password, or activation details.
✔ Need the indicator in your preferred language? Let us know, and we’ll customize it for you!

We’re here to support you every step of the way. Reach out to us for any assistance or questions!


Reviews 2
Adelheid Mauler
834
Adelheid Mauler 2024.06.21 13:20 
 

Alles in Ordnung der Indikator funktioniert

Recommended products
Volume Profile Sniper v11.1 is a comprehensive market analysis tool A professional approach to trading Volume Profile Sniper v11.1 combines more than 15 key filters in one indicator, providing clear signals based on a comprehensive assessment of the market situation. Main features Volume imbalance analysis – the algorithm calculates the share of buyers and sellers in each candle, signaling the predominance of one of the parties (configurable threshold from 50% to 90%). Multilevel signal filte
The indicator builds current quotes, which can be compared with historical ones and on this basis make a price movement forecast. The indicator has a text field for quick navigation to the desired date. Options: Symbol - selection of the symbol that the indicator will display; SymbolPeriod - selection of the period from which the indicator will take data; IndicatorColor - indicator color; Inverse - true reverses quotes, false - original view; Next are the settings of the text field, in w
Volume Compair
Thiago Pereira Pinho
5 (1)
Professional Cumulative Delta & Volume Median Indicator Track   real buying/selling pressure   with this powerful volume analysis tool. The   Volume Compare Indicator   combines   Cumulative Delta   and   Volume Medians   to help you identify institutional activity, imbalances, and potential reversals. Key Features: Cumulative Delta Histogram   – Visualizes net buying vs. selling volume in real-time. Buy/Sell Volume Medians   – Horizontal lines showing average buy & sell volume levels. Smart Vo
BoxChart MT4
Evgeny Shevtsov
4.4 (5)
The market is unfair if only because 10% of participants manage 90% of funds. An ordinary trader has slim changes to stand against these "vultures". This problem can be solved. You just need to be among these 10%, learn to predict their intentions and move with them. Volume is the only preemptive factor that faultlessly works on any timeframe and symbol. First, the volume appears and is accumulated, and only then the price moves. The price moves from one volume to another. Areas of volume accumu
Blahtech Market Profile
Blahtech Limited
4.53 (15)
Was: $249  Now: $99   Market Profile defines a number of day types that can help the trader to determine market behaviour. A key feature is the Value Area, representing the range of price action where 70% of trading took place. Understanding the Value Area can give traders valuable insight into market direction and establish the higher odds trade. It is an excellent addition to any system you may be using. Blahtech Limited presents their Market Profile indicator for the MetaTrader community. Ins
VN Trade Panel II
Vyacheslav Nekipelov
4 (1)
The new version of the trading panel, which now has the ability to separately close Buy and Sell orders, display targets for all orders on the chart, as well as the ability to use the panel to trade with brokers working on the FIFO rule. Also, the new version adds option buttons for separate management of open orders. It has a convenient visualized interface and intuitive control without a lot of additional tabs to which traders have to be distracted and switch their attention. Thanks to this,
MR Volume Profile 4
Sergey Khramchenkov
The "MR Volume Profile 4" indicator is a charting tool that displays trading volume at different price levels rather than time intervals. A key concept in volume profile is the point of control (POC)—the price level with the highest volume traded during the session or time range. While tools like VWAP or OBV provide volume trends, the "MR Volume Profile 4" indicator offers granular detail about where the most market activity occurs at specific price levels. This makes it a more precise tool for
Time Bubble ***Specialized for GBPJPY 1H time frame*** (tested for two years with success rates about 82%) Time Circle's smart algorithm detects the price circles with time . give strong signals at the right time as result of combine the price and time. our team spent months to develop this indicator specially for GBPJPY ..with high success rates about 82% win trades over two years .tested from December 2016 to November 2018. *** in last two years total signals 1012 with 829 Wins and 183 Lo
MT4 Version : https://www.mql5.com/en/market/product/166784 MT5 Version : https://www.mql5.com/en/market/product/166785 LIQUIDITY PROFILE LIQUIDITY PROFILE is a visual market structure tool that maps potential liquidity zones on the chart using a dynamic heatmap-style profile. This indicator analyzes historical price action and tick volume, then highlights price areas where liquidity is likely concentrated. It draws: Liquidity lines (potential reaction/sweep levels) Heatmap profile boxes (li
VolumeProfile
Robert Hess
3.8 (5)
Descption: The Volume Profile displays detailed informations of historical trading activities at certain price levels (Market Profile). So you can locate the areas with the best prices in the market and get an advantage about other market participants. Features: Customizable Volume Profile / Market Profile Shows the "fair" Value Area with 70% of all Volume Shows critical low volume zones Shows VPOC, VAL and VAH Points Works on all timeframes Also available for MT5 ( https://www.mql5.com/en/mark
A technical indicator that calculates its readings on trading volumes. In the form of a histogram, it shows the accumulation of the strength of the movement of the trading instrument. It has independent calculation systems for bullish and bearish directions. Works on any trading instruments and time frames. Can complement any trading system. The indicator does not redraw its values, the signals appear on the current candle. It is easy to use and does not load the chart, does not require addition
UPD1 Profile Levels
Vitaliy Kuznetsov
5 (7)
The indicator finds the levels of the maximum and minimum price volume (market profile) on the working histogram for the specified number of bars.  Composite profile . The height of the histogram is fully automatic and adapts to any instrument and timeframe. The author's algorithm is used and does not repeat well-known analogues. The height of the two histograms is approximately equal to the average height of the candle. Smart alert will help you to inform about the price concerning the volume
Smart Predictor — Continuous Market Forecasting with Intelligent Signals SmartPredictor  offers a fresh perspective on technical analysis. This indicator combines price data smoothing with advanced forecasting elements to create a seamless, continuous "past-present-future" view. No more guessing where the price might go — you can now see the most probable scenario plotted directly on your chart. Key Innovation: Zero Visual Lag Unlike standard averaging indicators such as moving averages that a
Here   our more valuable tools SMC Trend Trading   ,  Easy SMC Trading  ,  Institutional SMC Architect Volume Analysis Tools  ,  Volume flow Profile  ,  Market volume profile  , FVG with Volume  , Liquidity Heatmap Profile  ,  Volume Spread Analysis The Market Profile & Volume Profile Indicator is a powerful technical analysis tool designed to visualize market activity and price distribution over specific timeframes. Unlike standard technical indicators that focus solely on price over time, th
Daily Candle Predictor is an indicator that predicts the closing price of a candle. The indicator is primarily intended for use on D1 charts. This indicator is suitable for both traditional forex trading and binary options trading. The indicator can be used as a standalone trading system, or it can act as an addition to your existing trading system. This indicator analyzes the current candle, calculating certain strength factors inside the body of the candle itself, as well as the parameters of
GND Tail Candle
Nguyen Dang Giang
A tall upper shadow occurs when the price moves during the period, but goes back down, which is a bearish signal. A tall lower shadow forms when bears push the price down, but bulls pull it back up, which leaves a long line or shadow. This is considered a bullish signal. Some technical analysts believe a tall or long shadow means the stock will turn or reverse. Some believe a short or lower shadow means a price rise is coming. In other words, a tall upper shadow means a downturn is coming, while
Simply The Best Pro
Szymon Palczynski
5 (1)
This indicator displays the histogram and arrows on chart. When Simple The Best Pro are placed on a chart, they identify the trend.  The color of may be blue or red. The blue color stands for upside moves and the red color stands for downside trends. The indicator offers to set Stop Loss (SL) and  Take Profit (TP)  setting. The default value is ATR. Indicator has automatic optimization. The STB is a unique indicator that shows the tendency (button Bars) of a particular signals. The STB tells us
This indicator is a conventional analytical tool for tick volumes changes. It calculates tick volumes for buys and sells separately, and their delta on every bar, and displays volumes by price clusters (cells) within a specified bar (usually the latest one). The algorithm used internally is the same as in the indicator VolumeDelta , but results are shown as cumulative volume delta bars (candlesticks). Analogous indicator for MetaTrader 5 exists - VolumeDeltaBars . This is a limited substitution
Blahtech Supply Demand
Blahtech Limited
4.58 (36)
Was: $299  Now: $99   Supply Demand uses previous price action to identify potential imbalances between buyers and sellers. The key is to identify the better odds zones, not just the untouched ones. Blahtech Supply Demand indicator delivers functionality previously unavailable on any trading platform. This 4-in-1 indicator not only highlights the higher probability zones using a multi-criteria strength engine, but also combines it with multi-timeframe trend analysis, previously confirmed swings
The indicator allows you to trade binary options. The recommended time frame is М1 and the expiration time is 1,2,3 minutes. The indicator suitable for auto and manual trading. A possible signal is specified as a arrows above/under a candle. You should wait until the candle closes! Arrows are not re-painted Trade sessions: TOKYO section (Half-end) Currency pairs: USD/JPY Working time frame: M1 Expiration time: 1,2,3 minutes. The indicator also shows good results when using the martingale strateg
FREE
Dynamic Trend Sniper MT4
Vincent Georges David Ferrier
Trade Like an Institution. Protect Like a Professional. Early Sniper Access: Limited Launch Offer! Get ready to elevate your trading precision. We are offering an exclusive, highly limited launch price for the first Dynamic Trend Sniper users. Our Unbeatable Launch Offer: First 10 Snipers Only: $69 (Full lifetime access + all v1.x updates) Standard Retail Price (After 10 Purchases): $129 Why Act Now? This is not just a discount; it's a strategic entry point. We are committed to rewarding o
Volume Mag
Wiktor Keller
Volume mag indicator is another indicator that is used to calculate entry points tick volume. The indicator rarely gives a signal, but this can be said to be its advantage. The indicator's signals are not redrawn and do not lag, but are issued after the close of the current candle. The indicator does not overload the terminal and calculates entry points within the BarsCount value, which is set in the menu, by default 500 bar.
We present you the indicator "Candle closing counter", which will become your indispensable assistant in the world of trading. That’s why knowing when the candle will close can help: If you like to trade using candle patterns, you will know when the candle will be closed. This indicator will allow you to check if a known pattern has formed and if there is a possibility of trading. The indicator will help you to prepare for market opening and market closure. You can set a timer to create a pre
Pip Rider
Brenden Caleb Luebeck
Tired of looking at indicator cluttered charts? Are you a trend trader? I have just the solution for you. Trend Boss. This indicator allows you to choose some of the most popular trend identifiers such as CCI(Supertrend) or Ichimoku and pair them with some of the most popular entries such as Kijun/Tenkan cross or MACD zero cross. You can now keep your charts clean by hiding all those oscillators and moving averages. Only arrows will be displayed depending on your entry criteria. Trend filters
VR Grid
Vladimir Pastushak
5 (3)
The VR Grid indicator is designed to create a graphical grid with user-defined settings. Unlike the standard grid , VR Grid is used to build circular levels . Depending on the user's choice, the step between the round levels can be arbitrary. In addition, unlike other indicators and utilities, VR Grid maintains the position of the grid even when the time period changes or the terminal is rebooted. You can find settings, set files, demo versions, instructions, problem solving, at [blog] You can
FREE
Скрипт собирает размеры всех ценовых волн на текущем графике, которые не меньше заданной величины, и сохраняет их в CSV файл. Каждая строка таблицы будет содержать дату/время окончания волны и ее размер. Если вам нужно знать размеры волн в реальном времени, то воспользуйтесь индикатором Wave Size into ZigZag , Wave Size Histogram  или ZZ Histogram . ПАРАМЕТРЫ MinWaveSize:  минимальный размер дял волн, которые попадут в статистику PositiveValues:   true  - в файл сохраняется только размер волны
This panel is a part of the SupDem-Pro trading system and is used to search for the best opportunities for any available instruments. Which can be selected manually in the Market Watch (open it with CTRL + M). Using this trading panel in combination with ShvedSupDem-Pro_Zone allows to analyze multiple currency pairs with a single click. The panel allows to load any instruments from the Market Watch, from 6 major currency pairs up to all instruments (480). The indicator parameters Button Width -
Smart Ai Levels Pro+ Wyckoff Theory. Volume Profile. Machine Learning. Institutional Zone Intelligence for Serious Traders This is a sophisticated trading indicator that combines Wyckoff theory, volume profile analysis, machine learning predictions, and multiple timeframe zone calculations. AI-powered Wyckoff zone indicator with real-time volume profile, machine learning reliability predictions, and multi-timeframe cycle analysis. Features 26+ dynamic S/R zones, priority strength markers, volum
TWO PAIRS SQUARE HEDGE METER INDICATOR Try this brilliant 2 pairs square indicator It draws a square wave of the relation between your two inputs symbols when square wave indicates -1 then it is very great opportunity to SELL pair1 and BUY Pair2 when square wave indicates +1 then it is very great opportunity to BUY pair1 and SELL Pair2 the inputs are : 2 pairs of symbols         then index value : i use 20 for M30 charts ( you can try other values : 40/50 for M15 , : 30 for M30 , : 10 for H1 ,
Force Price Power
Jesus Daniel Quiroga
Force Price Power is a very powerful indicator that provides valuable and useful information about the real force of the price, dynamically averaging the volume of operations that are taking place in the market. This indicator is special to identify the dynamic force of the price. The zero distance (either up from zero or down from zero) would indicate the degree of strength and power, whether bearish or bullish.
Buyers of this product also purchase
Neuro Poseidon MT4
Daria Rezueva
4.95 (37)
Neuro Poseidon is a new indicator by Daria Rezueva. It combines precise trading signals with adaptive TP/SL levels - creating best possible trades as a result! Message me and get  Neuro Poseidon Assistant  as a gift to automize your trading process! What makes it stand out? 1. Proven profitability on all assets and timeframes 2. Only confirmed BUY and SELL signals present on the chart 3. Adaptive TP & SL levels generated by the software for each trade 4. Easy to understand - suitable for all
Gann Made Easy
Oleg Rodin
4.84 (165)
Gann Made Easy is a professional and easy to use Forex trading system which is based on the best principles of trading using the theory of W.D. Gann. The indicator provides accurate BUY and SELL signals including Stop Loss and Take Profit levels. You can trade even on the go using PUSH notifications. PLEASE CONTACT ME AFTER PURCHASE TO GET TRADING  INSTRUCTIONS AND GREAT EXTRA INDICATORS   FOR FREE! Probably you already heard about the Gann trading methods before. Usually the Gann theory is a ve
Trend Catcher ind
Ramil Minniakhmetov
5 (3)
TREND CATCHER INDICATOR Trend Catcher Indicator analyzes market price movements, using a combination of the author’s proprietary and customized adaptive trend-analysis indicators.  It identifies the true market direction by filtering out short-term noise and focusing on underlying momentum strength, volatility expansion, and price structure behavior.  It also uses a combination of smoothing and trend-filtering customized indicators such as moving averages, RSI, and volatility filters.   Real ope
Dynamic Forex28 Navigator
Bernhard Schweigert
4.43 (7)
Specials Discount now. The Next Generation Forex Trading Tool. Dynamic Forex28 Navigator is the evolution of our long-time, popular indicators, combining the power of three into one: Advanced Currency Strength28 Indicator (695 reviews) + Advanced Currency IMPULSE with ALERT (520 reviews) + CS28 Combo Signals (recent Bonus) Details about the indicator  https://www.mql5.com/en/blogs/post/758844 What Does The Next-Generation Strength Indicator Offer? Everything you loved about the originals, now
M1 Sniper
Oleg Rodin
5 (24)
M1 SNIPER is an easy to use trading indicator system. It is an arrow indicator which is designed for M1 time frame. The indicator can be used as a standalone system for scalping on M1 time frame and it can be used as a part of your existing trading system. Though this trading system was designed specifically for trading on M1, it still can be used with other time frames too. Originally I designed this method for trading XAUUSD and BTCUSD. But I find this method helpful in trading other markets a
MetaBands M4
Vahidreza Heidar Gholami
3.5 (6)
MetaBands uses powerful and unique algorithms to draw channels and detect trends so that it can provide traders with potential points for entering and exiting trades. It’s a channel indicator plus a powerful trend indicator. It includes different types of channels which can be merged to create new channels simply by using the input parameters. MetaBands uses all types of alerts to notify users about market events. Features Supports most of the channel algorithms Powerful trend detection algorith
This product was   updated   for the   2026 market   and   optimized   for the   latest MT5 builds . PRICE UPDATE NOTICE: Smart Trend Trading System   is currently available for $99. The price will   increase to $199   after the next   30 purchases. SPECIAL OFFER:  After purchasing Smart Trend Trading System, send me a private message to claim the Smart Universal EA for FREE and turn your Smart Trend signals into automated trades. Smart Trend Trading System is a complete non-repainting, non-re
Advanced Supply Demand
Bernhard Schweigert
4.91 (300)
Trading Special – 30% OFF Best Solution for any Newbie or Expert Trader! This indicator is a unique, high quality and affordable trading tool because we have incorporated a number of proprietary features and a new formula. With this update, you will be able to show double timeframe zones. You will not only be able to show a higher TF but to show both, the chart TF, PLUS the higher TF: SHOWING NESTED ZONES. All Supply Demand traders will love it. :) Important Information Revealed Maximize the pot
Scalper Inside PRO
Alexey Minkov
4.68 (69)
Scalper Inside PRO Scalper Inside PRO is an intraday trend and scalping indicator that uses exclusive built-in algorithms to evaluate market direction and key target levels. The indicator automatically calculates entry and exit points and several profit target levels, and it shows detailed performance statistics, so you can see how different instruments and strategies behaved on historical data. This helps you select instruments that fit current market conditions. You can also connect your own a
Download user manual from : https://ontrd.com/our-books/ MT5 Version : https://www.mql5.com/en/market/product/30284 Gann Squares Indicator: Analyzing Markets with Geometric Patterns The Gann Squares indicator is a powerful tool for market analysis that draws upon the mathematical concepts introduced by W.D. Gann in his article on "Mathematical Formula for Market Predictions." This indicator incorporates Gann's techniques involving square numbers such as 144, 90, and 52, as well as the Square of
Breakout Arrows Mt4
Michael Oko Oboh
5 (1)
Trend Breakout Arrows Indicator The Trend Breakout Arrows Indicator is a momentum-based signal tool designed to identify potential bullish and bearish breakout opportunities. It displays clear arrow signals directly on the price chart, helping traders quickly recognize possible trend changes and continuation setups. Up Arrow (Buy Signal) A magenta up arrow appears below a candle when bullish momentum begins to strengthen. This signal indicates that buying pressure may be overtaking selling press
Neo Wave PRO
Nikolay Raykov
5 (1)
Price & Time Market Structure Indicator A professional market structure tool that analyzes waves through both price and time — not price alone. Main Description NeoWave PRO is a professional market structure indicator for MetaTrader 4 designed for traders who want to move beyond traditional one-dimensional wave tools such as ZigZag, swing indicators, and basic high/low systems. Most wave indicators analyze only one thing: Price. But a real market wave is not only a price movement. A true wave de
BTMM State Engine Pro is a MetaTrader 4 indicator for traders who use the Beat The Market Maker approach: Asian session context, kill zone timing, level progression, peak formation detection, and a multi-pair scanner from a single chart. It combines cycle state logic with a built-in scanner dashboard so you do not need the same tool on many charts at once. What it does Draws the Asian session range; session times can follow broker server offset or be set in inputs. Tracks level progression (L
GOLD Impulse with Alert
Bernhard Schweigert
4.67 (12)
This indicator is a super combination of our 2 products  Advanced Currency IMPULSE with ALERT  and  Currency Strength Exotics . It works for all time frames and shows graphically impulse of strength or weakness for the 8 main currencies plus one Symbol! This Indicator is specialized to show currency strength acceleration for any symbols like Gold, Exotic Pairs, Commodities, Indexes or Futures. Is first of its kind, any symbol can be added to the 9th line to show  true currency strength accelerat
PRO Renko System
Oleg Rodin
5 (30)
PRO Renko System is a highly accurate trading system specially designed for trading RENKO charts. The ARROWS and Trend Indicators DO NOT REPAINT! The system effectively neutralizes so called market noise giving you access to accurate reversal signals. The indicator is very easy to use and has only one parameter responsible for signal generation. You can easily adapt the tool to any trading instrument of your choice and the size of the renko bar. I am always ready to provide extra support to help
Trading Special –40% OFF Best Solution for any Newbie or Expert Trader! This Indicator is a unique, high quality and affordable trading tool because we have incorporated a number of proprietary features and a new formula. With only ONE chart you can read Currency Strength for 28 Forex pairs! Imagine how your trading will improve because you are able to pinpoint the exact trigger point of a new trend or scalping opportunity? User manual: click here That's the first one, the original! Don't buy a
The indicator scans for Dinapoli thrust pattern in multiple timeframes for the all markets filtered and shows the results on Dashboard. Key Features Dashboard can be used for all markets It can scan for thrust pattern on MN1, W1, D1, H4, H1, M30, M15 ,M5, M1 timeframes Ability to choose number of bars required above/below displaced moving average to define thrust Parameters UseMarketWatch: Set true to copy all symbols available in market watch MarketWatchCount : Set the number of symbols that
This indicator is an indicator for automatic wave analysis that is perfect for practical trading! Case... Note:   I am not used to the Western name for wave classification. Influenced by the naming habit of Chaos Theory (Chanzhongshuochan), I named the basic wave as   pen   , the secondary wave band as   segment   , and the segment with trend direction   as main trend segment   (this naming method will be used in future notes, let me tell you in advance), but the algorithm is not closely relate
Introduction Harmonic Patterns are best used to predict potential turning point. Traditionally, Harmonic Pattern was identified manually connecting peaks and troughs points in the chart. Manual harmonic pattern detection is painfully tedious and not suitable for everyone. You are often exposed under subjective pattern identification with manual pattern detection. To avoid these limitations, Harmonic Pattern Plus was designed to automate your harmonic pattern detection process. The functionality
Current event:  https://c.mql5.com/1/326/A2SR2025_NoMusic.gif A. What is A2SR ?   * It's a leading technical indicator (no repaint, no lagging). -- Guidance : -- at   https://www.mql5.com/en/blogs/post/734748/page4#comment_16532516 -- and  https://www.mql5.com/en/users/yohana/blog A2SR has a special technique in determining the levels of Support ( demand ) and Resistance ( supply ) . Unlike the ordinary way that we seen on the net, A2SR has a original concept in determining actual SR levels.
KT Alpha Hunter Arrows MT4
KEENBASE SOFTWARE SOLUTIONS
Most arrow indicators give you a signal and leave you to figure out the rest. KT Alpha Hunter Arrows gives you the full trading plan. Every signal arrow prints with a full plan already drawn: entry line, stop-loss, four take-profit levels, and a live edge verdict telling you whether this symbol and time-frame is worth trading right now. An included Trade Manager EA handles the execution after you enter, so discipline stays intact when the market gets loud. Non-repaint. Closed-bar signals only. B
Market Structure Patterns MT4
Samuel Manoel De Souza
5 (18)
Market Structure Patterns   is an indicator based on   smart money concepts   that displays   SMC/ICT   elements that can take your trading decisions to the next level. Take advantage of the   alerts ,   push notifications   and   email messages   to keep informed from when an element is formed on the chart, the price crosses a level and/or enters in a box/zone. Developers can access the values of the elements of the indicator using the   global variables  what allows the automation of trading d
PZ ABCD Retracement
PZ TRADING SLU
4 (5)
Identify precise entry and exit points with AB=CD patterns This indicator finds AB=CD retracement patterns. The AB=CD Retracement pattern is a 4-point price structure where the initial price segment is partially retraced and followed by an equidistant move from the completion of the pullback, and is the basic foundation for all harmonic patterns. [ Installation Guide | Update Guide | Troubleshooting | FAQ | All Products   ] Customizable pattern sizes Customizable AC and BD ratios Customizable b
Trend Lines PRO
Roman Podpora
5 (1)
TREND LINES PRO    helps understand where the market is truly changing direction. The indicator shows real trend reversals and points where major players re-enter. You see   BOS lines   Trend changes and key levels on higher timeframes — without complex settings or unnecessary noise. Signals don't repaint and remain on the chart after the bar closes. VERSION MT 5     -     Reveals its maximum potential when paired with the   RFI LEVELS PRO  indicator What the indicator shows: Real shifts   tren
Legacy of Gann
Pavel Zamoshnikov
4.83 (12)
The indicator very accurately determines the levels of the possible end of the trend and profit fixing. The method of determining levels is based on the ideas of W.D.Gann, using an algorithm developed by his follower Kirill Borovsky. Extremely high reliability of reaching levels (according to K. Borovsky  - 80-90%) Indispensable for any trading strategy – every trader needs to determine the exit point from the market! Precisely determines targets on any timeframes and any instruments (forex, met
RFI levels PRO
Roman Podpora
5 (1)
The indicator accurately shows the reversal points and price return zones where the   Major players . You see where new trends are forming and make decisions with maximum precision, maintaining control over every trade. VERSION MT5     -     Reveals its maximum potential when combined with the   TREND LINES PRO   indicator What the indicator shows: Reversal structures and reversal levels with activation at the beginning of a new trend. Display of   TAKE PROFIT   and   STOP LOSS   levels with mi
Trading Special – 40% OFF Best Solution for any Newbie or Expert Trader! This indicator is a unique, high quality and affordable trading tool because we have incorporated a number of proprietary features and a secret formula. With only ONE chart it gives Alerts for all 28 currency pairs. Imagine how your trading will improve because you are able to pinpoint the exact trigger point of a new trend or scalping opportunity! Built on new underlying algorithms it makes it even easier to identify and c
Day Trader Master is a complete trading system for traders who prefer intraday trading. The system consists of two indicators. The main indicator is the one which is represented by arrows of two colors for BUY and SELL signals. This is the indicator which you actually pay for. I provide the second indicator to my clients absolutely for free. This second indicator is actually a good trend filter indicator which works with any time frame. THE INDICATORS DO NOT REPAINT AND DO NOT LAG! The system is
IQ FX Strength  answers the single most important question in trading: "Who is truly driving the market right now?" Designed with a stunning Hybrid UI, this tool separates true trend moves from market noise, allowing you to catch "Explosive" moves before the crowd sees them. System Requirement: For higher accurate signal and optimal, smoother performance of this indicator without any lag, a good CPU (with   RAM of  atleast 8GB or above) and fast internet connection is highly recommended. IQ FX
Block Master Pro
Stanislav Konin
5 (3)
The Block Master Pro indicator is designed to visually identify areas on the chart where significant volumes from major market participants are likely concentrated. These areas, known as order blocks, represent price ranges where large players place their orders, potentially signaling a price reversal and movement in the opposite direction. Key Features: Order Block Identification: Block Master Pro effectively identifies order blocks by pinpointing price ranges where large orders are placed. Th
More from author
IMPORTANT NOTICE – LICENSE & ACTIVATION REQUIRED Activation Instructions: Upon completing your purchase, please contact us immediately to receive your license key, password, or activation details. Without these, the software will not function. We are here to ensure a seamless activation process and assist you with any questions. Multilingual Customization To enhance your trading experience, we offer full customization of the software in multiple languages. Our team can provide translations
IMPORTANT NOTICE – LICENSE & ACTIVATION REQUIRED   Activation Instructions: Upon completing your purchase, please contact us immediately to receive your   license key, password, or activation details . Without these, the software will not function. We are here to ensure a seamless activation process and assist you with any questions. Multilingual Customization To enhance your trading experience, we offer full customization of the software in multiple languages. Our team can provide tra
IMPORTANT NOTICE – LICENSE & ACTIVATION REQUIRED Activation Instructions: Upon completing your purchase, please contact us immediately to receive your license key, password, or activation details. Without these, the software will not function. We are here to ensure a seamless activation process and assist you with any questions. Multilingual Customization To enhance your trading experience, we offer full customization of the software in multiple languages. Our team can provide translation
Filter:
Kelvin Yu
24
Kelvin Yu 2025.03.25 13:52 
 

User didn't leave any comment to the rating

Adelheid Mauler
834
Adelheid Mauler 2024.06.21 13:20 
 

Alles in Ordnung der Indikator funktioniert

Reply to review