Volume Profile DD 1A
- Indicateurs
- Version: 1.1
- Mise à jour: 3 mars 2025
- Activations: 5
Below is the translation of your original English text into French:
AVIS IMPORTANT – LICENCE ET ACTIVATION REQUISES
🚨 Instructions d’activation :
Dès que vous avez terminé votre achat, veuillez nous contacter immédiatement pour recevoir votre clé de licence, votre mot de passe ou les détails d’activation. Sans ces éléments, le logiciel ne fonctionnera pas. Nous sommes là pour garantir un processus d’activation fluide et vous assister en cas de questions.
Personnalisation multilingue 🌍
Pour améliorer votre expérience de trading, nous proposons une personnalisation complète du logiciel dans plusieurs langues. Notre équipe peut fournir des traductions en :
📌 Chinois | 📌 Français | 📌 Portugais | 📌 Espagnol | 📌 Russe
📌 Japonais | 📌 Allemand | 📌 Coréen | 📌 Italien | 📌 Turc
Il vous suffit de nous indiquer votre langue préférée, et nous adapterons l’indicateur pour garantir une expérience conviviale.
Profil de volume – Outil d’analyse de marché avancé
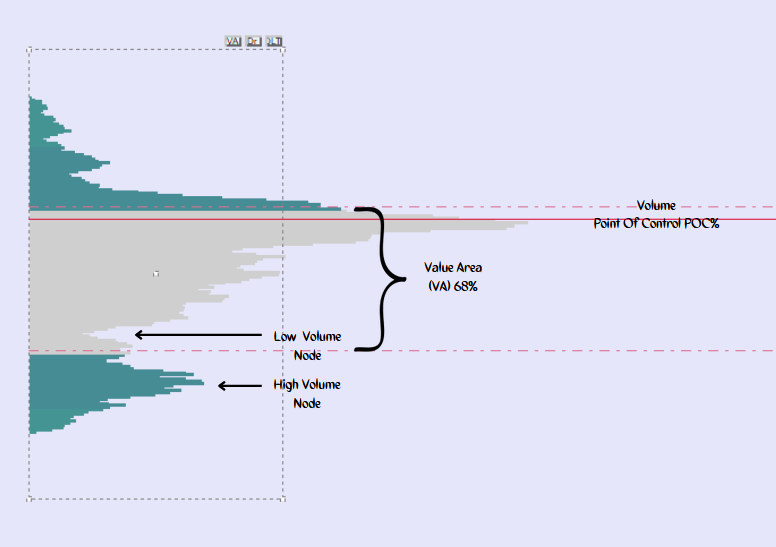
Le Profil de Volume est un outil d’analyse sophistiqué conçu pour offrir aux traders des informations approfondies sur les dynamiques du marché. Il capture les fluctuations de prix au fil du temps, fournissant une représentation graphique en temps réel des données d’enchères qui révèle les schémas comportementaux collectifs influençant les mouvements de prix.
Au cœur de cet outil se trouve la Zone de Valeur (Value Area), qui représente la plage de prix contenant 68 % de l’activité de trading de la journée. Cette zone, alignée sur l’écart-type, met en évidence les endroits où la majorité des transactions ont lieu.
Caractéristiques principales :
- Point de contrôle du volume (VPOC) : Identifie le niveau de prix équitable avec le plus haut volume échangé sur une période donnée.
- Zone de valeur haute (VAH) et Zone de valeur basse (VAL) : Définit les limites supérieure et inférieure de la zone de valeur.
- Zone de valeur en développement : Suit l’évolution de la plage de valeur en temps réel, offrant des insights sur les changements du marché.
Cet indicateur compatible avec MT4 fonctionne de manière transparente sur les barres de ticks, de minutes et de plages, avec des ajustements flexibles pour s’adapter à votre stratégie de trading. Il aide les traders à identifier avec précision les niveaux de support et de résistance en affinant la Zone de Valeur et la période de rétrospection.
De plus, l’indicateur trace en continu la Zone de Valeur et le VPOC pour les bougies du jour actuel et du jour précédent, ce qui le rend particulièrement efficace pour les cadres temporels plus courts.
Fonctionnalités améliorées et personnalisation
Pour rationaliser votre analyse, l’indicateur Profil de Volume inclut des fonctionnalités intuitives :
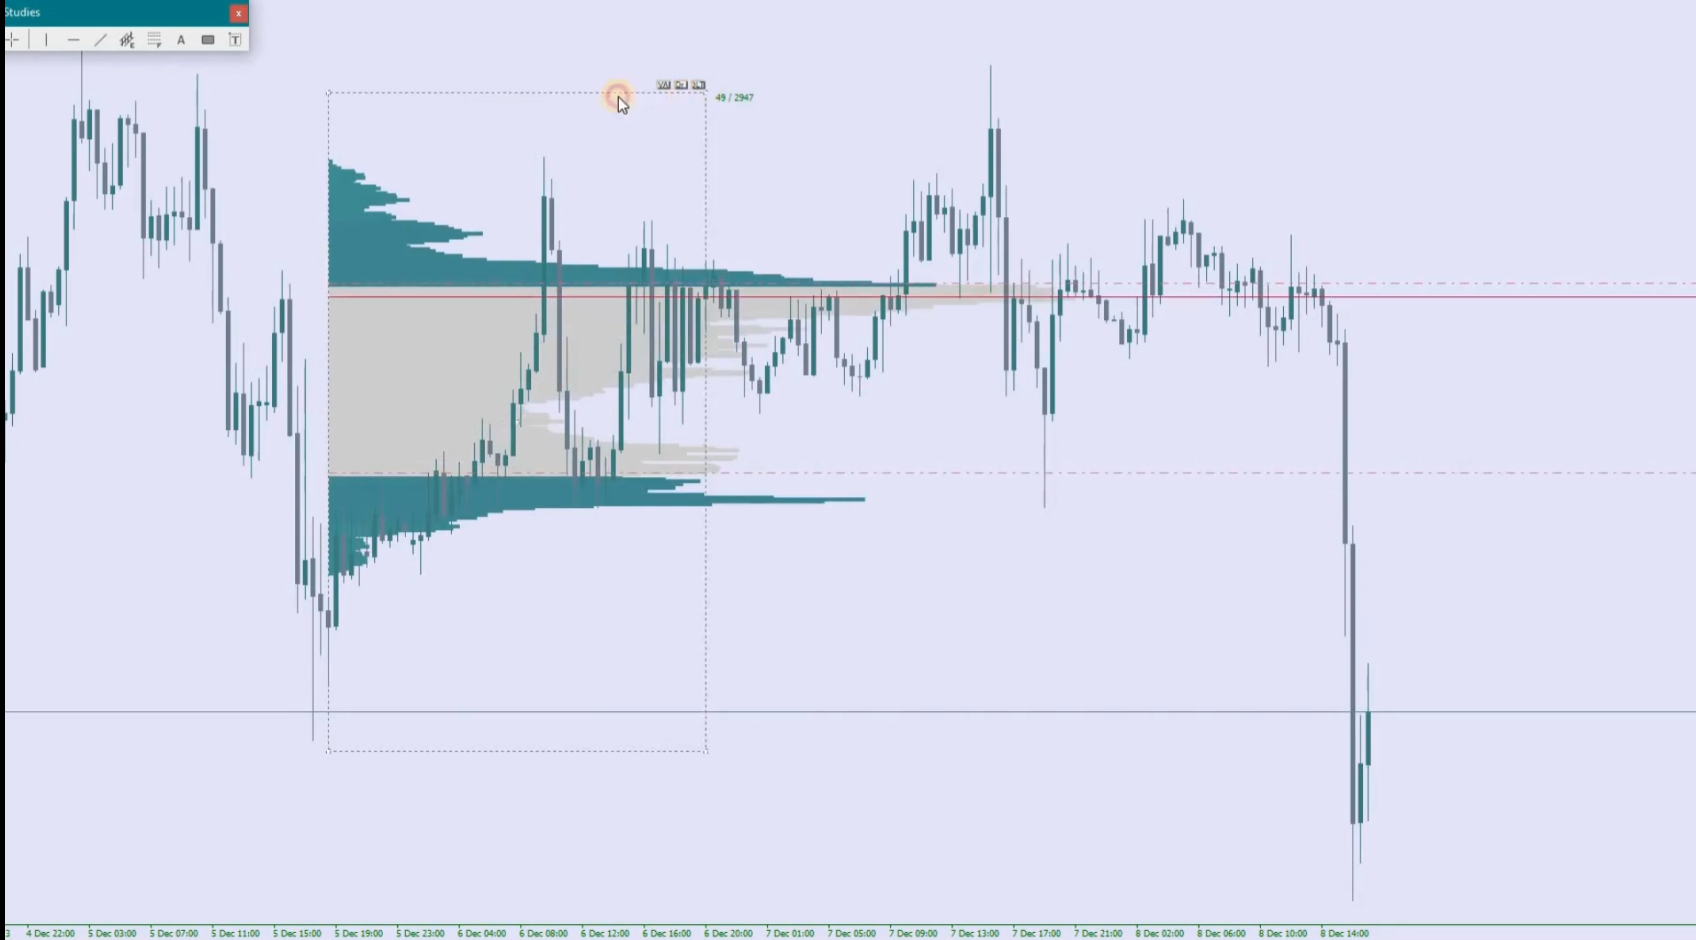
- Bascule de la Zone de Valeur (VA) : Affiche ou masque la Zone de Valeur instantanément.
- Bascule de dessin (DR) : Active ou désactive le dessin du Profil de Volume pour une vue claire du graphique.
- Suppression du profil (DLT) : Supprime rapidement le profil pour maintenir un graphique propre et focalisé.
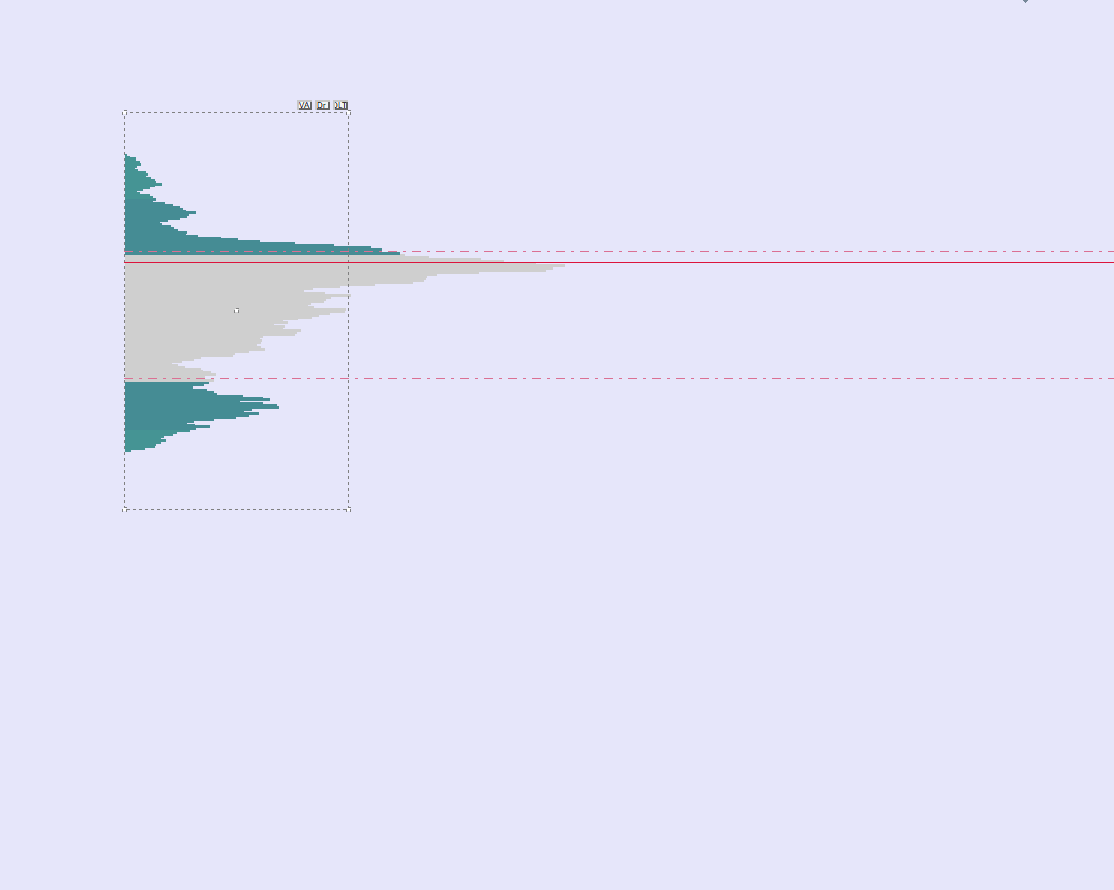
Une boîte rectangulaire déplaçable permet un positionnement précis du profil pour :
- Mesurer des zones de prix spécifiques
- Identifier les zones clés d’offre et de demande
- Repérer les niveaux critiques de support et de résistance
Cette combinaison de personnalisation, de commandes intuitives et d’outils précis garantit que chaque trader peut adapter son analyse pour une efficacité maximale.
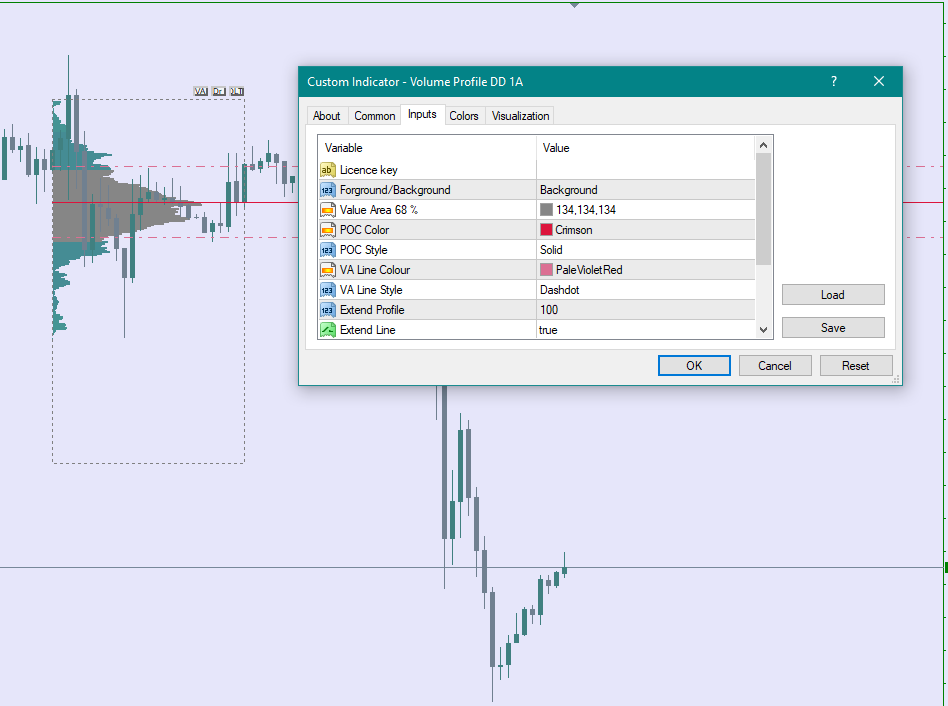
Entrées/Fonctionnalités :
✔ Affichage en avant-plan ou arrière-plan
✔ Bascule de la Zone de Valeur (VA)
✔ Point de contrôle (POC) 68 %
✔ Ligne de la Zone de Valeur
✔ POC étendu
Options de visualisation
Schémas de couleurs :
PColor Enum :
- C1 : Couleur monochrome
- C2 : Couleur en cloche de Gauss (effet dégradé)
Couleurs personnalisables pour :
- Profil principal (MainClr)
- Point de contrôle (POC) (POCClr)
- Lignes statistiques (par exemple, niveaux de 25 % et 87 %)
Affichage du profil :
Les profils peuvent être dessinés en arrière-plan (U1) ou en avant-plan (U2) via enum_bUp.
Boutons interactifs :
- Dr : Déplacer le profil
- DLT : Supprimer le profil
- VA : Basculer les lignes de la Zone de Valeur
Niveaux clés :
- POC (Point de contrôle) affiché sous forme de ligne continue.
- Lignes optionnelles de 25 % et 87 % avec styles et couleurs configurables.
- Plage de prix divisée en segments (div = 10 par défaut) pour la distribution du volume.
Commandes interactives
Raccourcis clavier :
- Q (KeyRoll) : Alterne entre les schémas de couleur monochrome et Gauss.
- W (HShowLevels) : Bascule la visibilité des niveaux horizontaux.
- A (KeyTop) : Alterne entre l’affichage en arrière-plan et en avant-plan.
- Z (KeyFix) : Bascule la fixation de l’échelle du graphique.
Événements de la souris :
- Double-clic pour commencer à dessiner une zone de profil rectangulaire.
- Glisser pour ajuster le rectangle, puis cliquer pour finaliser.
Optimisation des performances
- Utilise la mise en cache (structure ProfileData) pour stocker les données du profil et réduire la surcharge de redessin.
- Limite le temps de redessin à 500 ms (maxTime) pour éviter les retards.
- Redessine les profils uniquement lorsque nécessaire (par exemple, lors du défilement, du zoom ou d’un changement de données).
Spécifications système recommandées :
- RAM minimum : 2 Go (4 Go ou plus recommandés pour des performances plus fluides).
- Processeur : CPU multicœur (Intel i5/i7 ou AMD Ryzen 5/7 et supérieur préférés).
- Graphiques : GPU dédié (optionnel, mais recommandé pour le rendu de grands ensembles de données).
- Stockage : SSD recommandé pour un accès plus rapide aux données.
Traitement des données
- Récupère le volume des ticks, les prix hauts et bas à partir de l’échelle de temps M1 (1 minute).
- Calcule la distribution du volume sur les niveaux de prix dans la plage de temps définie.
- Prend en charge une logique de réessai (jusqu’à 3 tentatives) pour la récupération des données en cas d’échec.
🚀 Commencez dès aujourd’hui !
✔ Sécurisez votre licence maintenant et obtenez un accès complet à cet outil de trading avancé.
✔ Contactez-nous immédiatement après l’achat pour recevoir votre clé de licence, mot de passe ou détails d’activation.
✔ Besoin de l’indicateur dans votre langue préférée ? Faites-le-nous savoir, et nous le personnaliserons pour vous !
Nous sommes là pour vous accompagner à chaque étape. Contactez-nous pour toute assistance ou question !


Alles in Ordnung der Indikator funktioniert