Volume Profile DD 1A
- Indikatoren
- Version: 1.1
- Aktualisiert: 3 März 2025
- Aktivierungen: 5
WICHTIGER HINWEIS – LIZENZ UND AKTIVIERUNG ERFORDERLICH
🚨 Aktivierungsanweisungen:
Nach Abschluss Ihres Kaufs kontaktieren Sie uns bitte umgehend, um Ihren Lizenzschlüssel, Ihr Passwort oder Ihre Aktivierungsdetails zu erhalten. Ohne diese funktioniert die Software nicht. Wir sind hier, um einen reibungslosen Aktivierungsprozess zu gewährleisten und Ihnen bei Fragen zu helfen.
Mehrsprachige Anpassung 🌍
Um Ihr Handelserlebnis zu verbessern, bieten wir eine vollständige Anpassung der Software in mehreren Sprachen an. Unser Team kann Übersetzungen in folgenden Sprachen bereitstellen:
📌 Chinesisch | 📌 Französisch | 📌 Portugiesisch | 📌 Spanisch | 📌 Russisch
📌 Japanisch | 📌 Deutsch | 📌 Koreanisch | 📌 Italienisch | 📌 Türkisch
Teilen Sie uns einfach Ihre bevorzugte Sprache mit, und wir passen den Indikator an, um ein benutzerfreundliches Erlebnis zu gewährleisten.
Volumenprofil – Fortgeschrittenes Marktanalysetool
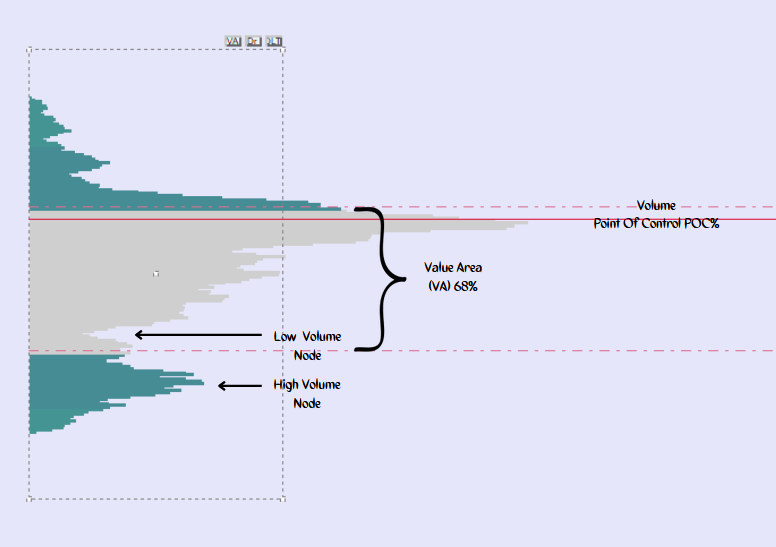
Das Volumenprofil ist ein ausgeklügeltes Analysetool, das entwickelt wurde, um Tradern tiefgehende Einblicke in die Marktdynamik zu bieten. Es erfasst Preisfluktuationen über die Zeit hinweg und bietet eine grafische Echtzeitdarstellung von Auktionsdaten, die kollektive Verhaltensmuster aufdecken, die Preisbewegungen beeinflussen.
Im Kern repräsentiert der Wertebereich (Value Area) den Preisbereich, der 68 % der Tageshandelsaktivität umfasst. Diese Zone, die mit der Standardabweichung übereinstimmt, hebt hervor, wo die Mehrheit der Trades stattfindet.
Hauptmerkmale:
- Volumen-Kontrollpunkt (VPOC): Identifiziert das faire Preisniveau mit dem höchsten gehandelten Volumen innerhalb eines bestimmten Zeitraums.
- Oberer Wertebereich (VAH) & Unterer Wertebereich (VAL): Definieren die oberen und unteren Grenzen des Wertebereichs.
- Entwickelnder Wertebereich: Verfolgt den sich entwickelnden Wertebereich in Echtzeit und bietet Einblicke in Marktverschiebungen.
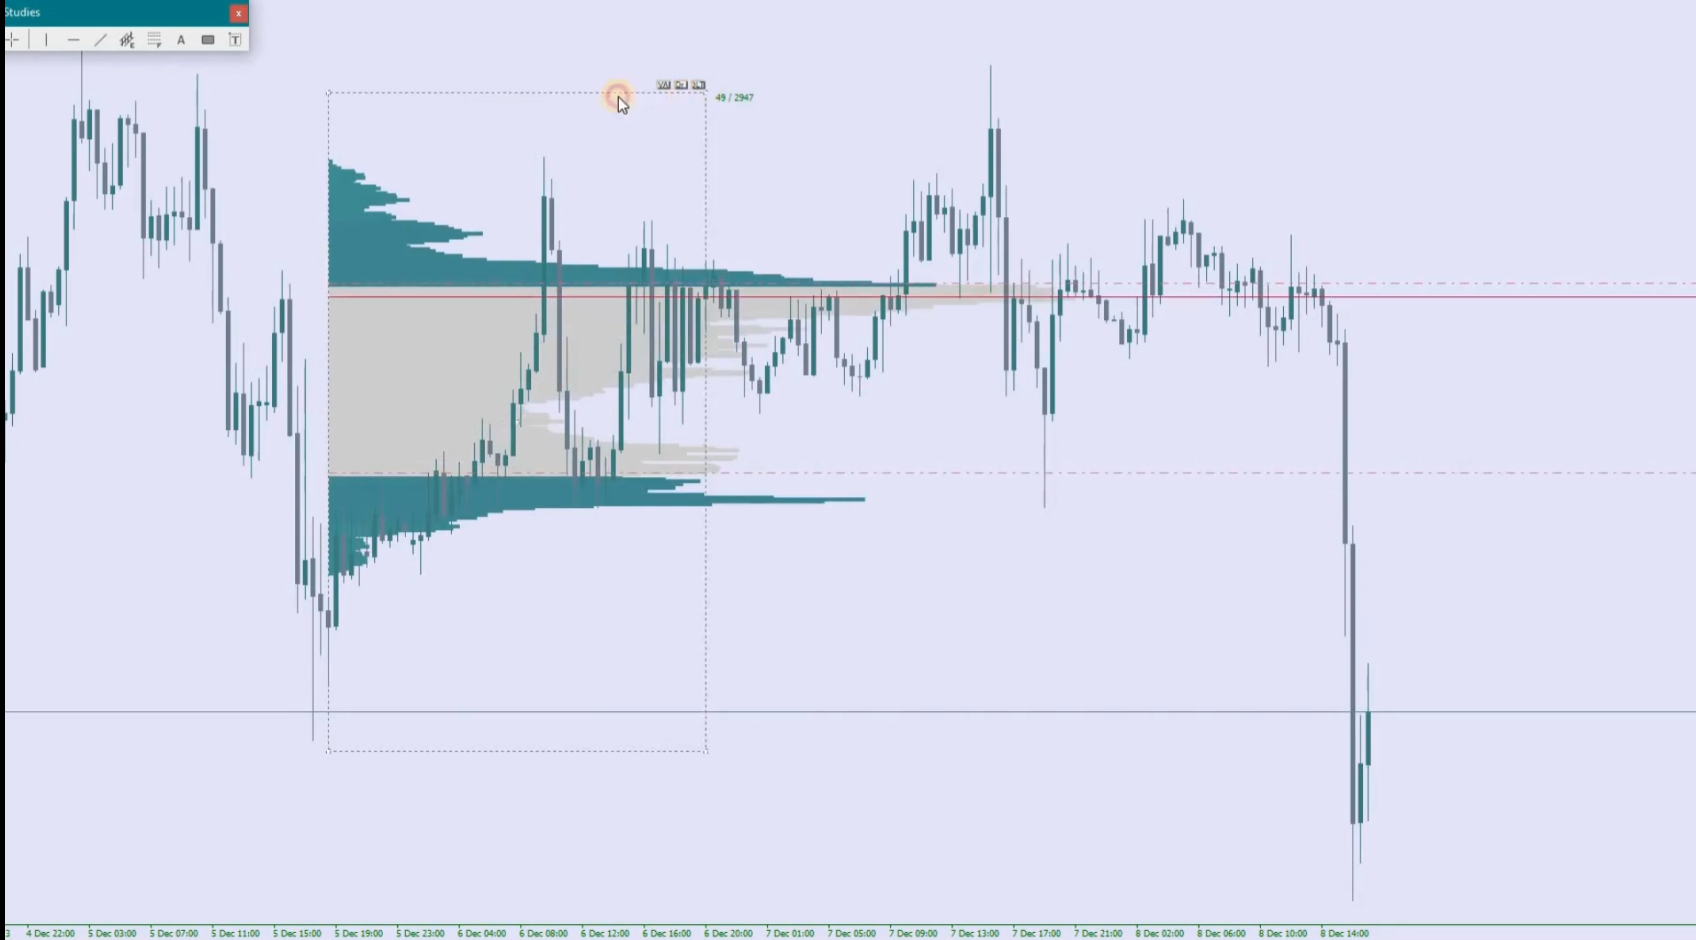
Dieser MT4-kompatible Indikator funktioniert nahtlos mit Tick-, Minuten- und Range-Balken und bietet flexible Anpassungen, die Ihrer Handelsstrategie entsprechen. Er hilft Tradern, Unterstützungs- und Widerstandsniveaus präzise zu identifizieren, indem der Wertebereich und der Rückblickzeitraum fein abgestimmt werden.
Zusätzlich plottet der Indikator kontinuierlich den Wertebereich und den VPOC sowohl für die aktuellen als auch für die Kerzen des vorherigen Tages, was ihn besonders effektiv für kleinere Zeitrahmen macht.
Erweiterte Funktionen & Anpassung
Um Ihre Analyse zu optimieren, enthält der Volumenprofil-Indikator intuitive Funktionen:
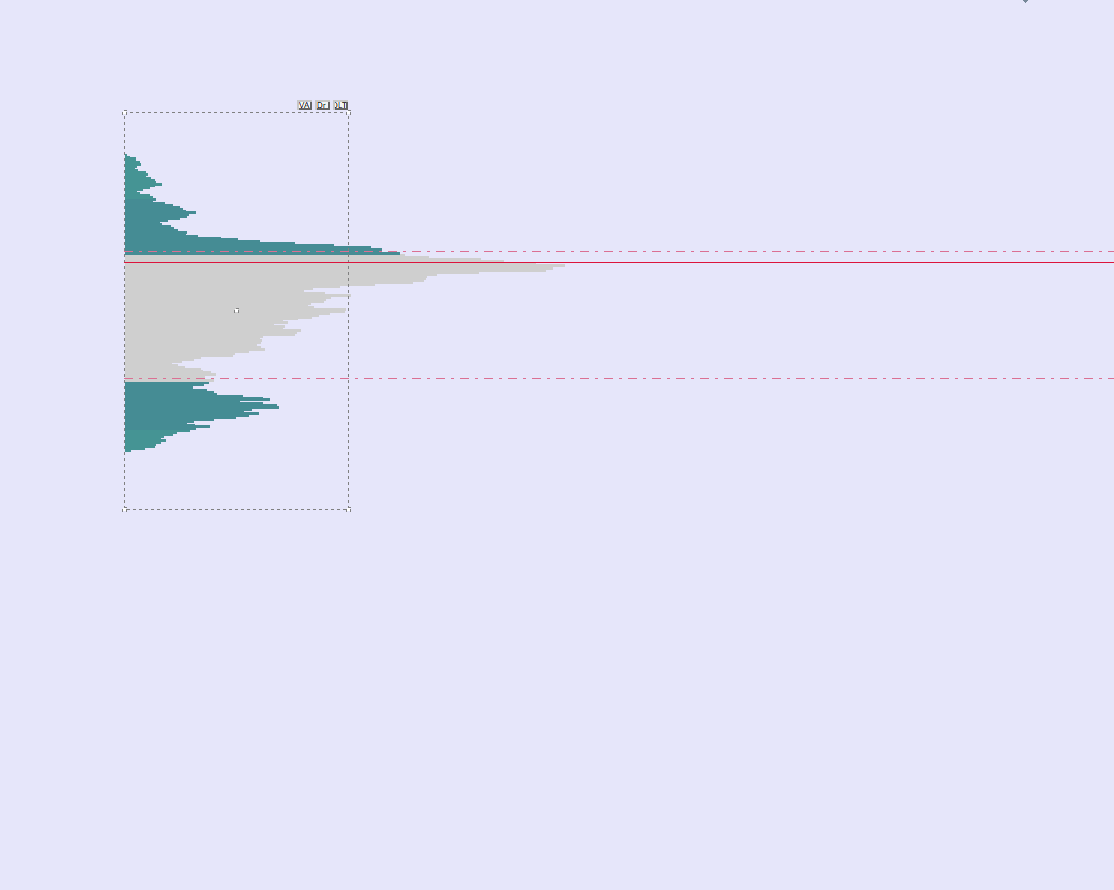
- Wertebereich-Umschalter (VA): Zeigt den Wertebereich sofort an oder blendet ihn aus.
- Zeichnungs-Umschalter (DR): Aktiviert oder deaktiviert das Zeichnen des Volumenprofils für eine klare Chartansicht.
- Profil löschen (DLT): Entfernt das Profil schnell, um ein sauberes und fokussiertes Chart zu erhalten.
Ein beweglicher rechteckiger Rahmen ermöglicht eine präzise Positionierung des Profils, um:
- Spezifische Preiszonen zu messen
- Wichtige Angebots- und Nachfragebereiche zu identifizieren
- Kritische Unterstützungs- und Widerstandsniveaus zu bestimmen
Diese Kombination aus Anpassung, intuitiven Steuerungen und präzisen Werkzeugen stellt sicher, dass jeder Trader seine Analyse für maximale Effektivität anpassen kann.
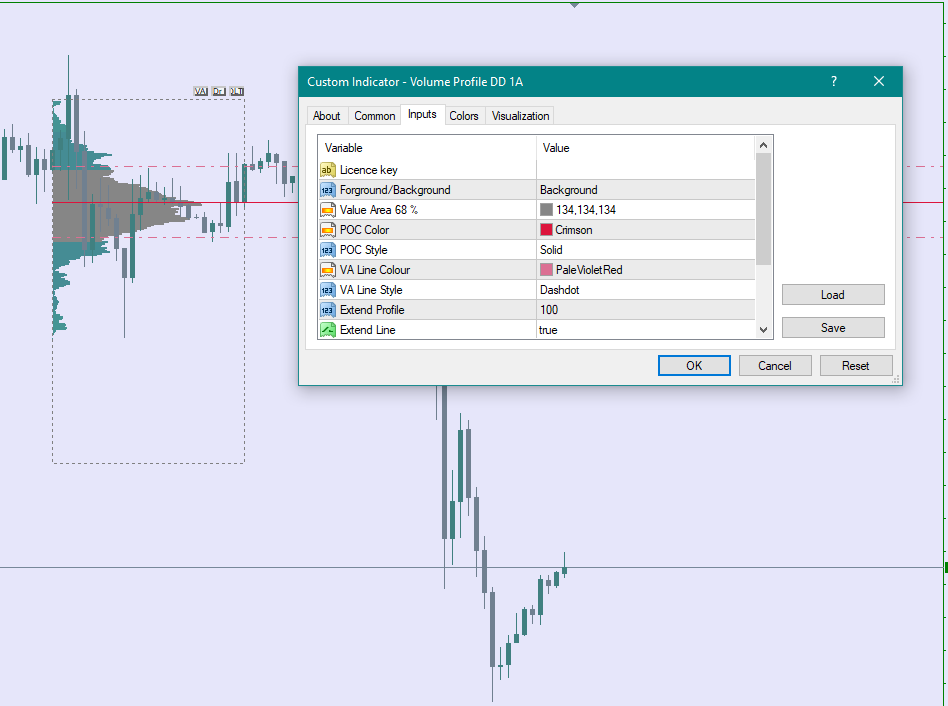
Eingaben/Funktionen:
✔ Anzeige im Vordergrund oder Hintergrund
✔ Wertebereich (VA) Umschalter
✔ Kontrollpunkt (POC) 68 %
✔ Wertebereich-Linie
✔ Erweiterter POC
Visualisierungsoptionen
Farbschemata:
PColor Enum:
- C1: Einfarbig
- C2: Gauss-Glockenfarbe (Gradienteneffekt)
Anpassbare Farben für:
- Hauptprofil (MainClr)
- Kontrollpunkt (POC) (POCClr)
- Statistische Linien (z. B. 25 %- und 87 %-Niveaus)
Profilanzeige:
Profile können über enum_bUp im Hintergrund (U1) oder Vordergrund (U2) gezeichnet werden.
Interaktive Schaltflächen:
- Dr: Profil ziehen
- DLT: Profil löschen
- VA: Wertebereich-Linien umschalten
Schlüsselebenen:
- POC (Kontrollpunkt) wird als durchgezogene Linie angezeigt.
- Optionale 25 %- und 87 %-Linien mit konfigurierbaren Stilen und Farben.
- Preisbereich wird standardmäßig in Segmente unterteilt (div = 10) für die Volumenverteilung.
Interaktive Steuerungen
Tastenkürzel:
- Q (KeyRoll): Wechselt zwischen Einfarbig- und Gauss-Farbschemata.
- W (HShowLevels): Schaltet die Sichtbarkeit horizontaler Ebenen um.
- A (KeyTop): Wechselt zwischen Hintergrund- und Vordergrundanzeige.
- Z (KeyFix): Schaltet die Fixierung der Chartskala um.
Mausereignisse:
- Doppelklick, um mit dem Zeichnen eines rechteckigen Profilbereichs zu beginnen.
- Ziehen, um das Rechteck anzupassen, dann klicken, um es zu finalisieren.
Leistungsoptimierung
- Nutzt Caching (ProfileData-Struktur), um Profildaten zu speichern und die Neuzeichnungsbelastung zu reduzieren.
- Begrenzt die Neuzeichnungszeit auf 500 ms (maxTime), um Verzögerungen zu vermeiden.
- Zeichnet Profile nur bei Bedarf neu (z. B. beim Scrollen, Zoomen oder Datenänderungen).
Empfohlene Systemanforderungen:
- Mindest-RAM: 2 GB (4 GB oder mehr empfohlen für reibungslosere Leistung).
- Prozessor: Mehrkern-CPU (Intel i5/i7 oder AMD Ryzen 5/7 und höher bevorzugt).
- Grafik: Dedizierte GPU (optional, aber empfohlen für die Darstellung großer Datensätze).
- Speicher: SSD empfohlen für schnelleren Datenzugriff.
Datenverarbeitung
- Ruft Tick-Volumen, Höchst- und Tiefstpreise aus dem M1-Zeitrahmen (1 Minute) ab.
- Berechnet die Volumenverteilung über Preisstufen innerhalb des definierten Zeitraums.
- Unterstützt Wiederholungslogik (bis zu 3 Versuche) für den Datenabruf bei möglichen Ausfällen.
🚀 Starten Sie noch heute!
✔ Sichern Sie sich jetzt Ihre Lizenz und erhalten Sie vollen Zugriff auf dieses fortschrittliche Handelstool.
✔ Kontaktieren Sie uns sofort nach dem Kauf, um Ihren Lizenzschlüssel, Ihr Passwort oder Ihre Aktivierungsdetails zu erhalten.
✔ Benötigen Sie den Indikator in Ihrer bevorzugten Sprache? Lassen Sie es uns wissen, und wir passen ihn für Sie an!
Wir sind hier, um Sie bei jedem Schritt zu unterstützen. Kontaktieren Sie uns bei Fragen oder für Unterstützung!

Alles in Ordnung der Indikator funktioniert