Market Profile Value Area Fair Price

IMPORTANT NOTICE – LICENSE & ACTIVATION REQUIRED

🚨 Activation Instructions:

Upon completing your purchase, please contact us immediately to receive your license key, password, or activation details. Without these, the software will not function. We are here to ensure a seamless activation process and assist you with any questions.

Multilingual Customization 🌍 To enhance your trading experience, we offer full customization of the software in multiple languages. Our team can provide translations in: 📌 Chinese | 📌 French | 📌 Portuguese | 📌 Spanish | 📌 Russian 📌 Japanese | 📌 German | 📌 Korean | 📌 Italian | 📌 Turkish

Simply inform us of your preferred language, and we will tailor the indicator to ensure a user-friendly experience.

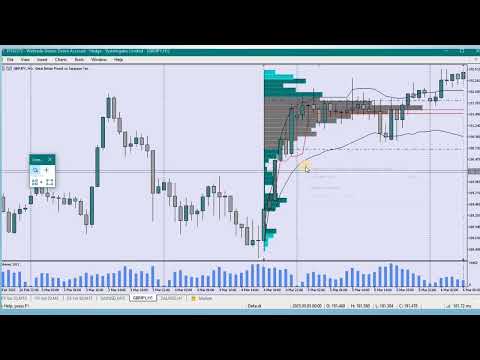
Market Profile Indicator for MT4 – Advanced Auction Market Analysis

The Market Profile is a powerful charting tool that enables traders to observe the two-way auction process that drives all market movements. It visualizes the ebb and flow of price over time, revealing critical patterns in herd behavior and price acceptance zones.

In essence, the Market Profile is a dynamic graphic that continuously records and organizes auction data, helping traders pinpoint key market levels with precision.

Key Features & Concepts

1. Value Area (VA) – Identifying True Market Balance

The Value Area represents the range of prices that contain 70% of a day's trading activity, equivalent to one standard deviation of price distribution. This zone highlights where the majority of trading occurs, providing a solid foundation for identifying market equilibrium.

2. Point of Control (POC) – The Fair Price

  • POC (Fair Price): The price level with the highest traded volume during a specific period.
  • Value Area High (VAH): The upper boundary of the Value Area.
  • Value Area Low (VAL): The lower boundary of the Value Area.

These levels act as dynamic support and resistance, offering traders actionable insights into price movements.

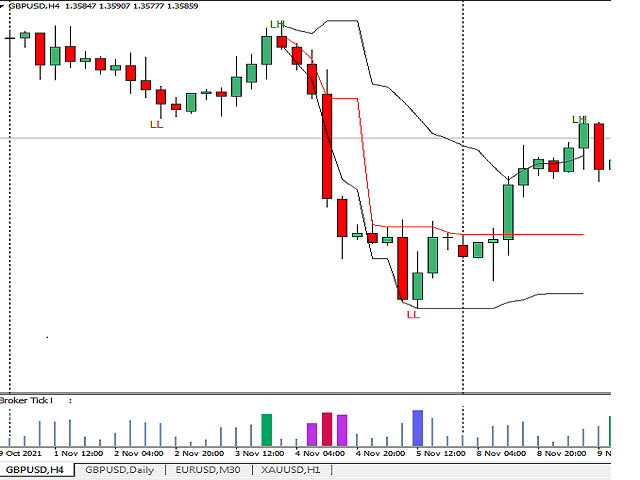
3. Developing Value Area – Real-Time Market Adjustments

The Developing Value Area (Developing VA) continuously adjusts over time, reflecting shifts in price acceptance. This is visualized through two lines tracking the Developing VAH and VAL, allowing traders to monitor price structure evolution in real time.

MT4 Indicator – Powerful Features & Customization

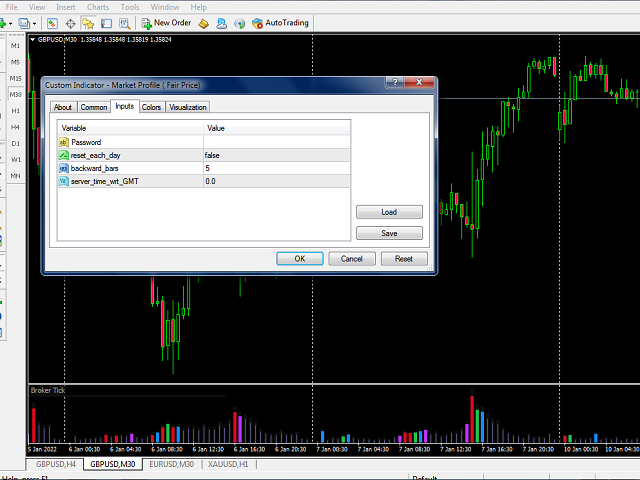
This custom-built Market Profile Indicator for MT4 is designed to work seamlessly across tick, minute, and range bars. It allows traders to: ✔ Adjust the Value Area parameters to customize analysis. ✔ Modify the look-back period (e.g., 1 candle, 2 candles, or more). ✔ Pinpoint true support and resistance levels with unmatched accuracy.

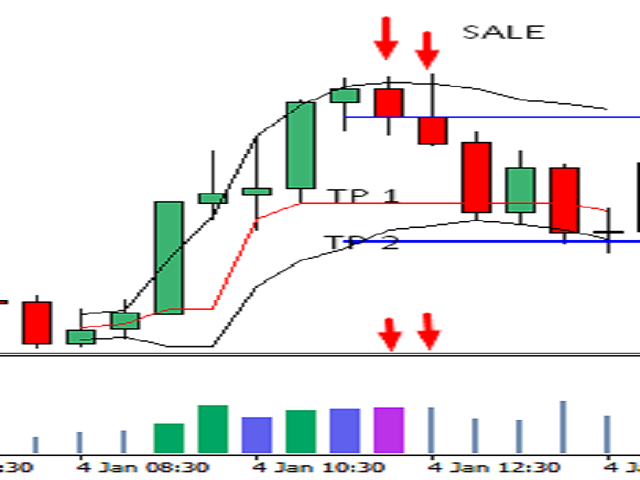
The Value Area High & Low provide the TRUE support & resistance levels, delivering a clear, structured market view.

Dynamic & Historical Profile Insights

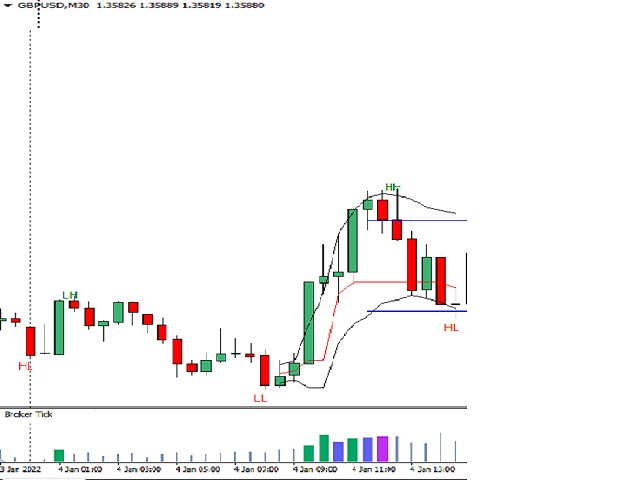
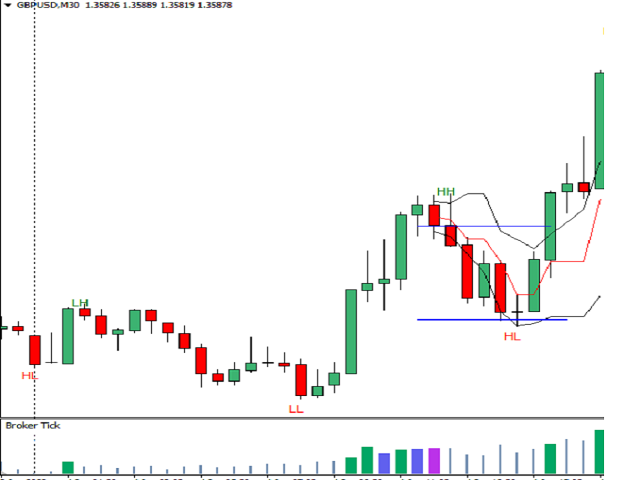
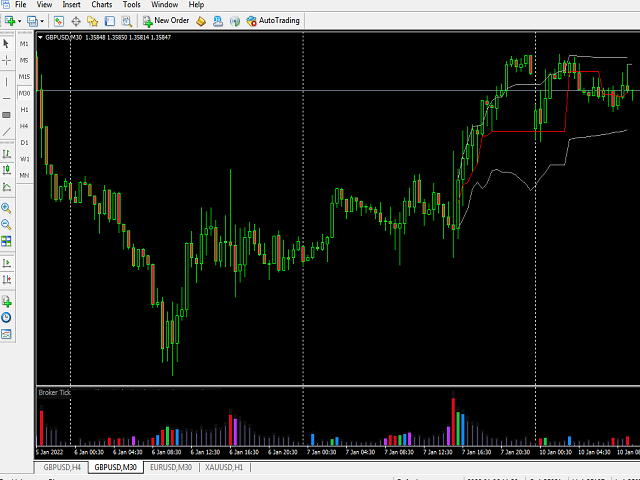
✔ Always plots the Value Area & POC for the current and previous day's candles for accurate analysis across all timeframes. ✔ View historical price bands to identify market behavior for any past session. ✔ Developing POC (Fair Price) – Tracks market sentiment in real-time:

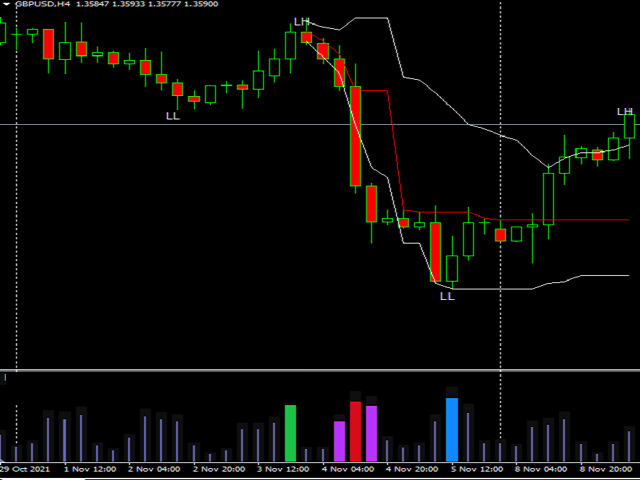
  • Lower Developing POC: Signals a downtrend (lower horizontal shelves).
  • Higher Developing POC: Signals an uptrend (higher horizontal shelves). ✔ Each session, the Developing Fair Price transitions into the new POC, creating dynamic support & resistance zones. ✔ When the POC and Developing POC align at the highest volume node (HVN), it forms a strong support level.

Enhance Your Analysis with MT4 Volume Indicator

For maximum effectiveness, we recommend pairing this indicator with the MT4 Volume Indicator to confirm high-activity price levels.


Recommended products
Description The Market Profile & Volume Profile Indicator is a powerful technical analysis tool designed to visualize market activity and price distribution over specific timeframes. Unlike standard technical indicators that focus solely on price over time, this indicator organizes price data to show where the market spent the most time (TPO) and where the most volume was traded (Volume Profile). It automatically calculates and displays key structural levels such as the Point of Control (POC) ,
Price vs Vwap
Pieter Gerhardus Van Zyl
Check out my German Pro Signal - https://www.mql5.com/en/signals/2354346 Price vs VWAP is a clean, non-repainting indicator that compares raw market price directly against a rolling Volume Weighted Average Price (VWAP) over a configurable time window. It plots two lines in a separate window: the real closing price and a dynamically calculated VWAP based on recent volume and price interaction. By adapting the VWAP lookback to the chart timeframe, it delivers a clear view of value versus executio
Volume Compair
Thiago Pereira Pinho
Professional Cumulative Delta & Volume Median Indicator Track   real buying/selling pressure   with this powerful volume analysis tool. The   Volume Compare Indicator   combines   Cumulative Delta   and   Volume Medians   to help you identify institutional activity, imbalances, and potential reversals. Key Features: Cumulative Delta Histogram   – Visualizes net buying vs. selling volume in real-time. Buy/Sell Volume Medians   – Horizontal lines showing average buy & sell volume levels. Smart Vo
BoxChart MT4
Evgeny Shevtsov
4.4 (5)
The market is unfair if only because 10% of participants manage 90% of funds. An ordinary trader has slim changes to stand against these "vultures". This problem can be solved. You just need to be among these 10%, learn to predict their intentions and move with them. Volume is the only preemptive factor that faultlessly works on any timeframe and symbol. First, the volume appears and is accumulated, and only then the price moves. The price moves from one volume to another. Areas of volume accumu
Volume Profile DD 1A
OBARE PAUL OTIENO
5 (1)
IMPORTANT NOTICE – LICENSE & ACTIVATION REQUIRED   Activation Instructions: Upon completing your purchase, please contact us immediately to receive your   license key, password, or activation details . Without these, the software will not function. We are here to ensure a seamless activation process and assist you with any questions. Multilingual Customization To enhance your trading experience, we offer full customization of the software in multiple languages. Our team can provide tra
A technical indicator that calculates its readings on trading volumes. In the form of a histogram, it shows the accumulation of the strength of the movement of the trading instrument. It has independent calculation systems for bullish and bearish directions. Works on any trading instruments and time frames. Can complement any trading system. The indicator does not redraw its values, the signals appear on the current candle. It is easy to use and does not load the chart, does not require addition
This indicator is a conventional analytical tool for tick volumes changes. It calculates tick volumes for buys and sells separately, and their delta on every bar, and displays volumes by price clusters (cells) within a specified bar (usually the latest one). The algorithm used internally is the same as in the indicator VolumeDelta , but results are shown as cumulative volume delta bars (candlesticks). Analogous indicator for MetaTrader 5 exists - VolumeDeltaBars . This is a limited substitution
MR Volume Profile 4
Sergey Khramchenkov
The "MR Volume Profile 4" indicator is a charting tool that displays trading volume at different price levels rather than time intervals. A key concept in volume profile is the point of control (POC)—the price level with the highest volume traded during the session or time range. While tools like VWAP or OBV provide volume trends, the "MR Volume Profile 4" indicator offers granular detail about where the most market activity occurs at specific price levels. This makes it a more precise tool for
Blahtech Market Profile
Blahtech Limited
4.53 (15)
Was: $249  Now: $99   Market Profile defines a number of day types that can help the trader to determine market behaviour. A key feature is the Value Area, representing the range of price action where 70% of trading took place. Understanding the Value Area can give traders valuable insight into market direction and establish the higher odds trade. It is an excellent addition to any system you may be using. Blahtech Limited presents their Market Profile indicator for the MetaTrader community. Ins
Market Profile 3
Hussien Abdeltwab Hussien Ryad
3 (2)
Market Profile 3 MetaTrader 4 indicator  — is a classic Market Profile implementation that can show the price density over time, outlining the most important price levels, value area, and control value of a given trading session. This indicator can be attached to timeframes between M1 and D1 and will show the Market Profile for daily, weekly, monthly, or even intraday sessions. Lower timeframes offer higher precision. Higher timeframes are recommended for better visibility. It is also possible t
FREE
Time Bubble ***Specialized for GBPJPY 1H time frame*** (tested for two years with success rates about 82%) Time Circle's smart algorithm detects the price circles with time . give strong signals at the right time as result of combine the price and time. our team spent months to develop this indicator specially for GBPJPY ..with high success rates about 82% win trades over two years .tested from December 2016 to November 2018. *** in last two years total signals 1012 with 829 Wins and 183 Lo
MT4 Discord Copier  - the perfect tool for those looking to remotely copy trades between multiple MT4 accounts on different computers over the internet! With the added convenience of Discord transactions monitoring, you can now easily share trades with a global group of people on your own terms, all while benefiting from the features of a Discord server . This solution is ideal for both providers and receivers, as providers can effortlessly copy trades to multiple receivers, while receivers can
Smart Predictor — Continuous Market Forecasting with Intelligent Signals SmartPredictor  offers a fresh perspective on technical analysis. This indicator combines price data smoothing with advanced forecasting elements to create a seamless, continuous "past-present-future" view. No more guessing where the price might go — you can now see the most probable scenario plotted directly on your chart. Key Innovation: Zero Visual Lag Unlike standard averaging indicators such as moving averages that a
Daily Candle Predictor is an indicator that predicts the closing price of a candle. The indicator is primarily intended for use on D1 charts. This indicator is suitable for both traditional forex trading and binary options trading. The indicator can be used as a standalone trading system, or it can act as an addition to your existing trading system. This indicator analyzes the current candle, calculating certain strength factors inside the body of the candle itself, as well as the parameters of
VolumeProfile
Robert Hess
3.8 (5)
Descption: The Volume Profile displays detailed informations of historical trading activities at certain price levels (Market Profile). So you can locate the areas with the best prices in the market and get an advantage about other market participants. Features: Customizable Volume Profile / Market Profile Shows the "fair" Value Area with 70% of all Volume Shows critical low volume zones Shows VPOC, VAL and VAH Points Works on all timeframes Also available for MT5 ( https://www.mql5.com/en/mark
The indicator builds current quotes, which can be compared with historical ones and on this basis make a price movement forecast. The indicator has a text field for quick navigation to the desired date. Options: Symbol - selection of the symbol that the indicator will display; SymbolPeriod - selection of the period from which the indicator will take data; IndicatorColor - indicator color; Inverse - true reverses quotes, false - original view; Next are the settings of the text field, in w
Simply The Best Pro
Szymon Palczynski
5 (1)
This indicator displays the histogram and arrows on chart. When Simple The Best Pro are placed on a chart, they identify the trend.  The color of may be blue or red. The blue color stands for upside moves and the red color stands for downside trends. The indicator offers to set Stop Loss (SL) and  Take Profit (TP)  setting. The default value is ATR. Indicator has automatic optimization. The STB is a unique indicator that shows the tendency (button Bars) of a particular signals. The STB tells us
VN Trade Panel II
Vyacheslav Nekipelov
4 (1)
The new version of the trading panel, which now has the ability to separately close Buy and Sell orders, display targets for all orders on the chart, as well as the ability to use the panel to trade with brokers working on the FIFO rule. Also, the new version adds option buttons for separate management of open orders. It has a convenient visualized interface and intuitive control without a lot of additional tabs to which traders have to be distracted and switch their attention. Thanks to this,
UPD1 Profile Levels
Vitaliy Kuznetsov
5 (6)
The indicator finds the levels of the maximum and minimum price volume (market profile) on the working histogram for the specified number of bars.  Composite profile . The height of the histogram is fully automatic and adapts to any instrument and timeframe. The author's algorithm is used and does not repeat well-known analogues. The height of the two histograms is approximately equal to the average height of the candle. Smart alert will help you to inform about the price concerning the volume
MarketProfile EForex
Veridiana Adorno Kendrick
Market Profile Shows where the price has spent more time, highlighting important levels that can be used in trading. It is a powerful tool which is designed to take the fundamental components which comprise every market; price/volume/time, and visually display their relationship in real-time as the market develops for a pre-determined time period. Very powerful tool!
The   Donchian Time Sync Analyzer   brings powerful   multi-timeframe   dimension to classic Donchian channel analysis, allowing traders to simultaneously monitor   trend strength   and potential   reversal signals   across five different chart periods. This advanced indicator calculates the highest highs and lowest lows across your selected timeframes, generating   clear visual signals   that help identify convergence of trend direction across multiple time horizons. By providing coordinated an
VR Grid
Vladimir Pastushak
5 (3)
The VR Grid indicator is designed to create a graphical grid with user-defined settings. Unlike the standard grid , VR Grid is used to build circular levels . Depending on the user's choice, the step between the round levels can be arbitrary. In addition, unlike other indicators and utilities, VR Grid maintains the position of the grid even when the time period changes or the terminal is rebooted. You can find settings, set files, demo versions, instructions, problem solving, at [blog] You can
FREE
GND Tail Candle
Nguyen Dang Giang
A tall upper shadow occurs when the price moves during the period, but goes back down, which is a bearish signal. A tall lower shadow forms when bears push the price down, but bulls pull it back up, which leaves a long line or shadow. This is considered a bullish signal. Some technical analysts believe a tall or long shadow means the stock will turn or reverse. Some believe a short or lower shadow means a price rise is coming. In other words, a tall upper shadow means a downturn is coming, while
Скрипт собирает размеры всех ценовых волн на текущем графике, которые не меньше заданной величины, и сохраняет их в CSV файл. Каждая строка таблицы будет содержать дату/время окончания волны и ее размер. Если вам нужно знать размеры волн в реальном времени, то воспользуйтесь индикатором Wave Size into ZigZag , Wave Size Histogram  или ZZ Histogram . ПАРАМЕТРЫ MinWaveSize:  минимальный размер дял волн, которые попадут в статистику PositiveValues:   true  - в файл сохраняется только размер волны
UR Gamma
Krzysztof Jan Debski
UR Gamma (powered by similar calculations found in Machine Learning systems) UR Gamma is a cutting-edge financial analysis tool that offers a new and improved take on the classic WaveTrend indicator. By incorporating advanced Digital Signal Processing techniques, UR Gamma addresses some of the limitations of traditional WaveTrend algorithms and provides a more accurate, robust and dynamic approach to identifying and measuring trends in price action. Advantages of using UR Gamma: Minimalistic
The SMC Venom Model BPR indicator is a professional tool for traders working within the Smart Money (SMC) concept. It automatically identifies two key patterns on the price chart: FVG (Fair Value Gap) is a combination of three candles, in which there is a gap between the first and third candles. It forms a zone between levels where there is no volume support, which often leads to a price correction. BPR (Balanced Price Range) is a combination of two FVG patterns that form a “bridge” - a zone of
Blahtech Supply Demand
Blahtech Limited
4.58 (36)
Was: $299  Now: $99   Supply Demand uses previous price action to identify potential imbalances between buyers and sellers. The key is to identify the better odds zones, not just the untouched ones. Blahtech Supply Demand indicator delivers functionality previously unavailable on any trading platform. This 4-in-1 indicator not only highlights the higher probability zones using a multi-criteria strength engine, but also combines it with multi-timeframe trend analysis, previously confirmed swings
The Best One Scalping Trade Panel functional manual trade panel with risk reward, auto SL by candle ( original solution), lot size calculation, one-click trading, scale in and out of trades (partial close),  Works with all symbols not just currency pairs, perfect works on DAX, NASDAQ, GOLD, ...... I earn every day during live stream on ZakopiecFX - join Me Risk by lot Risk by percent SL by points SL by Candle, Renko, RangeBar ( original solution) TP by point TP by Risk/Reward Auto Trailing by P
Auto Fibo Pro m
DMITRII GRIDASOV
"Auto FIBO Pro"   Crypto_Forex  indicator  - is great auxiliary tool in trading! Indicator automatically calculate and place on chart Fibo levels and local trend lines (red color). Fibonacci levels indicate key areas where price can reverse. Most important levels are 23.6%, 38.2%, 50% and 61.8%. You can use it   for reversal scalping  or for zone grid trading. There are plenty of opportunities to  improve your current system using Auto FIBO Pro indicator as well. It has Info Spread Swap Displa
This panel is a part of the SupDem-Pro trading system and is used to search for the best opportunities for any available instruments. Which can be selected manually in the Market Watch (open it with CTRL + M). Using this trading panel in combination with ShvedSupDem-Pro_Zone allows to analyze multiple currency pairs with a single click. The panel allows to load any instruments from the Market Watch, from 6 major currency pairs up to all instruments (480). The indicator parameters Button Width -
Buyers of this product also purchase
Gann Made Easy
Oleg Rodin
4.83 (159)
Gann Made Easy is a professional and easy to use Forex trading system which is based on the best principles of trading using the theory of W.D. Gann. The indicator provides accurate BUY and SELL signals including Stop Loss and Take Profit levels. You can trade even on the go using PUSH notifications. PLEASE CONTACT ME AFTER PURCHASE TO GET TRADING  INSTRUCTIONS AND GREAT EXTRA INDICATORS   FOR FREE! Probably you already heard about the Gann trading methods before. Usually the Gann theory is a ve
Market Makers
Mohamed Hassan
5 (3)
After purchase, contact me privately to receive 1 month of free testing with EA Forex Proton! This advanced MT4 trading robot automatically executes signals from any MT4 indicator, including Market Makers. The latest version also includes AI integration, allowing each trade signal to be analyzed using Artificial Intelligence. Live Signal with EA Forex Proton: Click here Market Makers is a powerful price action trading system designed to identify high-probability Buy and Sell opportunities based
Advanced Supply Demand
Bernhard Schweigert
4.91 (299)
Trading Special – 40% OFF Best Solution for any Newbie or Expert Trader! This indicator is a unique, high quality and affordable trading tool because we have incorporated a number of proprietary features and a new formula. With this update, you will be able to show double timeframe zones. You will not only be able to show a higher TF but to show both, the chart TF, PLUS the higher TF: SHOWING NESTED ZONES. All Supply Demand traders will love it. :) Important Information Revealed Maximize the pot
Scalper Inside PRO
Alexey Minkov
4.74 (69)
12% OFF EASTER SALE An exclusive indicator that utilizes an innovative algorithm to swiftly and accurately determine the market trend. The indicator automatically calculates opening, closing, and profit levels, providing detailed trading statistics. With these features, you can choose the most appropriate trading instrument for the current market conditions. Additionally, you can easily integrate your own arrow indicators into Scalper Inside Pro to quickly evaluate their statistics and profitabi
Volatility Trend System - a trading system that gives signals for entries. The volatility system gives linear and point signals in the direction of the trend, as well as signals to exit it, without redrawing and delays. The trend indicator monitors the direction of the medium-term trend, shows the direction and its change. The signal indicator is based on changes in volatility and shows market entries. The indicator is equipped with several types of alerts. Can be applied to various trading ins
Atomic Analyst
Issam Kassas
5 (4)
First of all Its worth emphasizing here that this Trading Indicator is   Non-Repainting , Non Redrawing and Non Lagging Indicator   Indicator, Which makes it ideal from both manual and robot trading.  User manual: settings, inputs and strategy . The Atomic Analyst  is a PA Price Action Indicator that uses Strength and Momentum of the price to find a better edge in the market. Equipped with Advanced filters which help remove noises and false signals, and Increase Trading Potential. Using Multiple
M1 Sniper
Oleg Rodin
5 (20)
M1 SNIPER is an easy to use trading indicator system. It is an arrow indicator which is designed for M1 time frame. The indicator can be used as a standalone system for scalping on M1 time frame and it can be used as a part of your existing trading system. Though this trading system was designed specifically for trading on M1, it still can be used with other time frames too. Originally I designed this method for trading XAUUSD and BTCUSD. But I find this method helpful in trading other markets a
Trend Screener
STE S.S.COMPANY
4.79 (95)
Trend Screener Indicator --Professional Trend Trading & Market Scanning System for MetaTrader Unlock the true power of trend trading with Trend Screener Indicator — a complete multi-currency, multi-timeframe trend analysis solution   powered by Fuzzy Logic,Trend Pulse Technology  and advanced market structure algorithms.   Trend Screener transforms your MetaTrader platform into a professional-grade Trend Analyzer and Market Scanner, helping you identify high-probability trend opportunities, ear
The " Dynamic Scalper System " indicator is designed for the scalping method of trading within trend waves. Tested on major currency pairs and gold, compatibility with other trading instruments is possible. Provides signals for short-term opening of positions along the trend with additional price movement support. The principle of the indicator. Large arrows determine the trend direction. An algorithm for generating signals for scalping in the form of small arrows operates within trend waves.
PRO Renko System
Oleg Rodin
5 (30)
PRO Renko System is a highly accurate trading system specially designed for trading RENKO charts. The ARROWS and Trend Indicators DO NOT REPAINT! The system effectively neutralizes so called market noise giving you access to accurate reversal signals. The indicator is very easy to use and has only one parameter responsible for signal generation. You can easily adapt the tool to any trading instrument of your choice and the size of the renko bar. I am always ready to provide extra support to help
Scalper Vault
Oleg Rodin
5 (36)
Scalper Vault is a professional scalping system which provides you with everything you need for successful scalping. This indicator is a complete trading system which can be used by forex and binary options traders. The recommended time frame is M5. The system provides you with accurate arrow signals in the direction of the trend. It also provides you with top and bottom signals and Gann market levels. The indicator provides all types of alerts including PUSH notifications. PLEASE CONTACT ME AFT
Quantum Breakout Indicator PRO
Bogdan Ion Puscasu
4.96 (26)
Introducing   Quantum Breakout PRO , the groundbreaking MQL5 Indicator that's transforming the way you trade Breakout Zones! Developed by a team of experienced traders with trading experience of over 13 years, Quantum Breakout PRO is designed to propel your trading journey to new heights with its innovative and dynamic breakout zone strategy. Quantum Breakout Indicator will give you signal arrows on breakout zones with 5 profit target zones and stop loss suggestion based on the breakout box. I
Trend indicator AI
Ramil Minniakhmetov
4.53 (83)
Trend Ai indicator is great tool that will enhance a trader’s market analysis by combining trend identification with actionable entry points and reversal alerts.  This indicator empowers users to navigate the complexities of the forex market with confidence and precision Beyond the primary signals, Trend Ai indicator identifies secondary entry points that arise during pullbacks or retracements, enabling traders to capitalize on price corrections within the established trend. Important Advantage
Currency Strength Exotics
Bernhard Schweigert
4.88 (33)
CURRENTLY 20% OFF ! Best Solution for any Newbie or Expert Trader! This Indicator is specialized to show currency strength for any symbols like Exotic Pairs Commodities, Indexes or Futures. Is first of its kind, any symbol can be added to the 9th line to show true currency strength of Gold, Silver, Oil, DAX, US30, MXN, TRY, CNH etc. This is a unique, high quality and affordable trading tool because we have incorporated a number of proprietary features and a new formula. Imagine how your trading
Route Lines Prices is an indicator designed for finding price directions. Its simple interface contains multiple algorithms for price behavior and future direction calculations. These algorithms include volatility calculations and price smoothing based on the timeframes used. The indicator has a single parameter for changing the " Calculating Price Values " value. The default value of 1 provides a balanced automatic calculation, which can be used without manually configuring the indicator. By m
Trend Lines PRO
Roman Podpora
5 (1)
TREND LINES PRO    helps understand where the market is truly changing direction. The indicator shows real trend reversals and points where major players re-enter. You see   BOS lines   Trend changes and key levels on higher timeframes — without complex settings or unnecessary noise. Signals don't repaint and remain on the chart after the bar closes. VERSION MT 5     -     Reveals its maximum potential when paired with the   RFI LEVELS PRO  indicator What the indicator shows: Real shifts   tren
Trading Special – 40% OFF Best Solution for any Newbie or Expert Trader! This dashboard software is working on 28 currency pairs plus one. It is based on 2 of our main indicators (Advanced Currency Strength 28 and Advanced Currency Impulse). It gives a great overview of the entire Forex market plus Gold or 1 indices. It shows Advanced Currency Strength values, currency speed of movement and signals for 28 Forex pairs in all (9) timeframes. Imagine how your trading will improve when you can watch
Currency Strength Wizard is a very powerful indicator that provides you with all-in-one solution for successful trading. The indicator calculates the power of this or that forex pair using the data of all currencies on multiple time frames. This data is represented in a form of easy to use currency index and currency power lines which you can use to see the power of this or that currency. All you need is attach the indicator to the chart you want to trade and the indicator will show you real str
CRT Multi-Timeframe Market Structure & Liquidity Sweep Indicator Non-Repainting | Multi-Asset | MT5 Version Available MT5 Version:   https://www.mql5.com/en/market/product/162075 Full User Guide — explains what each feature does and why:   https://www.mql5.com/en/blogs/post/767525 Quick Start User Guide  — explains how to configure and in what order:  https://www.mql5.com/en/blogs/post/767540 Indicator Overview CRT Ghost Candle HTF Fractal is a complete institutional-grade market structure too
Auto Optimized Parabolic RSI: Advanced 3D Momentum Engine Most retail indicators fail because they rely on static inputs that break the moment market volatility shifts. Auto Optimized Parabolic RSI solves the problem of "indicator decay" by continuously recalculating its own mathematical edge, bringing institutional-grade quantitative adaptation directly to your MT5 terminal. The Core Advantage: Custom In-Memory 3D Optimization   Standard auto-optimizers often freeze the MT5 platform because the
Reversal Master
Alexey Minkov
4.8 (15)
12% OFF EASTER SALE The Reversal Master is an indicator for determining the current direction of price movement and reversal points. The indicator will be useful for those who want to see the current market situation better. The indicator can be used as an add-on for ready-made trading systems, or as an independent tool, or to develop your own trading systems. The Reversal Master indicator, to determine the reversal points,  analyzes a lot of conditions since the combined analysis gives a more a
Auto Optimized MFI
Davit Beridze
5 (1)
Auto Optimized MFI is a dynamic, self-tuning indicator that adapts to your market and timeframe by running real trade simulations on historical data. Unlike traditional indicators that rely on fixed 80/20 MFI thresholds, this tool adjusts to actual price and volume behavior to identify more effective Buy and Sell zones. How it works The indicator analyzes historical candles across a customizable range and simulates trades based on MFI signals. It records metrics like win rate, drawdown, and TP/S
New Update of Smart Trend Trading System MT5 For  2026 Market: If You Buy this Indicator you will Get my Professional   Trade Manager + EA  for   FREE . First of all Its worth emphasizing here that this Trading System is   Non-Repainting   , Non Redrawing and Non Lagging Indicator   Which makes it ideal from both manual and robot trading .  [Online course] ,   [manual]   and   [download presets] . The Smart Trend Trading System MT5 is a comprehensive trading solution tailored for   new   and   e
Dynamic Forex28 Navigator
Bernhard Schweigert
4.43 (7)
Specials Discount now. The Next Generation Forex Trading Tool. Dynamic Forex28 Navigator is the evolution of our long-time, popular indicators, combining the power of three into one: Advanced Currency Strength28 Indicator (695 reviews) + Advanced Currency IMPULSE with ALERT (520 reviews) + CS28 Combo Signals (recent Bonus) Details about the indicator  https://www.mql5.com/en/blogs/post/758844 What Does The Next-Generation Strength Indicator Offer? Everything you loved about the originals, now
RFI levels PRO
Roman Podpora
5 (1)
The indicator accurately shows the reversal points and price return zones where the   Major players . You see where new trends are forming and make decisions with maximum precision, maintaining control over every trade. VERSION MT5     -     Reveals its maximum potential when combined with the   TREND LINES PRO   indicator What the indicator shows: Reversal structures and reversal levels with activation at the beginning of a new trend. Display of   TAKE PROFIT   and   STOP LOSS   levels with mi
GOLD Impulse with Alert
Bernhard Schweigert
4.67 (12)
This indicator is a super combination of our 2 products  Advanced Currency IMPULSE with ALERT  and  Currency Strength Exotics . It works for all time frames and shows graphically impulse of strength or weakness for the 8 main currencies plus one Symbol! This Indicator is specialized to show currency strength acceleration for any symbols like Gold, Exotic Pairs, Commodities, Indexes or Futures. Is first of its kind, any symbol can be added to the 9th line to show  true currency strength accelerat
Currency Strength Matrix
Raymond Gilmour
4.5 (26)
THE ONLY CURRENCY STRENGTH INDICATOR THAT IS BASED ON PRICE ACTION. DESIGNED FOR TREND, MOMENTUM & REVERSAL TRADERS This indicator  reads price action to confirm trend and strength . Advanced multi-currency and multi-time frame indicator that shows you simply by looking at one chart, every currency pair that is trending and the strongest and weakest currencies driving those trends. For full details on how to use this indicator, and also how to get a FREE chart tool, please see user manual HERE
Wave Cycle Counter
Eric Evert Ouweneel
Wave and Cycle counter to give an immediate indication how far the ongoing trend has progressed. Low numbers: trend has just started, ride the trend. Higher numbers: trend is 'older', watch for reversals This indicator is 100% compatible with the fantastic TopDog trading strategy. (I will NOT give any details about this Top Dog strategy) The trend direction is determined by a SMA value (or any other MA) you can set. Waves and cycles numbers and letters are derived from a SlowStoch setting. Wave
KT Gaussian Trend Filter MT4
KEENBASE SOFTWARE SOLUTIONS
The KT Gaussian Trend Filter combines Gaussian filtering with linear regression smoothing to deliver clear and accurate trend analysis. It generates easy-to-follow buy and sell signals while effectively highlighting the market's long-term direction. Features Fully Customizable Gaussian Filter: Adjust length and pole settings to fine-tune smoothing precision and enhance trend clarity. Linear Regression Enhancement: Further refines the Gaussian smoothing, minimizing false signals caused by market
Binary Volume Edge – Martingale Stats  Indicator for binary options with live pre-signals and full martingale stats Binary Volume Edge – Martingale Stats is a professional tool that combines powerful signal filtering, smart martingale analysis, and a unique early warning system. No magic – just clear rules and verifiable stats. What do you get? 1. Signals you can trust Absolute absence of redrawing – arrows appear only on closed candles and never change again. Preliminary signals on t
More from author
Volume Profile DD 1A
OBARE PAUL OTIENO
5 (1)
IMPORTANT NOTICE – LICENSE & ACTIVATION REQUIRED   Activation Instructions: Upon completing your purchase, please contact us immediately to receive your   license key, password, or activation details . Without these, the software will not function. We are here to ensure a seamless activation process and assist you with any questions. Multilingual Customization To enhance your trading experience, we offer full customization of the software in multiple languages. Our team can provide tra
IMPORTANT NOTICE – LICENSE & ACTIVATION REQUIRED Activation Instructions: Upon completing your purchase, please contact us immediately to receive your license key, password, or activation details. Without these, the software will not function. We are here to ensure a seamless activation process and assist you with any questions. Multilingual Customization To enhance your trading experience, we offer full customization of the software in multiple languages. Our team can provide translation
Filter:
No reviews
Reply to review