Watch the Market tutorial videos on YouTube
How to buy а trading robot or an indicator
Run your EA on
virtual hosting
virtual hosting
Test аn indicator/trading robot before buying
Want to earn in the Market?
How to present a product for a sell-through
Expert Advisors and Indicators for MetaTrader 5 - 61

The Trading Sessions indicator is a simple tool that helps to highlight a specific trading session. For example, it can be used to differentiate the European, American or Asian sessions.
Main features The indicator shows a user-defined trading session. Alert notifications for the start and end of the session. Custom session time. Works on every timeframe (M1, M5, M15, M30, H1, H4, D1, W1, MN). Customizable parameters (Colors, alerts...). It can be used for creating EA. Available for MT4 an
FREE
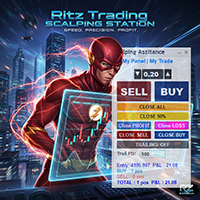
RITZ SCALPING TRADING STATION
adalah sistem panel eksekusi trading ultra-cepat yang dirancang untuk trader scalping, intraday, dan day-trading profesional. Menggabungkan kecepatan level-institusi, manajemen risiko cerdas, serta workflow yang ringkas—menjadikannya alat lengkap untuk mengambil keputusan cepat dengan kontrol penuh.
Visi Utama Produk Membawa kecepatan eksekusi kelas institusi & manajemen risiko otomatis ke level retail dalam sebuah panel yang ringkas, intuitif, dan siap tempur. Ko
FREE

Free indicator to quickly detect trendline breakouts and high or low of a price range. It displays lines based on the highs and lows of prices, and also finds and displays inclined trend lines. As soon as the price goes beyond the line and the candlestick closes, the indicator signals this with an arrow (you can also enable an alert). This indicator is easy to use and also free. The number of candles for defining trend lines as well as the high and low of the trading range is configurable. It w
FREE

The Exponential Moving Averages (Double or Triple) Envelopes Indicator is a technical analysis tool designed to assist you in identifying trends and potential reversal points in the financial market. This indicator offers traders the flexibility to choose between two types of exponential moving averages: the Double Exponential Moving Average (DEMA) or the Triple Exponential Moving Average (TEMA).
Key Features:
Double or Triple Exponential: Switch between DEMA and TEMA based on your analysis pre
FREE

The SMTrendLine indicator is based on the principles of graphical construction of Bollinger bands.
Graphically, the Bollinger is two lines that limit the price dynamics from above and from below, respectively. These are a kind of support and resistance lines, which most of the time are located at levels far from the price.
As we know, the Bollinger bands are similar to the envelopes of moving averages. The difference between them is that the envelope boundaries are located above and below the
FREE

An indicator for visualizing time ranges of key trading sessions: Asian, European, and American. The indicator features functionality for setting the start and end times of each trading session, as well as an adjustable timezone of the trading server. The main advantages of the indicator include the ability to operate with minimal CPU load and memory usage. Moreover, it offers the option to specify the number of displayed historical days, providing the user with flexible market dynamics analysis
FREE

Swiss CandleTime What ist CandleTime for This indicaor just displays the remaining time for a candle to build. It is best used if you trade with timframes from 3 minutes. I use it in M3 to keep postions. If I have two following red candles i usually liquidate the position. Timeframes M1 to H1 Inputs Arrow displayed => Edit your arrow string Arrow for waiting conditions => Arrow if chart is offline Text Color => color of the text Tell if there is a trend change => tells you, if the two preciding
FREE

The indicator looks for the "Fifth dimension" trade signals and marks them on the chart. A detailed description of the chart patterns that generate the trade signals can be found in Chapter 8 "The Balance Line Trades" in the book Williams' "New Trading Dimensions". Signal levels with indication of the position entry or stop loss placement price are indicated directly on the chart. This feature creates additional convenience for the trader when placing pending orders. A solid horizontal line is d
FREE
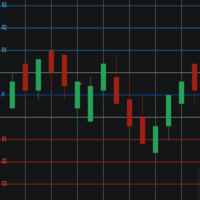
Pivot Points Levels Description The Pivot Points Levels indicator is an advanced and comprehensive tool for technical analysis based on support and resistance levels calculated from pivot points. This free indicator combines 6 different calculation methods with support for multiple timeframes, offering a robust solution for identifying key price reversal and continuation areas. Key Features 6 Calculation Methods : Traditional, Fibonacci, Woodie, Classic, DeMark (DM), and Camarilla Multi-Timefram
FREE
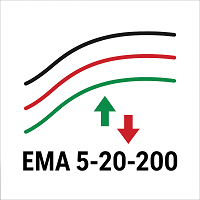
Description (English) EMA 5-20-200 Cross Alerts (Fixed Alerts, No Repaint) This indicator combines three popular EMAs (5, 20, and 200) to help traders identify short-term, mid-term, and long-term trends.
With visual arrows on the chart and automatic alerts (popup & push notification) , it allows traders to catch entries and trend confirmations without constantly monitoring the screen. Key Features: Plots EMA 5, EMA 20, and EMA 200 directly on the chart. Generates Buy/Sell signals (EMA5 vs
FREE
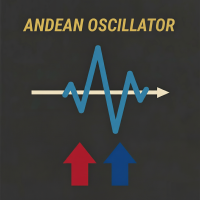
Andean Oscillator – Trend Variation Indicator Visualize market strength and direction with clarity and precision. The Andean Oscillator is an advanced oscillator that measures bullish and bearish variations of any asset through its main components: Bull , Bear , and a Signal Line that filters false signals and confirms trends. Using exponential envelopes and moving averages, the Andean Oscillator provides a clear and stable view of trend strength and potential changes, helping you trade with an
FREE

Bitcoin Ultra Power is an advanced algorithmic Expert Advisor designed for professional BTCUSD trading on the M5 timeframe. The system applies adaptive market analytics with strict institutional risk control to achieve stable performance in the highly volatile cryptocurrency market. The EA includes a dual-mode architecture that automatically adjusts between Bitcoin and Forex instruments for maximum versatility. Key Features Multi-Asset Compatibility Fully automated execution with risk-focused m

This is an OLD indicator which was rather efficient to be paired with MA Cross, Bollinger Bands, Dochian Channel and many other strategies and this provides you with market change of BEAR and BULL trends. Since there isn't much listed in MT5 Market, I would like to share my very own indicator for your usage. Please feel free to comment or criticize for better and improvement of the indicator listed.
FREE

This indicator calculates trend via two different moving averages and draw zigzag trend lines. You can change fast and slow Moving Averages settings for customization. Inputs:
Fast MA Time Period : 64 Fast MA Shift: 0 Fast MA Method: Smoothed Fast MA Apply To: Median Price Slow MA Time Period: 32 Slow MA Shift: 0 Slow MA Method: Smoothed Slow MA Apply To: Median Price ZigZag Color: Red ZigZag Type: DashDot ZigZag Width: VeryThin
FREE

RSI AutoTrader Pro – Smart Multi-Symbol ATR Engine Introduction RSI AutoTrader Pro is not another simple RSI bot — it’s a complete, intelligent trading system built for multi-symbol automation and dynamic risk control .
Attach it to any chart , and it automatically scans every symbol in your Market Watch , identifies RSI signals, manages trades with ATR-based stop levels , and optimizes each position size according to your selected risk percentage . It’s more than an indicator
FREE

This indicator is a straight port of a well known MetaTrader 4 indicator that is freely available on the Internet. It does not redraw at all. It implements a type of breakout strategy. The arrows indicate market direction. Use the indicator on M15 charts and higher. The indicator draws two bands near price action and generates signals when the price closes below the lower band and also above the upper band. The indicator uses periodic highs and lows to calculate upper and lower threshold bands.
FREE

StopLevel The meter controls the STOPLEVEL level. When the level changes, it signals with an alert. STOPLEVEL - the minimum offset in points from the current closing price for placing Stop orders, or the minimum allowable stop loss / take profit level in points. A zero value of STOPLEVEL means either the absence of a restriction on the minimum distance for stop loss / take profit, or the fact that the trading server uses external mechanisms for dynamic level control that cannot be transmitte
FREE
Range Pullback Limits – Smart Buy/Sell Zone Indicator for MT5 Range Pullback Limits is a professional MT5 indicator that automatically marks potential Buy Limit and Sell Limit levels during ranging markets. It helps traders identify high-probability pullback zones and avoid trading when the market is trending strongly. *Note: Combine this indicator to filter entry points - https://www.mql5.com/en/market/product/149443 Key Features Works on Forex, Gold (XAUUSD), Crypto, Indices, Stocks Detects r
FREE
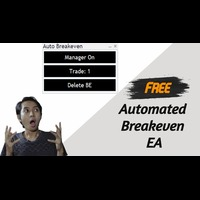
Introducing a powerful MetaTrader 5 Expert Advisor designed to enhance your trading strategy – the Auto Breakeven EA! This feature-rich EA is tailored to bring your stop-loss to breakeven, ensuring a risk-free trade once the market moves in your favor up to a specified price.
Explore the full potential of the Auto Breakeven EA. Download it for free now, and find the download link at the bottom of our page. Elevate your trading experience and take control of your risk management strategy. Happy
FREE
MGH ZigZag Fibonacci – Version 1.3 MGH ZigZag Fibonacci is a fully automated trading system for MetaTrader 5, specifically designed for Gold (XAUUSD) on the M15 timeframe. This EA combines the internal ZigZag structure with the Fibonacci Retracement framework to create an accurate mechanism for detecting high-probability swing points, reversals, trend continuation zones, and support breakout patterns. It also features multi-layered momentum filtering and a stop-loss mechanism. V
FREE

Discount 50% for 20 first customers
This Trading System from Scarface Trades. This expert does not use dangerous martingale, grid , have stoploss and tp, recommended to use 1% risk and 1:2 RR Ratio. The best pair is Tesla, i use icmarkets to backtest. It scan the 5 min opening range, and define order block after breakout the opening range, will take position on retest the order block. So far i have backtested only Tesla make a good profit. Download this set files 5minorobteslamt5.set.zip Pair
FREE

Excellent dashboard for market analytics. The panel helps to analyze the values of the RSI indicator and its signals.
With this panel you can: watch the current signal from RSI on all timeframes; watch the current signal from RSI by different symbols; watch the current RSI value; several types of signals for analytics.
Values in a table cell: RIS value.
Signal type: RSI crosses level buy out/level sell out (outside); RSI crosses level buy out/level sell out (inside);
RSI is upper

SMC Hacker AI MT5 – Bitcoin Smart Trading Automation Powered by Smart Money Concepts and VWAP AI Intelligence This Expert Advisor leverages Artificial Intelligence techniques to analyze market data, recognize patterns, and make smarter trading decisions in real-time. Unlike traditional rule-based EAs, this system adapts to changing market conditions using: Pattern recognition based on historical data Dynamic decision-making with AI logic layers Self-adjusting filters for entry and exit timing Th

The indicator is designed for displaying the following price levels on the chart: Previous day's high and low. Previous week's high and low. Previous month's high and low. Each of the level types is customizable. In the indicator settings, you set line style, line color, enable or disable separate levels.
Configurations ----Day------------------------------------------------- DayLevels - enable/disable previous day's levels. WidthDayLines - line width of daily levels. ColorDayLines - line
FREE

BUY INDICATOR AND GET A PIVOT POINT EA FOR FREE AS A BONUS + SOME OTHER GIFTS! Attention, the MT5 version of this application does not work on strategy tester, only on live accounts or demo accounts on live market. If you need an MT5 demo version of the Indicator send me a private message here: https://www.mql5.com/en/users/italobr ITALO PIVOTS INDICATOR is the best pivot point indicator for strong price reversals and continuations of price movements ever created, and why is that? You
Range Breakout EA – Simple Description Concept
An automated trading robot for MetaTrader 5 that exploits range breakouts with two key periods: Features Automatic market hours management Customizable Stop Loss and Take Profit Smart Trailing Stop Built-in testing mode for simulation Detailed logs for monitoring How It Works Records extreme prices at the start of the day Waits for a breakout of the secondary range Opens a position in the breakout direction Automatically manages the trade (SL/TP/Tr
FREE

Logic Trade Solution Indicator (Standalone)
Idea by Suresh Dhuraisami | Code by Rafilathif Description The Logical Trading System (LTS) is a powerful multi-timeframe indicator for MetaTrader 5, designed around the concept of Valid Reversal Zones (VRZ). It generates precise trading signals and delivers comprehensive alerts, ideal for traders who value structured price action and zone-based strategies. Key Features VRZ Zone Detection: Identifies high-probability reversal zones using swing hig
FREE

**Bneu Trade Manager** is a trading utility Expert Advisor for MetaTrader 5 designed to assist traders in managing their trading operations through a visual panel interface. This free version provides essential trade management tools suitable for manual traders who want to manage trades efficiently using a graphical interface.
**Main Functionality**
**Visual Trade Management:** The utility provides drag-and-drop horizontal lines on the chart for stop loss and take profit placement. Users can
FREE

**Advanced Position Manager EA** is a professional-grade MetaTrader 5 Expert Advisor designed to protect and maximize trading profits through intelligent stop-loss management. It automatically trails stop losses as profits grow, ensuring you lock in gains while giving trades room to run.
Core Functionality
- **Automatic Profit Protection**: Trails SL as profits grow
- **Works Immediately**: Manages existing positions on startup
- **Two Trailing Modes**: STEP-based or CONTINUOUS
- **Two Manageme
FREE

PRO VERSION https://www.mql5.com/en/market/product/144989?source=Site https://www.mql5.com/en/users/gedeegi/seller GEN Support & Resistance (EGGII77) is an MT5 indicator that automatically detects and draws Support & Resistance levels based on pivot highs and lows. The indicator features two sets of S&R (main structure and quick levels), a customizable maximum number of lines, adjustable colors, and a clean chart display for clearer price action analysis.
FREE

This EA opens orders based on trends. It sets a stop loss (SL) when the price moves negatively and a take profit (TP) when each order becomes profitable. The EA has a Martingale-like behavior, and it appears that SL might not always be set if the conditions aren't fully met. Users should be prepared for potential account wipeout, but the advantage is that the starting capital is only $1000. You can use this EA to work towards recovering your initial investment, then let it continue running. The
FREE

Critical Market Session Information with a Single Glance Stop juggling multiple tools and squinting at time zone converters. The SessionInfoDisplay Indicator is your new, indispensable trading co-pilot that puts real-time market intelligence directly on your chart. What It Does: Your Essential Trading Dashboard This intelligent indicator provides three critical pieces of information at a glance: 1. Real-Time Session Detection - Automatically identifies which major financial session is act
FREE

https://www.mql5.com/en/users/gedeegi/seller
GEN FXTrendZones GEN FXTrendZones is a technical analysis indicator designed to identify key price zones using Fibonacci retracement and extension levels, while also detecting market structure changes such as Break of Structure (BoS) and Change of Character (CHoCH). The indicator helps traders visualize critical swing areas and potential trend continuation or reversal zones. It includes a visual info panel and optional price alert system.
FREE

Highly configurable Adx indicator.
Features: Highly customizable alert functions (at levels, crosses, direction changes via email, push, sound, popup) Multi timeframe ability Color customization (at levels, crosses, direction changes) Linear interpolation and histogram mode options Works on strategy tester in multi timeframe mode (at weekend without ticks also) Adjustable Levels Parameters:
ADX Timeframe: You can set the lower/higher timeframes for Adx. ADX Bar Shift: you can set the of
FREE

US 30 BOT This is a simple quantitative model that trades US30 Index from NASDAQ top 30 American stocks It uses volatility contraction and expansion as a basic theory. Place it on US30 chart ,any timeframe. Hedged accounts are advised NB: Standard accounts are preferred and well regulated brokers eg ICMarkets are advised to avoid unnecessary losses eg slippage ones,commissions and large spreads. Minimum account balance ADVISED : USD 100 HOW TO USE: A VPS is highly recommended. AWS offers 1 yea
FREE

[ My Channel ] , [ My Products ]
Overview
The Lorentzian Distance Classifier is a machine-learning-based trading indicator that uses Lorentz distance as its core metric within the Approximate Nearest Neighbors (ANN) framework. Instead of relying on traditional Euclidean distance, it treats financial price action as if it occurs in a “distorted” price–time space (similar to how massive objects bend spacetime in relativity). This approach makes the classifier significantly more robust to market n

The Wiki Trade EA is a product meant for EURUSD/GBPUSD trading; it is used on the M15 timeframe, provides high performance, and has a simple configuration with few parameters. A Free version has been released for everyone to use. Be sure to backtest it before you start using it. Please give it a 5-star rating if you find it effective, and share the information with others.
Setup: Target Market : EURUSD/GBPUSD Optimal Timeframe : M15 Ideal Account Types : ECN, Raw, or Razor with low spreads.
FREE

Order Block EA is an expert advisor designed to trade based on the concept of order blocks, applying principles from the ICT approach. The system identifies key market zones to generate structured buy or sell signals. To enhance signal quality, it uses an Exponential Moving Average (EMA) as a directional filter.
Key Features: Configurable risk management:
The system includes a complete risk control module that allows you to set: Daily loss limits Weekly loss limits Per-trade loss limits Tot
FREE

Introducing Night Scalper Night Scalper is designed to trade during the late hours when volatility is low, hunting for small but consistent profits. It doesn’t use risky strategies like martingale or grid trading. Instead, it uses smart risk management, to maximize profit while keeping your capital safe.
Launch promo: Try it for one month for only $39! Installation guide: https://www.mql5.com/en/blogs/post/759313 Contact us here on MQL5, if you have any questions or need assistance!
Forge
Enhance your portfolio risk management with the Account Trailing Stop Manager MT5, a powerful Expert Advisor (EA) designed to automatically track and trail the total profit of your account or specific magic number trades on MetaTrader 5, closing all trades when the current profit falls below the last peak profit. Praised on MQL5, Forex Factory, and Reddit’s r/Forex for its dynamic profit-locking mechanism, this EA is a favorite among scalpers, day traders, and swing traders in volatile markets
FREE

Global Market Sessions – Visual Analyzer for MT5
A lightweight MT5 indicator that visually maps Tokyo, London and New York sessions, auto-detects broker timezone & DST, and highlights the best liquidity windows for smarter trading. See the market’s rhythm at a glance. Trade with clarity, precision, and confidence. Overview Global Market Sessions is a powerful yet easy-to-use MT5 indicator that visually displays the world’s major trading sessions (Tokyo, London, New York) directly on your chart
FREE

Detect divergence (classic, hidden) price and all oscillator indicator include: RSI, CCI, MACD, OSMA, Stochastic, Momentum, Awesome Oscillator (AO), Accelerator Oscillator (AC), Williams Percent Range (WPR), Relative Vigor Index (RVI), Rate of Change (ROC). Confirm reversal with dochian channel for to improve signal quality. Divergence is when the price of an asset is moving in the opposite direction of a technical indicator , such as an oscillator, or is moving contrary to other data. Diverge

Click Bait Pro – Synaptix Quant Click Bait Pro is a comprehensive trade management solution designed to provide precision, control, and efficiency in every market condition. Built with a structured approach to risk management, the tool ensures disciplined execution while offering traders the flexibility to adapt strategies across multiple market scenarios. Key Features: Account & Risk Management Real-time account information display with balance, equity, and risk exposure. Adjustable risk percen

SMART MONEY SCALPER EA - ICT Scalping Strategy Description INTRODUCTION - WHY THIS ICT SCALPING EA IS ESSENTIAL FOR YOUR SUCCESS Dominate the markets with the most advanced ICT scalping system ever created. The Smart Money Scalper EA is specifically engineered for high-frequency ICT scalping, combining Inner Circle Trader concepts with lightning-fast execution to capture multiple quality trades throughout each trading session. This specialized scalping EA transforms ICT methodology into a pr
FREE

Introducing the "Fibonacci Retracement EA": A free, educational tool designed for new and aspiring traders. This Expert Advisor helps you understand a classic trading strategy by visually demonstrating its logic directly on your chart. It is based on a simple yet effective trend-following strategy. It uses the "EMA200" as a filter to determine the main trend (uptrend or downtrend). It then waits for the price to retrace to a specific "Fibonacci level" (default is 61.8%) before opening an order.
FREE

Калькулятор размера позиции в виде индикатора. Для тех случаев, когда использование стандартных советников для расчета риска невозможно. Два режима работы: Маркет и Отложенные ордера. Передвигаете линию SL и получаете необходимый объем позиции согласно настройкам риска. Только показывает информацию, сделки сам не открывает. Для корректной работы следует добавить все Major пары в Market Watch.
FREE

Many friends asked me for a simple, non-obtrusive, resource-friendly clock to track the time during their trades. It seems pretty obvious, but it is a must-have for those trading the market manually, waiting for the Market News, or just to visually know what time it is... Trading is an absorbing endeavor! So, here it is... Totally configurable, including Font Type, Font Size and Chart Location: Upper Left/Center/Right OR Lower Left/Center/Right, with a little twist of adjusting the Offset, just
FREE

Slippage Analyzed, designed for high precision trading and for the entire market It works for both live or demo accounts, to analyze all your positions with Take profit and Stop loss, so you can analyze the slippage that your broker has
The price increases for each acquisition, with this we will protect so that few can have my unique strategies My other developments can be viewed here
What is Slippage in trade? The slippage or sliding is the difference in price that can occur between the mo
FREE
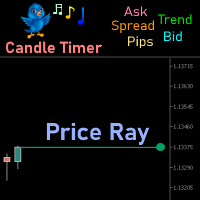
Price Ray indicator is a utility that will improve the way you trade. Primarily, it shows the Bid, Ask or Last price as a line ray which beams till the current candle, last visible chart candle or extended to all candle bars. The enhanced features in this indicator provide information in an area where you focus most, right next to the current candle. You can select text to be shown above or below the Price ray. The indicator is fully customizable, allowing it to fit any strategy requirements. Th
FREE

The Fisher Transform is a technical indicator created by John F. Ehlers that converts prices into a Gaussian normal distribution. The indicator highlights when prices have moved to an extreme, based on recent prices. This may help in spotting turning points in the price of an asset. It also helps show the trend and isolate the price waves within a trend. The Fisher Transform is a technical indicator that normalizes asset prices, thus making turning points in price clearer. Takeaways Turning poi
FREE

This a fairly complex EA that uses a MACD for going long (80%) and RSI for going Short. As SMP is a very bullish index, long is the general preference. This took me over 100 hours of design, testing, re testing, and robustness analysis. Building process, I used a MACD template that I've seen work in manual trading and applied it algorithmically. I then used machine learning for data from 2015-2020 to optimize and also create a short option using random variables. As you can see in backtests
FREE

Have you ever wondered which currency is the strongest at any particular time? Or which currency pair is trending the most. Well, the currency strength meter helps with just that. It compares USD , EUR , AUD , CHF , GBP , CAD and NZD depending on the timeline you have chosen in settings, and ranks them on the number of pips each has moved compared to the rest. N/B: All currency charts of the above pairs must have loaded. You can do this by highlighting all major and minor currencies in
FREE

MTF Levels And Moving Averages is a professional indicator designed to identify key support and resistance levels across multiple timeframes. The tool helps traders locate precise entry and exit points by analyzing market structure and price action patterns. Key Features The indicator provides multi-timeframe analysis covering H1, H4, D1, and W1 periods simultaneously. It identifies supply and demand zones where price typically reacts, using color-coded visualization to distinguish between dif

Ever feel lost in a trade, unsure of your true risk exposure? Have emotional decisions and a lack of discipline cost you dearly? The line between consistent profit and a blown account is drawn by one thing: professional risk management. But calculating and monitoring that risk in real-time is stressful and complex. Introducing Risk Matrix, the definitive visual command center for MetaTrader 5, engineered to bring military-grade discipline and crystal-clear clarity to your trading. Risk Matrix is
FREE

The initial balance (IB) is a range in which the price spent its first two OPT periods after the opening. In other words, the opening balance is a range of the first hour after the market opened. The opening balance arose from room trading, as room traders observed the various ranges after the market opened.
This indicator allows you to enter the starting and ending hours and minutes of a specific hourly time range so that the trader can set up different IBs according to the market.
Automatic
FREE

PLEASE HELP REVIEW/ SUPPORT/ SHARE THIS OTHER INDICATOR HERE https://www.mql5.com/en/market/product/51637 AS YOU DOWNLOAD THIS ONE FOR FREE. THANKS.
This Indicator is based on four moving averages and the PIVOT points. The indicator provides clarity to trading, especially in ranging markets when price is very slow and tight. You can trade intensively daily, every day with this indicator. You may decide to trade with this indicator alone and get the maximum out of the market. The indicator w
FREE

This is a classical trading strategy, which falls into the category of breakout systems. They form support and resistance levels, which temporarily limit further price movement. When the price breaks down the support level or breaks up the resistance level, there emerges a strong momentum in the breakout direction, which allows to make profit on strong price movements with moderate risk. To create the strategy, we used historical data with the quality of history of 99.9%.
It uses filtration of

Smart Trend pro New - Advanced Trend Indicator with Interactive GUI Professional trend-following indicator with comprehensive visualization and control panel Key Features: Advanced Trend Detection Reliable Half Trend algorithm for precise trend identification Color-coded trend lines (Blue for bullish, Orange for bearish) Customizable amplitude parameter for different trading styles Interactive GUI Panel Real-time market strength visualization (Bulls vs Bears) Current signal display (Buy/Se
FREE

Imagine: you are on the verge of huge profits, but the market suddenly changes and you miss the chance. Or even worse, you get losses instead of profits. What if you had a reliable ally who whispers in advance: "Get ready – the waves are coming!"? Meet Harbinger , a revolutionary indicator for MetaTrader 5, specially designed for traders who are tired of chaos and want to anticipate market changes! Harbinger is a smart algorithm that analyzes hidden trend volatility patterns to signal upcoming p

Expert Advisor - Advanced AI/ML Multi-Algorithm Trading System
Deep Q-Network + 5-Network Ensemble with Continuous Learning & Pattern Recognition CORE SPECIFICATIONS & CAPABILITIES AI Strategy:
Component Type Primary Deep Q-Network Ensemble 5 Neural Networks Learning Reinforcement + Meta Pattern Chart Recognition Regime Market Classification Trading Specs:
Parameter Value Primary TF M15 Analysis M1-D1 Multi-TF Instruments ALL Markets Min Deposit $500+ Lot Size 0.1 Default Risk Protection:
F
FREE
Pivot Points Indicator – a fast, reliable, and fully customizable pivot detection for MetaTrader 5. This indicator uses MetaTrader’s native iHighest and iLowest functions to identify pivot highs and lows by scanning for the highest and lowest prices within a user-defined window of bars. A pivot is confirmed only when the current bar is the absolute maximum or minimum within the selected range, ensuring accurate and timely signals based on robust built-in logic.
Key Features No Repainting : Onc
FREE

English
VWAP Daily (Clean) is a simple and lightweight indicator that plots the classic Daily VWAP (Volume Weighted Average Price) directly on your MT5 chart. Features: Classic Daily VWAP calculation Supports real volume (if available) or tick volume Timezone offset option to match your broker’s server time Weekend merge option (merge Saturday/Sunday data into Friday) Clean version → no arrows, no alerts, only VWAP line VWAP is widely used by institutional traders to identify fair value, su
FREE

Universal EA — гибкий торговец для тех, кто ценит контроль Основные возможности Сигналы на основе структуры цены :
Торгует по бычьим и медвежьим импульсам с настраиваемой строгостью фильтрации. Интеллектуальный фильтр тренда :
Определяет направление и силу тренда в процентах. Возможность торговать только по тренду или в любом режиме . Двойной траллинг-стоп :
— Базовый трал — по ATR с динамическим множителем.
— Дополнительный трал на выбор: по свечам, фракталам, Parabolic SAR, скользящей

VolumeFlow is a Volume Accumulation / Distribution tracking indicator. It works in a similar way to OBV, but it is much more refined and includes the options to use: Classical Approach = OBV; Useful Volume Approach; Gail Mercer's approach; Input Parameters: Input Parameters: Approach Type: Explained above; Volume Type: Real or Ticks; Recommendations: Remember: The TOPs or BOTTONS left by the indicator are good Trade Location points. This is because the players who were "stuck" in these regions w
FREE
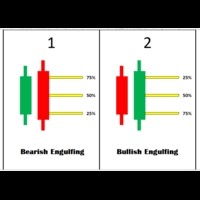
Engulfing Levels Indicator – Smart Entry Zones for High-Probability Trades Overview:
The Engulfing Levels Indicator is designed to help traders identify key price levels where potential reversals or trend continuations can occur. This powerful tool combines Engulfing Candle Patterns , Percentage-Based Levels (25%, 50%, 75%) , and Daily Bias Analysis to create high-probability trading zones . Key Features:
Engulfing Pattern Detection – Automatically identifies Bullish and Bearish Engulf
FREE

Capybara EA is an advanced automated trend following system based on the Hama indicator. If the market turns bearish and the indicator turns red the EA will sell, if the market turns bullish and the indicator turns blue the EA will buy. The EA can accurately detect the beginning of uptrends and downtrends and will control open trades in a martingale/grid style until it hits TP. Recommended pairs: All major pairs like eurusd; audusd; gbpusd; nzdusd and also minor pairs like audcad; nzdcad;

If you love this indicator, please leave a positive rating and comment, it will be a source of motivation to help me create more products <3 Key Takeaways Fisher is a repaint indicator. It recalculates previous bars when new bars become available. Modified to avoid repainting to accommodate some merchants. Fisher indicator is quite a simple histogram indicator that detects the trend's direction and strength and signals about trend changes. Traders look for extreme readings to signal potential p
FREE

** All Symbols x All Timeframes scan just by pressing scanner button ** *** Contact me to send you instruction and add you in "ABCD scanner group" for sharing or seeing experiences with other users. Introduction This indicator scans AB=CD retracement patterns in all charts. The ABCD is the basic foundation for all harmonic patterns and highly repetitive with a high success rate . The ABCD Scanner indicator is a scanner reversal ABCD pattern that helps you identify when the price is about to cha

x4o B1 Dollar Trader Heiken Ashi Trend Retest Strategy
Automated trading system combining Heiken Ashi analysis with Moving Average retest methodology for trend-following entries on H1 timeframe. Trading Methodology The EA monitors two 25-period Moving Averages calculated on High and Low prices to identify trend direction. When price closes above MA High with candle high exceeding the moving average, an uptrend is detected. When price closes below MA Low with candle low beneath the moving aver
FREE

Powerful trend indicator provided with all necessary for trade and it is very easy to use. Everyone has probably come across indicators or Expert Advisors that contain numerous input parameters that are difficult to understand. But here, input parameters are simple and it is no need to configure anything — neural network will do all for you.
Difference from a classic version
The real-time multi time frame panel is added, so you can check a trend for other timeframes without switching the schedu
Learn how to purchase a trading robot from the MetaTrader Market, the store of application for the MetaTrader platform.
The MQL5.community Payment System supports transactions via PayPal, bank cards and popular payment systems. We strongly recommend that you test the trading robot before buying, for a better customer experience.
You are missing trading opportunities:
- Free trading apps
- Over 8,000 signals for copying
- Economic news for exploring financial markets
Registration
Log in
If you do not have an account, please register
Allow the use of cookies to log in to the MQL5.com website.
Please enable the necessary setting in your browser, otherwise you will not be able to log in.