YouTube'dan Mağaza ile ilgili eğitici videoları izleyin
Bir alım-satım robotu veya gösterge nasıl satın alınır?
Uzman Danışmanınızı
sanal sunucuda çalıştırın
sanal sunucuda çalıştırın
Satın almadan önce göstergeyi/alım-satım robotunu test edin
Mağazada kazanç sağlamak ister misiniz?
Satış için bir ürün nasıl sunulur?
MetaTrader 5 için Uzman Danışmanlar ve göstergeler - 61

EA351 – Multi-Entry Momentum Scalper (MT5) EA351 is an automated trading system designed for high-frequency scanning and multi-position entries on M5 timeframe , optimized for 0.01 lot trading. The EA continuously scans the market; when all conditions are met, it can open multiple positions (pyramiding) to maximize momentum moves. When profit grows, the EA manages the trade using trailing protection , and it can exit on reversal to protect gains. Key Features Timeframe: M5 (recommended) Default

The Forex Fakeout or False Breakout + Grid Strategy EA is designed to detect deceptive market movements, where price briefly breaks key support or resistance levels and quickly reverses. This EA capitalizes on those false breakouts with a smart Grid system to maximize profit potential while controlling risk. Key Features: Automatic detection of Fakeouts or False Breakouts at major levels
Smart Grid strategy to manage positions and average entries
Ideal for range-bound and volatile market
FREE

Ratio Indicator - User Guide
Special Deal! Leave a review and get the indicator Long & Short Cointegration Analyzer for free — just send me a message!
This Ratio indicator between assets allows you to monitor and trade the price relationship between two assets selected by the user. It calculates the ratio between the prices of two assets, referred to as Asset1 and Asset2 (e.g., "GBPUSD" and "EURUSD"), and plots a moving average of the ratio along with Bollinger Bands . These bands are used to
FREE

Special Offer ... It is totally free for all. New one coming soon...................
About This Indicator: RSI vs SMA Indicator: A Comprehensive Technical Analysis Tool for Better for Identify the Short and Long Signals.
The RSI vs SMA Indicator is a powerful technical analysis tool designed to understanding Market Price Fluctuation for Long or Short signals. This user-friendly Indicator good for both novice and experienced traders, providing valuable indication in price chart and separate wind
FREE

All-in-one trading dashboard with real-time drawndown alert performance analytics, hourly heatmap, risk management, strategy note,TP/SL calculator, and CSV export. Dark/Light themes. Responsive UI. Full Description: TradingPerformanceAnalyzer is a comprehensive GUI-based utility for MetaTrader 5 that provides traders with powerful real-time analytics, professional TP/SL visualization, and intelligent risk management — all within a sleek, TradingView-inspired interface. KEY FEATURES: Performa
FREE

RITZ Candle Kaufman’s AMA is a precision market-flow indicator built around Kaufman’s Adaptive Moving Average (KAMA / AMA) — a dynamic smoothing algorithm that automatically adjusts to changing volatility.
This enhanced version interprets AMA momentum directly into smart candle-color signals , giving traders a clean, noise-filtered view of trend strength and directional bias. Where most indicators repaint or react too slowly, RITZ Candle AMA delivers stable, non-repainting color shifts based on
FREE
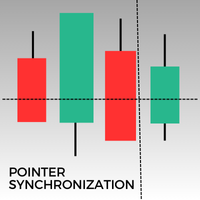
Bu MetaTrader 5 göstergesi, aynı varlığa ait tüm açık grafiklerde imleci otomatik olarak senkronize eder. 1 dakikalık veya günlük bir grafikte olsanız bile, imleç tüm açık pencerelerde aynı fiyata otomatik olarak hizalanır. Bu özellik, tutarlı ve hızlı bir analiz sağlar ve karar verme sürecini geliştirir. Birden çok grafik arasında imleci senkronize etmek, farklı zaman dilimlerinde fiyat hareketlerinin doğru bir genel görünümünü sürdürmek isteyen yatırımcılar için değerli bir araçtır.
FREE

O Indicador valida a força da tendência utilizando o volume negociado. Os candles são mostrados na cor verde indicando força compradora e cor vermelha na força vendedora. O movimento é encerrado pelo SAR parabólico. Vantagens: Filtra distorções de preço sem volume financeiro; Filtra consolidações e movimentos laterais; Filtra divergências de volume pelo indicador Money Flow. Desvantagens: Não filtra todos os falsos rompimentos, visto que rompimentos importantes geram altos volumes financeiros; N
FREE

GOLD BEES – AI-Powered XAUUSD Expert Advisor Dominate the Gold Market with Intelligent Precision Meet GOLD BEES , your next-generation AI-driven trading assistant — meticulously engineered to conquer the XAUUSD (Gold) market on the M30 timeframe .
Powered by advanced artificial intelligence algorithms , GOLD BEES adapts, learns, and evolves with the market — delivering consistent, stable, and intelligent trade executions. If you’re looking for a professional-grade EA that comb
The Sandman EA — MT5 Scalping Robot for Calm Precision in Chaos
“Others have seen what is and asked why. We have seen what could be and asked why not.” Introducing The Sandman — a high-precision, no-nonsense MT5 scalping robot designed to bring calm and control to your trading experience. Overview The market is chaotic and unpredictable — even experienced traders face losses. The Sandman was built to free you from emotional trading. It acts boldly and logically using a proven, fully automated
FREE

Overview: Golden Buzzer MT5 is a powerful two-in-one Expert Advisor designed exclusively for trading XAUUSD (Gold) on the MetaTrader 5 platform. It operates using two distinct strategies — Strategy 1 and Strategy 2 — both based on similar trading principles but with slightly different logic for trade execution. Users can choose to run either strategy independently or both simultaneously , offering flexibility and strategic diversity. Main Features: Specifically built for Gold (XAUUSD) trading D
FREE

Are you tired of missing out on fast profits in XAUUSD (Gold) ? Introducing Eagle 900 , a next-generation Gold Scalping algorithm designed specifically for traders who demand speed, precision, and consistency. This is not just a trading bot; it is a professional tool built to dominate the market volatility. We have engineered Eagle 900 to snipe micro-movements with high accuracy, ensuring you stay ahead of the crowd. WHY CHOOSE EAGLE 900? Lightning-Fast Scalping Snipes micro-movements in th

BTMM Continuation Sessions + Re-Entry Indicator (MT5) is a chart visualization tool designed to make continuation trading clearer and faster.
It draws session boxes (Asian, London, New York) and marks continuation entry + re-entry opportunities during active sessions.
Works on Forex pairs and XAUUSD (depending on broker symbols).
This is an indicator (not an EA). It does not place trades automatically.
Key Features
Session Boxes Asian, London, New York boxes Custom colors, opacity,
FREE

Purpose and functions of the indicator The indicator determines and marks the moments of trend change on the chart based on the theory of fractal levels breakout on any of the analyzed timeframes. If a breakout based on all rules is valid, a horizontal line with corresponding color will appear on the chart. If there is an uptrend, the line will be blue. In the descending trend, the line will be red. The blue line is a strong support level, the trader should look for buying opportunities above th
FREE

No Martingale Gold Digger – Professional Expert Advisor for XAUUSD
No Martingale Gold Digger is an Expert Advisor designed for traders who want a solid, real, and reliable system—without martingale, without grid, and without artificial tricks to generate unrealistic equity curves.
It works exclusively on Gold (XAUUSD), both CFD and Futures, and uses a simple, transparent, and robust trend-following / breakout logic. Trading Philosophy No Martingale Gold Digger is built to be a real EA:
• no mac

SR Breakout Scalper Açıklaması SR Breakout Scalper: Hacim Onaylı Kırılımlarla Piyasayı Yakalayın Piyasadaki gürültüden arınmış, net ve yüksek olasılıklı giriş noktaları mı arıyorsunuz? SR Breakout Scalper , profesyonel yatırımcıların kullandığı kanıtlanmış bir stratejiyi tamamen otomatik hale getiren, yeni nesil bir Uzman Danışmandır: Hacimle Onaylanmış Destek ve Direnç Kırılımları. Bu EA, sadece fiyat hareketlerine odaklanmak yerine, bir kırılımın arkasındaki gerçek gücü (hacmi) analiz eder. B
FREE

MT5 Trade Manager - Multi-Page Dashboard Professional Trading Panel with Advanced Risk Management Transform your MetaTrader 5 trading experience with this comprehensive trade management system featuring a sleek, multi-page dashboard that gives you complete control while maintaining maximum chart visibility. Key Features 6 Interactive Pages DASHBOARD - Quick overview with real-time balance, equity, margin, and today's P/L. One-click BUY/SELL buttons and emergency close all positions. TRADE - Adva
FREE

The indicator My Big Bars can show bars (candles) of a higher timeframe. If you open an H1 (1 hour) chart, the indicator puts underneath a chart of H3, H4, H6 and so on. The following higher timeframes can be applied: M3, M5, M10, M15, M30, H1, H3, H4, H6, H8, H12, D1, W1 and MN. The indicator chooses only those higher timeframes which are multiple of the current timeframe. If you open an M2 chart (2 minutes), the higher timeframes exclude M3, M5 and M15. There are 2 handy buttons in the lower r
FREE
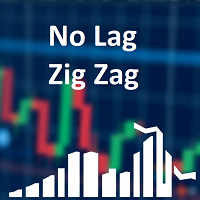
Classic ZigZag formula. But no lags and repaints. You can see on screenshots that it shows values between peaks and it is useful to test strategies based on indicator. Because sometimes people find a good idea about it but don't understand that repainting indicators have some things to keep in mind. The parameters are the same as original ZigZag indicator: Depth, Deviation and Backstep. Useful for visual analyze of the chart and cut strategies based on repainting peaks.
FREE

Индикатор для синхронизации и позиционировании графиков на одном и более терминалах одновременно. Выполняет ряд часто необходимых при анализе графиков функций: 1. Синхронизация графиков локально - в пределах одного терминала при прокрутке, изменении масштаба, переключении периодов графиков, все графики делают это одновременно. 2. Синхронизация графиков глобально - тоже самое, но на двух и более терминалах, как МТ5, так и МТ4. 3. Позиционирование графика на заданном месте при переключении периодо
FREE

Developed by Charles Le Beau and featured in Alexander Elder's books, the Chandelier Exit sets a trailing stop-loss based on the Average True Range (ATR). The indicator is designed to keep traders in a trend and prevent an early exit as long as the trend extends. Typically, the Chandelier Exit will be above prices during a downtrend and below prices during an uptrend.
Calculation
The original Chandelier Exit formula consists of three parts: a period high or period low, the Average True Rang
FREE
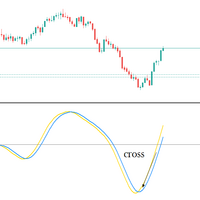
Big promotion on the Robos, Get yours now Robos Indicator The ROBOS indicator is a multi timeframe oscillator that targets the overbought and oversold regions of a price chart, a signal is indicated by the two lines crossing, compatible with all tradable instruments
Latest Release
The latest release is the version 4.0
#What's new in version 4.0 ?
Features
Extreme oversold and overbought levels
ROBOS version 4.0 comes with cool new feature , the ability to target only extrem

Advanced High-Frequency Trading System System Overview HFT DCA Smart Trading EA is an Expert Advisor specifically designed for high-frequency trading on the MetaTrader 5 platform, optimized for M1 timeframe with intelligent Dollar Cost Averaging (DCA) strategy. Core Features High-Frequency Trading (HFT) Timeframe : Operates exclusively on M1 to capture short-term opportunities Real-time Analysis : Processes and executes trades in real-time Low Latency : Optimized for ultra-low latency trading en

APICT Chart Patterns – Trend Line & Pattern Recognition for MT5 Enhance your technical analysis with the APICT Chart Patterns Indicator — an advanced tool for automatic pattern and trend line detection in MetaTrader 5. Key Features Automatic Pattern Detection: Identifies over 10 classic chart patterns, including pennants, wedges, channels, and double tops/bottoms. Real-Time Trend Lines: Draws support and resistance lines using smart algorithms. Custom Sensitivity: Adjust detection for major or
FREE

This indicator is based on Mr. Mark Fisher's ACD strategy, based on the book "The Logical Trader."
- OR lines - A lines - C lines - Daily pivot range - N days pivot range - Customizable trading session - Drawing OR with the desired time Drawing levels A and C based on daily ATR or constant number - Possibility to display daily and last day pivots in color zone - Displaying the status of daily PMAs (layer 4) in the corner of the chart - Show the order of daily pivot placement with multi-day piv
FREE

TR Trade Manager – Professional Trade Execution & Risk Control for MT5 TR Trade Manager is a free trade management utility for MetaTrader 5, built for traders who want consistent risk control, fast execution, and disciplined trade management. Designed for real trading conditions, including prop-firm environments, this tool removes manual calculations and reduces execution errors so you can focus entirely on decision-making.
Why Use TR Trade Manager Most trading mistakes are not caused by poor
FREE

Interactive Trader - Advanced Visual Trading Panel for MT5 Get Ultra Charts Here! Interactive Trader is a comprehensive visual trading solution that enables traders to execute and manage trades directly from the chart using an intuitive graphical interface. This Expert Advisor combines one-click trading with advanced order management capabilities, making professional trading tools accessible through simple mouse and keyboard controls. Core Features
Visual Trading Interface - Clean, customizable
FREE
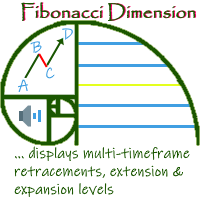
'Fibonacci Dimension' indicator allows display of preset or user-defined multi-timeframe Fibonacci levels. It automatically takes the previous high and low for two user-defined timeframes and calculates their Fibonacci retracement levels. It also considers the retraced level to draw the expansions on every change of price. A complete visual dimension in multiple timeframes allows deriving profitable strategies for execution. Enhanced functionality to view and customize the default Fibonacci Rang
FREE

Saw AI Trading - The Ultimate Trading Bot for Profits in All Market Conditions ️ Description: Saw AI Trading is an intelligent trading robot designed to perform efficiently in all market conditions. It stands out with its unique ability to generate profits whether the market is bullish or bearish, making it an ideal choice for both beginner and professional traders. What Makes Saw AI Trading Stand Out: Balanced Performance in Both Directions: Saw AI Trading can achieve profits regar
FREE

FVG Detector Multi-TF ( БЕЗ ФЛИКЕРА ) Автоматический индикатор для обнаружения и отображения ключевых ценовых уровней на основе концепций Smart Money Concept (SMC) . Индикатор идентифицирует Ценовые Разрывы Справедливой Стоимости (FVG) и Свинг High/Low одновременно на текущем графике и с нескольких старших таймфреймов. Особенности и преимущества 1. Усовершенствованный Анти-Фликер В отличие от стандартных индикаторов, вызывающих мерцание при тиковых обновлениях, здесь реализована оптимизированна
FREE

FX Correlation Matrix is a powerful multi-timeframe dashboard that helps traders analyze real-time currency correlations of up to 28 symbols at a glance. With customizable settings, sleek design, and manual symbol selection option, it enhances trade accuracy, reduces risk, and identifies profitable correlation-based opportunities. Setup & Guide: Download MT4 Version here. Follow our MQL5 channel for daily market insights, chart, indicator updates and offers! Join here.
Read the product des

Stochastic Color Alerts – Akıllı Momentum ve Renkli Trend Göstergesi
Stochastic Color, dinamik renk değişimleri ve akıllı uyarı sistemi sayesinde momentum değişimlerini, trend yönünü ve kesişim sinyallerini daha net şekilde belirlemek için tasarlanmış klasik Stokastik Osilatörün gelişmiş ve görsel bir versiyonudur. Bu gösterge, geleneksel %K ve %D mantığını renk değiştiren ana çizgiyle birleştirerek sayısal değerlere bağlı kalmadan piyasa gücünü, trend değişimlerini ve olası dönüş bölgelerini an
FREE

Forex17 Clock , MetaTrader 5 için geliştirilmiş hafif ve minimalist bir yardımcı araçtır. Broker sunucu saatini ve/veya kullanıcı tarafından ayarlanmış zamanı grafik üzerinde göstermeyi amaçlar. Ürünün amacı, grafik analizine müdahale etmeden net ve doğru zaman bilgisi sağlamak ve grafiği temiz ve işlevsel tutmaktır. Saat, paneller, arka planlar, kenarlıklar veya dikkat dağıtıcı görsel öğeler olmadan yalnızca metin kullanılarak doğrudan grafik üzerine çizilir. Bu yaklaşım düşük kaynak kullanımı,
FREE

I’m sharing this EA here for free to support the trading community. I hope it’s helpful, and don’t hesitate to reach out if you have any questions or feedback! Requirements
Trading pairs all trending Pairs especially USDJPY
Timeframe M1 to H6
Minimum deposit $ 100 Leverage 1:200 Brokers Hedging Pro or ECN Account Smart Stoch excels across all timeframes from M1 to D1, ensuring profitable trades with customizable risk percentage settings and a Trailing Stop Loss feature. Save all settings as gl
FREE

The Trading Sessions indicator is a simple tool that helps to highlight a specific trading session. For example, it can be used to differentiate the European, American or Asian sessions.
Main features The indicator shows a user-defined trading session. Alert notifications for the start and end of the session. Custom session time. Works on every timeframe (M1, M5, M15, M30, H1, H4, D1, W1, MN). Customizable parameters (Colors, alerts...). It can be used for creating EA. Available for MT4 an
FREE
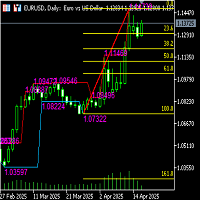
Functional description of automatic Fibonacci line indicator (including high and low channel lines) Indicator name Automatic Fibonacci retracement line + high and low channel auxiliary
Functional introduction This indicator combines the automatically identified high and low points of the band, automatically draws the Fibonacci retracement/extension line, and draws the highest and lowest price channel lines of the current analysis interval to provide traders with clearer support/resistance refe
FREE

**Veltrix Gold EA – Advanced Automated Trading Expert Advisor**
Veltrix Gold EA is a fully automated Expert Advisor specially optimized for trading XAUUSD (Gold) on the MetaTrader 5 platform. It combines trend-following strategies with smart risk management to deliver consistent performance in various market conditions.
### Key Features: - Optimized for Gold (XAUUSD) - Compatible with MetaTrader 5 - Uses advanced trend detection algorithms - Includes smart trailing stop and dynami
FREE

TradeConsole — On-Chart Trading Dashboard with Smart Alerts (Sessions • News • Strength • One-Click Controls) TradeConsole is a lightweight yet powerful on-chart utility that puts the most important market context in one place—so you can trade faster, stay organized, and avoid surprises. It combines market session tracking , an upcoming economic news panel , a visual currency strength meter , a quick technical bias read, plus trade summary and one-click controls . To top it off, TradeConsole inc
FREE

AI Adaptive Market Holographic System Indicator Based on Microstructure and Field Theory Abstract: This paper aims to explore the construction principles and implementation mechanism of a novel financial market analysis tool—the Micro gravity regression AIselfregulation system. This system fuses Market Microstructure theory, classical mechanics (elasticity and gravity models), information entropy theory, and adaptive AI algorithms. By aggregating Tick-level data in real-time, physically modeling

AC Pivot Panel – Your Ultimate Pivot Trading Tool The AC Pivot Panel is a powerful yet user-friendly pivot point indicator designed to help traders identify key support and resistance levels with ease. Whether you’re a beginner or an experienced trader, this indicator simplifies pivot trading and enhances your decision-making process. Key Features : Interactive Selection Panel : Easily adjust pivot settings directly on the chart with a compact and intuitive panel. Multiple Pivot Methods : C
FREE

Introduction
The SuperBands Indicator is a sophisticated technical analysis tool designed to provide traders with a clear visual representation of price movements within well-defined bands. This indicator is specifically engineered to filter out minor price fluctuations and market noise, offering traders a more accurate and reliable view of price trends and potential reversal points.
Signal
Buy when price breaks below the "Extremely oversold" band (darker red color) and then closes abo
FREE

Trading Strategy SecUnit B1 combines a powerful integration of the volatility-adaptive Supertrend indicator with the ADX indicator to confirm trend strength, ensuring trades are opened only when clear and strong trends form. The system is precisely optimized for Bitcoin market characteristics on the 4-hour timeframe, with parameters and settings tested across thousands of candles to achieve the optimal balance between profitability and safety. Multi-Stage Entry System : The first pos
FREE

Introduction
The RSI Plus is an innovative technical analysis tool designed to measure the strength and direction of the market trend. Unlike the traditional RSI indicator, the RSI Plus boasts a distinctive ability to adapt and respond to market volatility, while still minimizing the effects of minor, short-term market fluctuations.
Signal
Buy when the RSI plus has been in the oversold (red) zone some time and it crosses above the 20 level on previous candle close
Sell when the RSI plus ha
FREE

Volatilite Doktoru Temel Sürümünü Tanıtıyoruz: Sizin İçin Piyasa Ustası!
Hassas işlem yapmanın gerçek potansiyelini açığa çıkarmak için bir yolculuğa çıkmaya hazır mısınız? İşte size Volatilite Doktoru, döviz piyasalarının sürekli değişen dünyasında güvendiğiniz dostunuz. Bu olağanüstü çoklu döviz uzman danışmanı sadece bir işlem aracı değil, yatırımlarınızı benzersiz bir hassasiyet ve incelikle yönlendiren bir virtüözdir.
Devrim Yaratan Özellikleri Keşfedin:
1. Eşsiz Trend Analizi: Volatili
FREE

Indicator introduction:
The indicator is calculated by volumes and prices, It is a single side indicator, only has up arrow signals. It is better to use it in conjunction with other trend indicators, and you need to find the most efficient time to use it in order to acquire a high winning probability. The indicator can send emails, alerts and notifications to you when the indicator before k line has an up arrow. The indicator's parameters can be changed, including the computation period of the
FREE
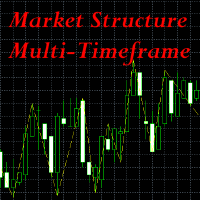
This indicator is extremely useful for traders who want to keep an eye on the market structure without wasting time drawing it manually. It also adds an important optional feature, which is MTF (Multi-Timeframe) analysis . Multi-Timeframe (MTF) analysis is a trading technique that consists of analysing the same financial instrument on different time intervals (charts) simultaneously, in order to gain a more complete view of the market. Starting with the analysis of higher timeframe charts to i
FREE

Copies Signal from any Telegram channel and instantly executes the trade on MT5 without admin rights! Do you receive trading signals on Telegram and wish they could execute instantly on Meta Trader 5? READ THIS FOR SETUP GUIDE
Telegram to MT5 Signal Copier is a powerful bridge between your Telegram signal channels and MetaTrader 5. It listens to messages from a specific Telegram channel and automatically extracts trading signals — including symbol, action, entry price, stop loss, and take prof
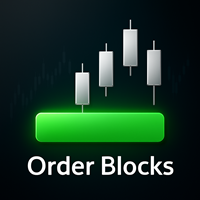
[ MT4 Version ] Order Block Indicator MT5 — Precision Trading Made Simple
Order Block Indicator MT5 is designed to help traders spot powerful reversal zones effortlessly — without cluttered charts or guesswork.
Built for scalping , swing trading , and smart intraday decisions , it highlights active order blocks across multiple timeframes with precision, speed, and full customization. Trade with clarity, save valuable time, and react instantly to market structure changes — even across Forex

Callous EA – Kural Tabanlı Otomatik Alım Satım Sistemi Metatrader5 için
Callous EA, finans piyasalarında tamamen otomatik işlemler gerçekleştirmek üzere geliştirilmiş kural tabanlı bir Uzman Danışmandır. Sistem, piyasa verilerini gerçek zamanlı olarak analiz eder ve insan müdahalesi olmadan önceden tanımlanmış algoritmik kurallara göre pozisyonları otomatik olarak açar, yönetir ve kapatır. Bu ürün herhangi bir kar veya getiri garantisi sunmamaktadır. Performans, piyasa koşullarına, oynak

The XU_30_913073101_S_HH_CF_SQX is an algorithmic trading strategy for MetaTrader, tested on XAUUSD (Gold) using the M30 timeframe from April 1, 2004, to April 24, 2024. There is no need to set up parameters, all settings are already optimized and fine-tuned.
Recommended broker RoboForex because of EET timezone.
You can find the strategy source code for StrategyQuant at the link: https://quantmonitor.net/gold-emperor/
Key details are:
Parameters
MagicNumber: 913073101
Main Chart: Curre
FREE
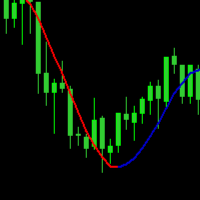
A moving average is simply a way to smooth out price fluctuations to help you distinguish between typical market “noise” and the actual trend direction . By “moving average”, we mean that you are taking the average closing price of a currency pair for the last ‘X’ number of periods. Like every technical indicator, a moving average (MA) indicator is used to help us forecast future prices.
FREE

Stop Loss Manager - Precision Risk Management for MetaTrader
Precision Risk Management - enhance your trading strategy with intelligent stop-loss automation. Minimize risk, maximize control, and secure profits with professional-grade trailing methods. What It Offers: Automatic stop loss detection and management for all manual trades using five proven professional trailing methods: Market Trailing (recent candlestick-based), ATR Trailing (volatility-adjusted), Parabolic SAR Trailing (trend-foll
FREE

Price Alert - Professional Price Notification System for MetaTrader
See More, Trade Better - enhance your MetaTrader experience with this essential price alert tool, extracted from the powerful Meta Extender suite. What It Offers: Create unlimited customizable price alerts that notify you instantly when specific price levels are reached. Each alert can be renamed with personal notes, making it easy to track multiple support and resistance levels, breakout points, or key trading zones across al
FREE

Description (English): Trend Test by Subho – Advanced Trend & Step Channel System Trend Test by Subho is a powerful all-in-one trend trading system designed to filter noise and provide clear market direction. This indicator combines two sophisticated algorithms: the Trend Test () and the Subho Step Channel into a single chart overlay. It also features a stylish Live Dashboard that alerts you to the current trend status in real-time. Key Features: Trend Test () Logic: An advanced tr
FREE

Secura Tactical EA - Version 1.0 Smart Trend Following with Pullback Entries Secura Tactical is a professional trading system that identifies strong trends and enters on strategic pullbacks to moving averages. The EA waits for price to retrace to key levels before entering, maximizing your profit potential while managing risk. How It Works: Identifies trending markets using dual moving averages and ADX indicator Enters trades when price pulls back to the moving average and bounces Places stop lo
FREE

Bu Gösterge, bir tüccar olarak piyasanın yönünü belirlemenize yardımcı olmak için geliştirilmiştir, Ticarette Üç tür hareketimiz vardır ve YUKARI, AŞAĞI ve YAN YOLLAR, Piyasa hareketinin yan yolları, çoğu tüccarın fiyat olarak sıkışıp kaldığı yerdir. konsolidasyon, bu basitçe yön olmadığı anlamına gelir. Scalpers için bu, YALNIZCA varlık sınıflarının bu dönemde olduğunu nasıl belirleyeceklerini bilirlerse onlar için bir avantaj olabilir.
Trendleri belirlemek için çapa geliştirme girişimi, bu g
FREE

Be sure to contact me after your purchase by writing in private messages! Also, if you have any questions before purchasing, don't hesitate to ask. Live Monitoring EURUSD MT4 version
Black Arrow is your assistant in the world of Forex trading! This advisor is a fully functional automated system that can optimally use a time-tested strategy to break out important price levels. This strategy, known since the birth of stock and financial markets, is a classic of stock analysis, honed and adapted

Identification of support and resistance areas
A useful indicator for traders
completely free
Can be used in all symbols
Can be used in all time frames
It has three different trends: short term, medium term, long term
Settings:
Clr1,2: You can change the color of the lines
Type Trend: You can determine the trend
Message me for questions, criticism and suggestions
FREE

Full Automated Trading panel . it works on any trading instruments: Forex, Stocks, Futures, Indices, CFD, Bonds, Cryptocurrencies; interface minimization function; flexibility of use;
Join my channel and check video of it ===> https://t.me/Ash_TheTrader/4986
Features :
Auto SL and TP Auto Close partial Auto Trailing Session Time Alert Time of trading Alert Profit and Percentage and etc.
FREE

The Stochastic Oscillator is one of the main indicators used in the analysis of financial assets. It is one of the highlights in the study of price movements and can be an important indicator of changing trends in the capital market. Stochastic is an oscillator used to identify when an asset is overbought or oversold. It consists of two lines: %K, which is calculated from the highs and lows of a period, and %D, which is a moving average of %K. Our version contains color filling, which facilitate
FREE
GridLinesX is a lightweight and efficient utility for MetaTrader 5 designed to help traders visualize price levels with precision. Whether you are a Grid Trader, a Scalper, or simply need to mark psychological price levels, GridLinesX automates the process instantly. Forget about drawing manual horizontal lines one by one. Simply define your High/Low range and the grid step (in points), and the tool will generate a clean, customizable grid overlay on your chart. Key Features: Customizable Range:
FREE

Do you find it difficult to track and manage your open positions across multiple different symbols in MetaTrader 5? Do you need a quick and comprehensive overview of your current market exposure and the performance of each symbol individually? The "Dynamic Exposure Table" indicator is your ideal tool! This indicator displays a clear and detailed table in a separate window below the chart, summarizing all your open positions and intelligently grouping them by symbol, giving you a complete view of
FREE
Mum Genlik Osilatörü Mum Genlik Osilatörü ile piyasa volatilitesi hakkında kristal berraklığında bir bakış açısı kazanın. Bu hafif ve verimli araç, her bir mumun içindeki gerçek enerjiyi size göstermek için basit fiyat analizinin ötesine geçer ve daha bilinçli alım satım kararları vermenize yardımcı olur. Bir piyasanın aktif mi yoksa durgun mu olduğunu tahmin etmek yerine, bu indikatör size her sembol ve her zaman diliminde çalışan hassas, standartlaştırılmış bir volatilite ölçümü sunar.
FREE


Golden Genie MT5 is an automated Forex trading advisor, especially popular among those looking to minimize risks and maximize profits. Let's take a closer look at the features, advantages, and disadvantages of this product.
Only 5 copies at premium price, then the price will increase!
Advantages of the Golden Genie MT5 automated advisor:
Automation : The ability to trade without constantly monitoring the market frees up your time to focus on other important aspects of your business or pe

N/B: All our product purchase comes with our free ‘’DAILY SCALPER EA’’ - bit.ly/4qlFLNh Whatsapp Developer for yours after successful purchase
Eternal Spike Detector Pro - M5 Mastery System
HOW TO TRADE THIS SYSTEM
TRADING RULES
For CRASH 500/900/1000:
SELL SETUP:
· Wait for RED DOWN ARROW to appear · Enter SELL at the close of the M5 candle where arrow appears · Stop Loss: 1.5x ATR above the entry high · Take Profit: 2-3x ATR below entry · Only trade maximum 7 signals per day

The Price Action Finder Multi indicator is an indicator of entry points that searches for and displays Price Action system patterns on dozens of trading instruments and on all standard time frames: (m1, m5, m15, m30, H1, H4, D1, Wk, Mn). The indicator places the found patterns in a table at the bottom of the screen. By clicking on the pattern names in the table, you can move to the chart where this pattern is located. Manual (Be sure to read before purchasing) | Version for MT4 Advantages
1. Pat

“Naturu”, doğanın simetrisini algoritması olarak kullanan bir manuel indikatördür.
Basit bir strateji ve gizli bilgelikle piyasayı fethedin! İndikatörü yüklediğinizde iki çizgi görürsünüz: Üst (Top) ve Alt (Bottom).
Bir çizgiye tıklayarak aktifleştirin. Taşımak için, yerleştirmek istediğiniz mumun üzerine tıklayın. Bir tepe noktası ve bir dip noktası belirlersiniz, indikatör otomatik olarak hesaplar: Boğalar ve ayıların çıkarlarının en yakınlaştığı, destek veya direnç rolü oynaması en muhtemel b

Supertrend Çoklu Döviz EA MT5 , birden fazla döviz çifti ve zaman dilimi üzerinde kapsamlı şekilde test edilmiş sağlam bir sağlam bir Supertrend Gösterge stratejisini uygular. Bu Uzman Danışman (EA), grid (ızgara) toparlanma, hedge (koruma) seçenekleri ve martingale stratejileri (varsayılan olarak devre dışı bırakılmıştır) dahil olmak üzere kapsamlı işlem yetenekleri sunar. Kesin giriş yöntemleri (kırılmalar, dönüşler, trend takibi) ve esnek çıkış kuralları (göstergelere, zamana veya kara dayal

Stokastik Çoklu Döviz EA MT5 , birden fazla döviz çifti ve zaman dilimi üzerinde kapsamlı şekilde test edilmiş sağlam bir çift hareketli ortalama stratejisi uygular. Bu Uzman Danışman (EA), grid (ızgara) toparlanma, hedge (koruma) seçenekleri ve martingale stratejileri (varsayılan olarak devre dışı bırakılmıştır) dahil olmak üzere kapsamlı işlem yetenekleri sunar. Kesin giriş yöntemleri (kırılmalar, dönüşler, trend takibi) ve esnek çıkış kuralları (göstergelere, zamana veya kara dayalı) ile bi
MetaTrader mağazası, MetaTrader platformu için uygulama satın almak adına rahat ve güvenli bir ortam sunar. Strateji Sınayıcıda test etmek için Uzman Danışmanların ve göstergelerin ücretsiz demo sürümlerini doğrudan terminalinizden indirin.
Performanslarını izlemek için uygulamaları farklı modlarda test edin ve MQL5.community ödeme sistemini kullanarak istediğiniz ürün için ödeme yapın.
Alım-satım fırsatlarını kaçırıyorsunuz:
- Ücretsiz alım-satım uygulamaları
- İşlem kopyalama için 8.000'den fazla sinyal
- Finansal piyasaları keşfetmek için ekonomik haberler
Kayıt
Giriş yap
Gizlilik ve Veri Koruma Politikasını ve MQL5.com Kullanım Şartlarını kabul edersiniz
Hesabınız yoksa, lütfen kaydolun
MQL5.com web sitesine giriş yapmak için çerezlerin kullanımına izin vermelisiniz.
Lütfen tarayıcınızda gerekli ayarı etkinleştirin, aksi takdirde giriş yapamazsınız.