YouTubeにあるマーケットチュートリアルビデオをご覧ください
ロボットや指標を購入する
仮想ホスティングで
EAを実行
EAを実行
ロボットや指標を購入前にテストする
マーケットで収入を得る
販売のためにプロダクトをプレゼンテーションする方法
MetaTrader 5のためのテクニカル指標 - 5

このインジケーターは、チャート上に需要と供給のゾーンを描画します。独自のルールやテクニックと組み合わせることで、このインジケーターを使用して独自の強力なシステムを作成 (または強化) できます。さらに多くの機能を提供する 有料版 もぜひご確認ください。私の推奨は、少なくとも 25 バー後に最初のゾーン テストが発生する取引機会を探すことです。 特徴 ゾーンには 3 つの色があります (入力によって調整可能)。テストされていないゾーンは暗い色、テスト済みのゾーンは中くらいの色 、壊れたゾーンは明るい色です 。 各ゾーンにはゾーン外枠の価格とゾーンテストの金額が記載されています。 入力パラメータ 最初の極値を検索するための最大バックバー数 - デフォルトは 3000 です。最初の極値を xx バー分遡って検索します。値が大きいほど、より多くのシステム リソースが必要になります 。遅いコンピューターの場合は、500 ~ 1000 の値が適している場合があります。 ゾーンテスト間のキャンドルの最小数 未テストの需要色 テスト済みの需要色 壊れた需要の色 未テスト供給色 テスト済みの供給
FREE

初心者やエキスパートトレーダーに最適なソリューション!
このインジケーターは、独自の機能と新しい計算式を取り入れた、ユニークで高品質、かつ手頃な価格のトレーディングツールです。たった1枚のチャートで28の為替ペアの通貨強度を読み取ることができます。新しいトレンドやスキャルピングチャンスの引き金となるポイントを正確に特定することができるので、あなたのトレードがどのように改善されるか想像してみてください。
ユーザーマニュアルはこちら https://www.mql5.com/en/blogs/post/697384
これが最初の1本、オリジナルだ! 価値のないクローンを買わないでください。
特別な サブウィンドウの矢印で強い通貨の勢いを表示 GAPがあなたのトレードを導く! 基準通貨や気配値が売られすぎ・買われすぎのゾーン(外相フィボナッチレベル)にあるとき、個別チャートのメインウィンドウに警告表示。 通貨がレンジの外側から反落した場合、プルバック/リバーサルのアラート。 クロスパターンの特別なアラート
複数の時間枠を選択可能で、トレンドを素早く確認できます。通貨強度のライン

The Supertrend indicator was originally created by a french fellow named Olivier Seban , and its goal is to identify the Primary Trend of prices . Its calculation is easy and based on the average of Highs and Lows and then we add the volatility of a custom period, plus a multiplier. This way we get the Supertrend Line. You can find in the web several approaches and trading strategies using this very useful indicator.
HOW TO "READ" THIS INDICATOR
If the closing prices are above Supertrend Line,
FREE

Auto Fibo は、手動での取引を強化するために開発されたインジケーターです。自動で黄金比を描き、時間を節約し、取引を円滑にします。 グラフにインジケータを取り付けると、自動的に正確な黄金比が描かれるので、臨界点を探す手間が省けます。 インターフェイスは、お使いのコンピュータに応じて、バンドのおおよそのハイポイントとローポイントに調整されます。 このインジケータは、ほとんどの始点と終点の選択ミスを修正します。 各バンドには、正確な価格が表示されます。 警告 私はMQL5.comで私のEAを販売するだけです。もし誰かが私のEAを売ってくれと連絡してきたら、それはあなたのお金が欲しいだけの詐欺師です。
また、もしあなたが私のEAを外部のウェブサイトから購入した場合、それは偽のバージョンであり、オリジナルのものと同じようには動作しないことを保証します。
FREE

This indicator obeys the popular maxim that: "THE TREND IS YOUR FRIEND" It paints a GREEN line for BUY and also paints a RED line for SELL. (you can change the colors). It gives alarms and alerts of all kinds. IT DOES NOT REPAINT and can be used for all currency pairs and timeframes. Yes, as easy and simple as that. Even a newbie can use it to make great and reliable trades. NB: For best results, get my other premium indicators for more powerful and reliable signals. Get them here: https://www.m
FREE

N/B: All our product purchase comes with our free ‘’DAILY SCALPER EA’’ - bit.ly/4qlFLNh Whatsapp Developer for yours after successful purchase SUPREME PRECISION TRADER SCANNER
Your All-in-One Market Scanner for High-Probability Trades Across All Timeframes (M5–H4)
---
WHY THIS SCANNER IS A GAME-CHANGER
Most traders spend hours analyzing charts, hunting for setups, and still miss high-probability trades.
The Supreme Precision Trader Scanner does all the heavy lifting for you — scann

This is the MetaTrader version of the very popular Squeeze Momentum indicator. It is based of of John Carter's TTM Squeeze volatility indicator, as discussed in his book Mastering the Trade. With this version you can enable notifications when a squeeze is released (push notification, email, or pop-up message). Strategie
Grey dots indicates a squeeze in the current timeframe. Blue dots indicates that the squeeze is released. Mr. Carter suggests waiting till the first blue dot after a grey dot an
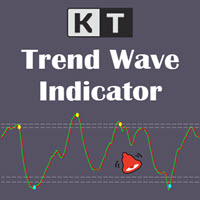
KT Trend Wave is an oscillator based on the combination of Price, Exponential, and Simple moving averages. It usually works great to catch the short term price reversals during the ongoing trending market. The bullish and bearish crossovers of the main and signal lines can be used as buy/sell signals (blue and yellow dot). It can also be used to find the overbought and oversold market. The buy and sell signals that appear within the overbought and oversold region are usually stronger.
Features

KT CCI Divergence shows the regular and hidden divergence created between the price and CCI oscillator. Divergence is one of the vital signals that depicts the upcoming price reversal in the market. Manually spotting the divergence between price and CCI can be a hectic and ambiguous task.
Limitations of KT CCI Divergence
Using the CCI divergence as a standalone entry signal can be risky. Every divergence can't be interpreted as a strong reversal signal. For better results, try to combine it w

40% off. Original price: $50
Advanced Bollinger Bands Scanner is a multi symbol multi timeframe Bollinger bands dashboard that monitors and analyzes the Bollinger Bands indicator from one chart. This panel scans the Bollinger bands indicator in up to 28 configurable instruments and 9 timeframes for price overbought/oversold, price consolidation (Bollinger bands squeeze), and consolidation breakout (squeeze break) with a deep scan feature to scan all market watch symbols (up to 1000 instrument

The Oracleは、複数のインジケーターを管理することなく正確な市場分析を必要とするトレーダーに最適なパートナーです。
ほとんどのインジケーターが単一視点のシグナルを表示する中、The Oracleは科学的に実証された手法と独自の改良を一つのコンセンサスヒストグラムに統合します。 Ehlersスムージングアルゴリズムを搭載したUltimate Flow Index(UFI)を含む7つのモデルが、各バーで独立して投票します。
設定した閾値(4/7アグレッシブから7/7コンサバティブまで)に十分なモデルが一致すると、方向性が明確になります。
主な機能
7モデルコンセンサスシステム - 実績あるインジケーターと独自モデルの組み合わせ - 高度なスムージングを備えたUFI(Ultimate Flow Index)を搭載 - 事前最適化されたパラメーター(設定不要)
設定可能なアラート閾値 - 4/7モデル:アグレッシブ(早期シグナル、ノイズ多め) - 5/7モデル:スタンダード(バランス型) - 6/7モデル:推奨(最適なシグナル/ノイズ比) - 7/7モデル:コンサバティブ
FREE

Also check my premium spikes bot: https://www.mql5.com/en/market/product/142350 Also check my premium spikes bot: https://www.mql5.com/en/market/product/142350 Also check my premium spikes bot: https://www.mql5.com/en/market/product/142350 MEGASPIKES BOOM AND CRASH v1.32 NB: source codes of this indicator are available: PM me: https://t.me/Machofx PLEASE JOIN THE CHANNEL BELOW TO HAVE ACCESS TO ALL PREVIOUS VERSIONS check out Spikes robot
BoomCrash Cheatcode EA : https://www.mql5.com/en/ma
FREE

ATR Progress Control
Trading is all about probability, and if you don't know how much range the price has left today, you're trading blind.
This indicator is your dashboard that answers the most important question before a trade: does it make mathematical sense to enter the market right now? It's a tool for professional volatility analysis that helps filter out false entries and avoid trades when the move is already exhausted.
What's the problem?
Imagine that the average daily movement (ATR
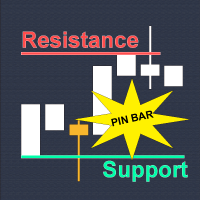
Why Technical Indicators Don't Work?
Many traders lose money because of lagging indicator crossovers and fake breakouts. Indicators are rearview mirrors. They're all just pretty math equations of PAST data. Would you drive forward while staring at your rearview mirror? Absolutely NO. The "Holy Grail" indicator doesn't exist. Price Action Decoding: How Smart Money REALLY Trades?
The market don't care about your indicators, analyze price action instead, e.g. the principles of ICT, SMC, and other

Advanced ideas of the popular MACD indicator: It detects and displays classic and reverse divergences (two methods of detecting divergences). It uses different color to highlight an uptrend and a downtrend. Two methods of determining a trend: а) MACD crosses the 0 level (classic signal); б) MACD crosses its own average (early signal). This is a multi-timeframe indicator: it can display MACD data from other timeframes. Two methods of drawing: classic histogram and line. It generates sound and vis
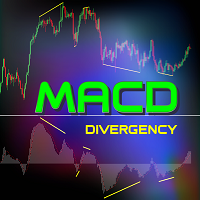
このインジケーターは、価格の動きとMACDヒストグラムの間の強気および弱気のダイバージェンスを正確に識別します。使用する指数移動平均(EMA)の期間は、5(速い)、34(遅い)、および信号線の期間は5です。このインジケーターは、モメンタムが弱まるポイントを強調表示し、トレンドの反転の可能性を示唆します。 正しいダイバージェンスの識別ルール: 強気のダイバージェンスは、価格がより低い安値を形成し、MACDヒストグラムがゼロラインの上で同時により高い安値を形成する場合に有効です。 弱気のダイバージェンスは、価格がより高い高値を形成し、MACDヒストグラムがゼロラインの下で同時により低い高値を形成する場合に有効です。 ヒストグラムの極値と価格の極値がゼロラインの同じ側に一致していない場合、ダイバージェンス信号は無効となります。これは誤った信号を引き起こす可能性があります。 このアプローチは、MACDダイバージェンス分析を適用するための最も正確で信頼性の高い方法です。 インジケーターの特徴: 確認された強気および弱気のダイバージェンスを明確にマークします。 MACDダイバージェンス検証ルール
FREE

VM Trend Candles Indicator - Complete Trend Trading Solution Trend Candles Indicator is a professional, intuitive, and easy-to-use Forex trading system designed to transform complex trend analysis into clear, high-probability trading signals. Based on proven trend-following principles and enhanced with intelligent market filtering, the indicator provides accurate BUY/SELL signals together with automatically calculated Stop Loss and Take Profit levels according to market volatility. The system su

相対力指数 (RSI) インジケーターのマルチ通貨およびマルチタイムフレームの変更。パラメータで任意の通貨とタイムフレームを指定できます。また、パネルは買われすぎレベルと売られすぎレベルを越えたときに通知を送信できます。ピリオドのあるセルをクリックすると、このシンボルとピリオドが開きます。これが MTF スキャナーです。
ダッシュボードをチャートから非表示にするキーは、デフォルトでは「D」です.
通貨強度メーター (CSM) と同様に、ダッシュボードは、指定された通貨を含むペア、またはその通貨を基本通貨とするペアを自動的に選択できます。インジケーターは、「ペアのセット」で指定されたすべてのペアで通貨を検索します。他のペアは無視されます。そして、これらのペアに基づいて、この通貨の合計 RSI が計算されます。そして、その通貨がどれだけ強いか弱いかを確認できます.
パラメータ RSI Period — 平均期間。 RSI Applied price — 価格タイプ。 Clear the chart at startup — 起動時にチャートをクリアします Set of Pairs

Real Trend Zigzag PRO shows the real trend of a market, u nlike the default Zigzag indicator. It calculates the trend in real time and shows green lines for upwards trends, red lines for downward trends and blue lines for no trends. Regarding the old slogan "the trend is your friend" it helps you to decide if should open a buy or sell position. The PRO version is a multi timeframe zigzag (MTF). Means, it shows the trend of the current timeframe as well as the trend of a higher or lower time.

This indicator shows Fractal Breakout Trendlines and Support and Resistance
The Fractal Ascending Trendline and Fractal Descending Trendline are drawn from the last valid fractals. Breakouts can be taken above or below these trendlines. Horizontal lines are drawn from the Last upper and Last lower fractal to show support and resistance levels. Horizontal Upper and Lower Intersection lines are drawn where a fractal trendline has been last intersected, to show where to place a buy or sell order
FREE

FREE Heiken Ashi Smoothed indicator is fully adjustable, easy to use and comes with possibility to access the indicator via iCustom function so you can use it in your own trading software. Indicator can also pop up alerts when signal changes or send push notifications. For Metatrader 4 version click here: https://www.mql5.com/en/market/product/70824 For detailed information click: >>HERE<< Features
Easy to use Accessible via iCustom Fully adjustable Alerts and Push notifications Possib
FREE

CRUDE OIL BUY/SELL (3 Min) Technical Overview The CRUDE OIL BUY/SELL indicator is designed for short-term traders focusing on crude oil price movements.
It identifies high-probability buying and selling opportunities based on a combination of RSI levels , SMA trend positioning , and candle structure analysis .
This tool is particularly effective on the 3-minute timeframe , providing clear visual signals and alerts for both momentum continuation and potential reversals. How It Works The indicator

EPo-CreW Forex Super ORB-H4 インジケーターへようこそ!
本ガイドでは、市場の最初の4時間のオープニングレンジに基づいて、高確率のトレード機会を特定するためのこの強力なツールの使い方を解説します。
初心者の方から経験豊富なトレーダーまで、このシステムはより高い自信と一貫性を持って取引する手助けとなります。 これはデモ製品です。インストール日から30日後に有効期限が切れます。 NB: M5 タイムフレームに切り替えることを確認してください。このインジケーターを使うのに最適なタイムフレームです。
トレーディング戦略
戦略1:ブレイクアウト & リトレースメント(メイン)
SELL(売り)セットアップ:
価格が青いラインを上にブレイクする(高値ブレイク)
ゴールドの BREAKOUT 矢印が表示される
価格が再び青いラインの下でクローズするのを待つ
赤い SELL 矢印が表示される(押し戻しエントリー)
表示された価格で SELL エントリー
SL は赤い点(レンジ高値の上)
TP は青い点(TP1、TP2、TP3)
BUY(買い)セットアップ:
価格が赤いライン
FREE
Indicator Description Range Filter Pro is a sophisticated trading tool for XAUUSD (Gold) that combines adaptive price filtering with volume analysis and real-time market monitoring. Designed for both novice and professional traders, this indicator helps identify trend direction, potential reversals, and significant market movements through its multi-layered approach.
Key Components 1.Dynamic Range Filter 2.Volatility-Adjusted Bands 3.Volume-Enhanced Candles 4.Professional Trading Dashboard 5.M
FREE

VTrende Pro - MTF indicator for trend trading with a display panel for MT5 *** Videos can be translated into any language using subtitles (video language - Russian)
Although the signals of the VTrende Pro indicator can be used as signals of a full-fledged trading system,
it is recommended to use them in conjunction with the Bill Williams TS.
VTrende Pro is an extended version of the VTrende indicator. Difference between Pro version and VTrende:
- Time zones
- Signal V - signal 1-2 waves
- S

インジケーターは現在のシンボルの利益(損失)を表示します。 線を自由にドラッグ&ドロップして現在の損益を表示できます。
You can find my products here
パラメーター
Calculation in money or in points — 損益をポイントまたは金額で計算します。 Add pending orders to calculate — 計算では未決注文を考慮します。 Magic Number (0 - all orders on symbol) — 特定の注文を評価する必要がある場合のマジック ナンバー。 Offset for first drawing (points from the average price) — 最初の開始時の平均価格からのラインのオフセット。 Decimal places for calculating the Sum — 合計を表示するための小数点以下の桁数。 Decimal places for calculating the Percentage — パーセンテージを表示するための小数点以下の桁数。
FREE

Advanced SMC & Volumetric Order Block Indicator Overview
This enhanced-grade for MetaTrader 5 indicator is designed to decode market behavior using Smart Money Concepts (SMC) method . It goes beyond standard price action analysis by integrating Volumetric Data directly into market structure, helping traders identify high-probability reversal and continuation zones with precision. Key Features Volumetric Order Blocks: A unique, split-gauge visualization within Order Block zones that disp
FREE

Step into the world of Forex trading with confidence, clarity, and precision using Gold Indicator a next-generation tool engineered to take your trading performance to the next level. Whether you’re a seasoned professional or just beginning your journey in the currency markets, Gold Indicator equips you with powerful insights and help you trade smarter, not harder. Built on the proven synergy of three advanced indicators, Gold Indicator focuses exclusively on medium and long-term trends elimina

このインジケータは、AB = CDリトレースメントパターンを検出します。 AB = CDリトレースメントパターンは、初期価格セグメントが部分的にリトレースされ、プルバックの完了から等距離の動きが続く4ポイントの価格構造であり、すべての調和パターンの基本的な基盤です。 [ インストールガイド | 更新ガイド | トラブルシューティング | よくある質問 | すべての製品 ]
カスタマイズ可能なパターンサイズ
カスタマイズ可能なACおよびBD比率 カスタマイズ可能なブレイクアウト期間 カスタマイズ可能な線、色、サイズ CD fiboレベルに基づいてSLおよびTPレベルを表示します パターンとブレイクアウトの視覚/音声/プッシュ/メールアラート
AB = CDリトレースメントは、かなり拡大して再描画できます。物事を簡単にするために、このインディケーターはひねりを実装します。トレードをシグナルする前に、正しい方向へのドンチャンブレイクアウトを待ちます。最終結果は、非常に信頼性の高い取引シグナルを備えた再描画インジケーターです。ドンチャンのブレイクアウト期間が入力として入力されます。
強

The indicator is intended for recognition and marking 1-2-3 buy and sell patterns on a chart. The indicator will help a trade to determine the starting and signal fractals, and to specify the possible entry points on all timeframes in МetaTrader 5. Fibonacci lines are drawn on the chart to indicate supposed targets of moving on the basis of the wave theory. The 1-2-3 formations appear to be especially important as divergences (convergences) are formed on price tops and bottoms. The indicator has
FREE
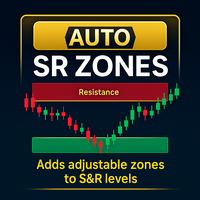
S/Rゾーン - MetaTrader 5向け製品概要 概要 サポート/レジスタンスゾーン は、MetaTrader 5(MT5)向けの直感的なインジケーターで、チャート上の水平線周りにカスタマイズ可能なゾーンを自動的に作成することでテクニカル分析を強化します。これらのゾーンは、ユーザーが指定したピップ数で定義され、主要なサポートとレジスタンスエリアを視覚的に強調し、トレーダーが重要な価格範囲や反転ポイントを迅速に特定するのに役立ちます。 主な特徴 動的ゾーン作成 : 水平線周りにゾーンを自動生成し、ゾーンの幅を調整可能なピップ数(デフォルト:10ピップ)で定義します。 サポートとレジスタンスの識別 : 現在の価格と線との関係に基づいてゾーンを色分け(サポート:ライムグリーン、レジスタンス:トマト)し、視覚的に素早く認識できます。 カスタマイズ可能な外観 : ゾーンの透明度(0~255)、色、サポート/レジスタンスラベルの表示オプション(フォントサイズと色を調整可能)をカスタマイズ可能。 ラインのフィルタリング : ユーザーが定義したプレフィックスで水平線をフィルタリングし、特定の線に
FREE
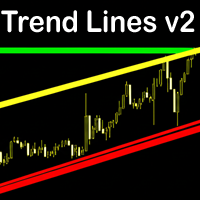
Trend Lines v2 MT5 is an intelligent auto trendline indicator that instantly detects key dynamic support and resistance zones. Built on pivot high/low structure, it delivers a clear and accurate view of market trends across all timeframes. Features Fully automatic trendline drawing based on precise pivot points. Filters out noise – only clean and reliable trendlines are shown. Control the number of lines to keep your chart neat and easy to read. Flexible customization: colors, line thickness, ra
FREE

チャート上にフィボナッチレベルを手動で描画することにうんざりしていませんか?取引における主要なサポートとレジスタンスのレベルを特定する便利で効率的な方法をお探しですか?これ以上探さない! 自動 フィボナッチ レベル を実行する究極の MetaTrader 5 インジケーターである DrawFib Pro の紹介 チャート上に描画し、これらのレベルを突破したときにタイムリーにアラートを提供します。 DrawFib Pro を使用すると、取引戦略を強化し、時間を節約し、より多くの情報に基づいた意思決定を行うことができます。 私のフィボナッチベースのインジケーター: Advanced Gartley Pattern MT5 || Price Wave Pattern MT5 主な特徴:
自動 フィボナッチ描画. カスタマイズ可能な パラメータ . 正確 で 信頼性. リアルタイム アラート. ユーザー フレンドリーな インターフェイス . DrawFib Pro は、チャート上でフィボナッチを自動描画するための効率的で信頼性が高く、使いやすい方法を求めるトレーダーにとって必
FREE

The Clean Trading Sessions indicator shows the most significant trading sessions for the Forex market, such as London, New York, Tokyo. The Clean Trading Sessions indicator is a simple and, at the same time, quite functional Forex sessions indicator, developed for the MT5 terminal. It is available to download for free.
How is this Forex market session indicator used? Traders normally use trading sessions to determine the volatile hours throughout the day, since the trading activities vary
FREE

Range Explosionについて Range Explosionは、市場のレンジを検出し、正確なサポートとレジスタンスゾーンを描画し、ブレイクアウトの機会を正確かつスタイリッシュに特定するための、強力で無料の取引ツールです。
Break Out Explosionプロジェクトの一部として、初心者からプロフェッショナルトレーダーまで信頼できる高度なビジュアルソリューションを提供します。 ブレイクアウト取引の概念に興味がある場合は、主要トレンド方向のトレンドラインブレイクアウトを検出するための高度なツールをご覧ください:
https://www.mql5.com/en/market/product/152676 このインジケーターの矢印に基づいて取引を行うEAが欲しいですか? 下のリンクから $30 で直接ジョブを作成すれば、私が作成いたします:
https://www.mql5.com/en/job/new?prefered=eeecad 最新ニュースやBreak Out Explosionプロジェクトの開発情報を入手するには、こちらのチャンネルに参加してください:
https:
FREE
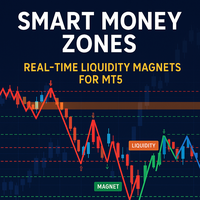
Developed according to the principles of smart money management strategies, the SM Zones indicator is a very convenient tool for traders on the MetaTrader 5 (MT5) platform. It graphically displays on the chart all the significant zones used in the SM strategy: market structure, price levels of increased liquidity, "price magnet" zones - imbalances, order blocks, fvg, breaker blocks and mitigation blocks - towards which the instrument's price moves. The zones influencing the bull market are high
FREE

ピボットポイントフィボRSJは、フィボナッチレートを使用してその日のサポートラインとレジスタンスラインを追跡するインジケーターです。
この壮大な指標は、フィボナッチレートを使用してピボットポイントを通じて最大7レベルのサポートとレジスタンスを作成します。 価格がこのサポートとレジスタンスの各レベルを尊重する方法は素晴らしいです。そこでは、オペレーションの可能な入口/出口ポイントを認識することができます。
特徴 最大7レベルのサポートと7レベルの抵抗 レベルの色を個別に設定します
入力 ピボットタイプ ピボットフィボRSJ1 =フィボ比1の計算 ピボットフィボRSJ2 =フィボ比2の計算 ピボットフィボRSJ3 =フィボ比3の計算 ピボットフィボクラシック=クラシックピボット計算 最小ピボットレベル ピボット3レベル ピボット4レベル ピボット5レベル ピボット6レベル ピボット7レベル
それでも質問がある場合は、ダイレクトメッセージで私に連絡してください: https://www.mql5.com/ja/users/robsjunqueira/
FREE

ロシア語の説明書 / 英語の 説明書 / MT4バージョン 主な機能: 売り手と買い手のアクティブなゾーンを表示します。 このインジケーターは、買いと売りの適切な最初のインパルスレベル/ゾーンをすべて表示します。これらのレベル/ゾーンがアクティブになると、エントリーポイントの探索が始まり、レベルの色が変わり、特定の色で塗りつぶされます。状況をより直感的に把握できるように、矢印も表示されます。 LOGIC AI - テンプレートをアクティブ化するときにエントリポイントを検索するためのゾーン(円)の表示 視認性を向上させるため、人工知能を用いて進入ポイントを探索したゾーンを表示する機能が追加されました。 より高い時間枠からのレベル/ゾーンの表示(MTFモード) より長い時間間隔でレベル/ゾーンを表示する機能を追加しました。また、インジケーターに自動トレンド検出機能( TPSproTREND PRO )を実装しました。 取引のための個別の専門的なステップバイステップのアルゴリズム このアルゴリズムは、トレンドの方向と逆方向の両方でデイトレードを行うために設計されています。有効な

The indicator works to convert normal volume into levels and determine financial liquidity control points.
It is very similar in function to Fixed Volume Profile.
But it is considered more accurate and easier to use than the one found on Trading View because it calculates the full trading volumes in each candle and in all the brokers present in MetaTrade, unlike what is found in Trading View, as it only measures the broker’s displayed prices.
To follow us on social media platforms:
telegram
FREE

Free automatic Fibonacci is an indicator that automatically plots a Fibonacci retracement based on the number of bars you select on the BarsToScan setting in the indicator. The Fibonacci is automatically updated in real time as new highest and lowest values appears amongst the selected bars. You can select which level values to be displayed in the indicator settings. You can also select the color of the levels thus enabling the trader to be able to attach the indicator several times with differe
FREE
Haven Trend Tracker PRO - トレンドの世界のナビゲーター ご紹介します Haven Trend Tracker PRO – 市場と調和して取引したいトレーダーのために作られた、強力なマルチタイムフレームインジケーターです。その主な目的は、あなたのワーキングタイムフレーム(LTF)と上位タイムフレーム(HTF)の両方でトレンドの方向性を同時に示すことで、あなたの疑問を解消することです。 私の他の製品 -> こちら . トレンドに従った取引は、最も信頼性の高い戦略です。このインジケーターは、市場の支配的な力を特定し、ローカルとグローバルのトレンドが一致したときに最適なエントリーポイントを見つけるのに役立ち、成功の確率を大幅に高めます。 重要なアイデア – 2つのタイムフレームの力 LTF (Lower Timeframe / 下位タイムフレーム) – これは現在のチャートのトレンドです。細い点線と矢印で表示され、短期的な価格の動きを示します。正確なエントリーポイントを見つけるのに最適です。 HTF (Higher Timeframe / 上位タイムフ
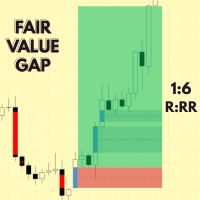
Development of this product will be discontinued. new product can be downloaded from this link. https://www.mql5.com/en/market/product/131881?source=Site+Market+My+Products+Page
Smart FVG (MT5) — Fair Value Gap Visualizer Summary
Detect and visualize Fair Value Gaps (FVGs) with ATR-aware sensitivity and optional alerts. What it does
Smart FVG identifies price ranges not overlapped by adjacent candles (FVGs) and displays them on the chart as bullish/bearish zones. Shading and colors are confi
FREE
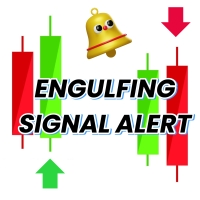
Engulfing Candle Signal Alert: Elevate Your Trading Strategy Unlock the full potential of your trading with the Engulfing Candle Signal Alert, the ultimate tool for identifying market reversals and enhancing your trading precision. Designed specifically for traders who value accuracy and timely alerts, this powerful indicator detects engulfing candle patterns, a key signal in technical analysis that often indicates a potential shift in market direction. What is an Engulfing Candle? An engu
FREE

Do you know VWAP Bands? It is an indicator used to identify support and resistance points from the daily VWAP and you can use it to check the best entry and exit points. This indicator does not use the principle of bollinger bands. There is a difference in the calculation method. Use it according to your strategy. See the applications and what results you can get. The indicator is free and can be used on any account.
FREE
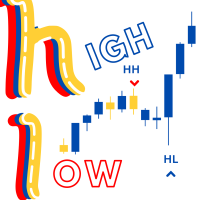
Swing High/Low Identifier Swing High/Low Identifier は、MetaTrader 5 (MT5)用に設計されたカスタムインディケータで、チャート上の重要なスイングポイントを強調表示します。このインディケータは、設定可能なバー範囲に基づいてスイングハイとスイングローを識別してマークします。 スイングハイは、対応するキャンドルの上に赤い矢印でマークされます。 スイングローは、対応するキャンドルの下に青い矢印でマークされます。 このツールは、トレーダーが重要な価格レベルやパターンを迅速に見つけるのに役立ち、情報に基づいた取引決定を行う上で重要です。 有効な戦略 トレンド転換の識別: スイングハイは、下降トレンドが始まる可能性のある抵抗レベルを示すことがあります。 スイングローは、上昇トレンドが始まる可能性のある支持レベルを示すことがあります。 サポートとレジスタンスの分析: マークされたスイングハイとスイングローを使用して、重要なサポートおよびレジスタンスレベルとして機能する水平線やチャネルを描画します。 プライスアクショントレード: インディ
FREE

Breakthrough Solution For Trend Trading And Filtering With All Important Features Built Inside One Tool! Trend PRO's smart algorithm detects the trend, filters out market noise and gives entry signals with exit levels. The new features with enhanced rules for statistical calculation improved the overall performance of this indicator.
Important Information Revealed Maximize the potential of Trend Pro, please visit www.mql5.com/en/blogs/post/713938
The Powerful Expert Advisor Version
Automatin
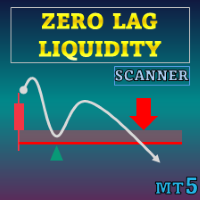
特別オファー : ALL TOOLS 、各 $35 ! 新ツール は 最初の1週間 または 最初の3回の購入 まで $30 ! MQL5 の Trading Tools チャンネル :最新情報を受け取るため、私の MQL5 チャンネルに参加してください Zero Lag Liquidity は、下位タイムフレームのヒゲプロファイルと高出来高のヒゲから流動性ゾーンを描画します。各異常ローソク足に対して、インジケーターはヒゲ内の出来高ヒストグラムを構築し、ローカルのポイント・オブ・コントロール(POC)を見つけ、その価格をレベルとして描画します。以降の価格の反応に基づき、ラベル、ブレイクシグナル、およびシンプルなトレンド状態をトリガーします。
MT5 版はこちら: Zero Lag Liquidity MT5 Scanner MT4 版はこちら: Zero Lag Liquidity MT4 Scanner その他の製品はこちら: All P roducts 概念 高出来高の長いヒゲ:上ヒゲ/下ヒゲが異常に長く出来高スパイクを伴うローソク足を、対向流動性イ

キャンドルカウンター このインジケーターはキャンドルをカウントし、 より長い時間枠に基づいてキャンドルの画面に数字を表示します 。 長期間 毎日の時間枠を「 BIgger Timeframe 」として選択し、時間枠が短い任意のグラフ内で実行できます。カウンターは 日足チャート に基づいてバーをカウントします。 時間枠「 H1 」をパラメーターとして渡すと、インジケーターはH1チャート内のバーをカウントする方法を認識します。これは、時間枠が短いチャートで実行する必要があります。 主なパラメータは「 大きい時間枠 」です。これは、使用している時間枠よりも長い時間枠であり、キャンドルカウントの基準となります。 番号を表示 このパラメーターに加えて、数字を表示するかどうかを指定するパラメーターがあります。画面の中央に数字を表示する必要はないため、 CTRL+D を押すとカウントを表示できます。 およびインジケーター「 BarIn(時間枠) 」を監視します。 マウス この領域は、画面上で マウスを動かす ときにも非常に便利です。そのため、マウスカーソルが通過している正確なバーを確認できます。画像
FREE

This is the latest iteration of my famous indicator, Reversal Fractals, published for the first time almost a decade ago. It examines the price structure of fractals to determine possible reversal points in the market, providing timing to positional traders that already have a fundamental or technical valuation model. [ Installation Guide | Update Guide | Troubleshooting | FAQ | All Products ] Reversal fractals can start long trends The indicator is non repainting
It implements alerts of all ki
FREE

Ultimate SMC: Professional Smart Money Concepts Indicator Unlock the hidden movements of the market. Trade with the institutions, not against them. The Ultimate SMC indicator is designed for serious traders who want to apply Smart Money Concepts (SMC) to their charts automatically. Manual SMC analysis is time-consuming and prone to subjective error. This tool removes the guesswork by algorithmically detecting Order Blocks, Fair Value Gaps, and Structural breaks in real-time. Whether you are a s
FREE

このインディケータは ペナントを 見つけます。 ペナント は、価格統合期間を囲む収束トレンドラインによって識別される継続パターンです。トレードは、フォーメーションのブレイクアウトとともにブレイクアウト期間を使用して通知されます。 [ インストールガイド | 更新ガイド | トラブルシューティング | よくある質問 | すべての製品 ] 使いやすい カスタマイズ可能な色とサイズ ブレイクアウト信号を実装します あらゆる種類のアラートを実装します
最適な使用法 オーバーラップする可能性があるすべてのサイズのペナントを表示するには、6、12、18、24などの異なるサイズでチャートにインジケーターを数回ロードします。
入力パラメータ サイズ:検出されるパターンのサイズ。代替ポイント間のバーとして表されます ブレイクアウト期間:ブレイクアウト信号のドンチャン期間
最大履歴バー:チャートで調べる過去のバーの量 強気パターンの色:このパラメーターは一目瞭然です 弱気パターンの色:このパラメーターは一目瞭然です 切れ目のないパターンの色:このパラメーターは一目瞭然です 線幅:パターン線のサイズ

Haven Bar Replay — あなた専用のトレード練習シミュレーター ご紹介します。 Haven Bar Replay は、裁量トレードの練習や戦略テストのためのプロフェッショナルなシミュレーターです。MT5チャートを「過去検証プレイヤー」に変え、数ヶ月分の市場の動きをわずか数分で体験できます。 私の他の製品をチェック -> こちらをクリック 。 利益を出せるトレーダーになりたいけれど、セットアップが形成されるのを何時間も待ちたくないですか?このツールはそんなあなたのためのものです。リアルタイム市場と同じように、過去データを使って相場観を養い、仮説を検証し、スキルを磨きましょう。 なぜ Haven Bar Replay がトレーダーに不可欠なのか? 「チャートの右端」効果
インジケーターは「未来(本物のローソク足)」を完全に隠し、シミュレーション部分のみを表示します。先の動きをカンニングすることなく、正直に判断を下せます。 時間の完全なコントロール
退屈なレンジ相場は早送りし、重要なニュースの場面ではスロー再生。レートの進む速度を完全にコントロールできます。 ス
FREE

常に利益を出し続ける5つ星FXトレーダーになりたいですか? 購入時のスクリーンショットを送信して、専用トレーディングチャットへの個人的な招待を受ける
FXトレンド は、すべての時間枠のトレンド方向、期間、強度、その結果のトレンド評価をリアルタイムで表示します。
トレンドがどの方向に動いているか、どのくらい続いているか、どのくらい強力かが一目瞭然です。
これらにより初心者、上級者およびプロのトレーダーにとって使いやすいトレンド取引システムとなって います 。
分析機能 全時間軸のリアルタイムトレンド分析 すべてのタイムフレームで同一の計算結果 時間枠を個別に設定することが可能 トレンドの計算パラメータをカスタマイズ可能 グラフィック機能 コンパクトモード、詳細モード、ダッシュボードモードをワンクリックで切り替え可能 コンパクトモードでは、基本的なトレンド情報を縮小パネルで表示します。 詳細モードでは、基礎となるシンボルの詳細なトレンド分析が可能です。 ダッシュボードモードは、すべてのメジャー銘柄やお気に入りの取引銘柄をカバーします。 パネル内でワンクリックするだけで、すべての時間枠

The Breakout Finder (BF) is a powerful MetaTrader 5 indicator designed to detect potential breakout and breakdown opportunities in price action. By analyzing pivot highs and lows over a user-defined period, it identifies consolidation zones where price has repeatedly tested resistance or support levels within a narrow channel. When price breaks out of these zones with sufficient confirmation (based on the minimum number of tests and channel width threshold), the indicator visually highlights th
FREE

Overview The Smart Money Structure Markup Indicator for MetaTrader 5 is a powerful tool designed to help traders identify key market structures based on popular Smart Money Concepts (SMC) strategies. This indicator detects micro-market structures, providing insights into price movements and potential trend changes. It highlights important elements such as valid Break of Structure (BOS), Change of Character (CHoCH), and Inducement (IDM), helping traders to make informed decisions. Key Features Ma
FREE

Special offer : ALL TOOLS , just $35 each! New tools will be $30 for the first week or the first 3 purchases ! Trading Tools Channel on MQL5 : Join my MQL5 channel to update the latest news from me SMC は、流動性ゾーン、機関注文の配置、そして市場の主要な転換点を特定するためのトレーディングアプローチです。SMCの原則を活用することで、トレーダーは市場をより効果的にナビゲートし、最適なエントリーとエグジットを見つけることができます。 SMC System インジケーターはこれらの概念を自動化し、以下のような重要なプライスアクション要素でチャートをすばやくマークすることを可能にします: リアルタイムの市場構造 (内部構造およびスイング構造のBOS / CHoCH) オーダーブロック (強気および弱気) プレミアムゾーンとディスカウントゾーン イコールハイとイ

EXTREME POI Indicator Join the telegram community for an exciting trading journey. https://t.me/automated_TLabs Professional Trading Indicator for MetaTrader 5/Metatrader 4
EXTREME POI is an advanced institutional-grade trading indicator designed to identify high-probability Points of Interest (POI) based on Smart Money Concepts. The indicator combines multiple sophisticated techniques to detect areas where institutional traders are likely to enter the market.
Working Pairs GOLD, EURUSD,
FREE

The SMC Market Structure indicator tracks key price action shifts using Smart Money Concepts (SMC), helping traders identify institutional behavior and overall trend direction.
It automatically detects and displays: Break of Structure (BOS) – Signals continuation of trend Change of Character (CHOCH) – Indicates potential reversal Swing Highs and Lows – Used to define market structure and directional bias
Each structural event is clearly marked on the chart, allowing traders to visualize momentu
FREE

シンボル: USDCHF、USDJPY、XAUUSD、GBPUSD、EURUSD、AUDUSD、GBPJPY( 私は USDCHF_H1 が大好きです )
時間足: M15, H1, H4, D1
主な特徴: リペイントなし、遅延なし、方向性シグナル、複数の確認
安全性: シグナルにはストップロス、テイクプロフィットが含まれ、リスクリワード比を遵守
含まれるもの: 無料のマルチタイムフレーム・スキャナー(本製品を購入後、プライベートメッセージでスクリーンショットを送ってください。私が直接スキャナーファイルをお送りします。)
完全なトレーディングシステムのコンセプト: 記事を読む (この記事で完全なコンセプトが説明されています) 製品はバージョン 1.5 にアップグレードされました (私は毎日ライブ口座で手動取引を行い、このインジケーターを継続的に改善しています) Break Out Explosion の MT4 バージョンが利用可能です: https://www.mql5.com/en/market/product/155132 1000ドル口座でのリアルトレードを公開してい

RiskKILLER_AI Navigatorは、AIベースのマルチタイムフレーム市場方向性&戦略アシスタントです。 トレーディングのパフォーマンスは、プロのように市場を理解することにかかっています。それを実現するのが、 RiskKILLER_AI Navigator です: MQL5の 外部 で動作するAI駆動のトレンド、センチメント、マクロ分析により、あなたのトレードスタイルに合わせた機関レベルの洞察を得られます。 購入後、ユーザーマニュアルを入手するには:1. マニュアルを要求する コメント を投稿 2. 私に ダイレクトメッセージ を送信してください。 [ 専用グループ | バージョン MT5 - MT4 ]
核心的な利点 複数のタイムフレームと資産にわたるリアルタイムの市場方向性 マクロ指標、ニュース、センチメントのAI駆動分析 あなたのトレードスタイル(手動または自動)に基づいた tailored なアドバイス RiskKILLER_AI エキスパートアドバイザー (EA) との直接的な相乗効果
主な機能 AI駆動グローバルトレンドダッシュボード - 主要通貨ペアとBT
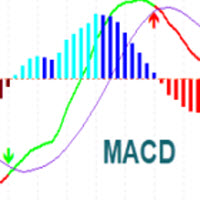
MACD Indicator It has MACD line, Signal line, and Histogram. The Histogram has 4 colors based on Direction Above and Below the Zero Line, showing its movement direction as simple as possible. Allows Show MACD & Signal Line, Show Change In color of MACD Line based on cross of Signal Line. Show Dots at Cross of MacD and Signal Line, Turn on and off Histogram. Enjoy your trading experience, and feel free to share your comments and reviews.
If you are interested in this indicator, you might be i
FREE

Advanced Stochastic Scalper MT5 is a professional indicator based on the popular Stochastic Oscillator. Advanced Stochastic Scalper is an oscillator with dynamic overbought and oversold levels, while in the standard Stochastic Oscillator, these levels are static and do not change. This allows Advanced Stochastic Scalper to adapt to the ever-changing market. When a buy or a sell signal appears, an arrow is drawn on the chart and an alert is triggered allowing you to open a position in a timely ma
This indicator has been developed as an analytical tool based on exponential moving averages (EMA) . Its purpose is to provide additional insights into market dynamics using two exponential moving averages (EMA) and one smoothed exponential moving average (SMMA) . The indicator can be applied to different financial instruments and timeframes, depending on user preferences. Some traders use it on 30-second charts , complementing it with a 2-minute chart . How the Indicator Works The analysis is b
FREE

人気のある「スーパートレンド」インジケーターは、金融市場でのトレンドの方向と可能なエントリーポイントまたはエグジットポイントを特定するのに役立つテクニカル分析ツールです。このインジケーターは、価格の範囲に基づいて市場のボラティリティを測定する平均真のレンジ(ATR)に基づいています。他のプラットフォームでは無料で提供されており、ここでも同様です! 一般的に次の3つの方法で使用されます: 現在のトレンドの特定:価格がこのラインの上にある場合、上昇トレンドと見なされ、価格が下にある場合は下降トレンドと見なされます。 ストップロスレベルとして使用されます。 ダイナミックなサポート/レジスタンスとして:上昇トレンドでは、このラインは価格の下にあり、ダイナミックなサポートレベルとして機能します。下降トレンドでは、このラインは価格の上にあり、ダイナミックなレジスタンスレベルとして機能します。
FREE

Smart Structure Concepts MT5 is an all-in-one Smart Money Concepts indicator created to help traders visually read institutional structure and understand why each movement occurs. Unlike most indicators on the Market, this system does not only draw patterns or zones. It teaches.
Every visual element (BOS, CHoCH, OB, FVG, EQH, EQL, PDH, PDL, etc.) includes educational tooltips that explain the concept and the suggested trader action (buy, sell, or wait).
These on-chart explanations make it perfe
FREE

Candle Time CountDown By BokaroTraderFx The Candle Timer Countdown Indicator is a versatile tool designed for the MetaTrader 5 (MT5) trading platform. It provides traders with a visual countdown of the remaining time for the current candle on a chart. The key features include:
Customizable Position: Place the countdown timer in any corner of the chart for optimal visibility. Default Text Color: Set to red for clear visibility, with options for further customization. Minimal Display: Shows only
FREE

Quantum平均足PRO のご紹介 市場のトレンドに対する明確な洞察を提供するように設計された平均足キャンドルは、ノイズを除去し、誤ったシグナルを排除する能力で知られています。混乱を招く価格変動に別れを告げ、よりスムーズで信頼性の高いチャート表現を導入しましょう。 Quantum Heiken Ashi PRO を真にユニークなものにしているのは、従来のローソク足データを読みやすい色のバーに変換する革新的なフォーミュラです。赤と緑のバーはそれぞれ弱気トレンドと強気トレンドをエレガントに強調し、潜在的なエントリーポイントとエグジットポイントを驚くほど正確に見つけることができます。
量子EAチャネル: ここをクリック
MT4のバージョン: ここをクリック
この注目すべき指標には、いくつかの重要な利点があります。 明確性の向上: 価格変動を平滑化することで、平均足バーは市場トレンドをより明確に表現し、有利な取引機会を特定しやすくします。 ノイズの削減: 誤ったシグナルを引き起こすことが多い不安定な価格変動に別れを告げます。 Quantum Heiken As

Hull Moving Average (HMA) is well-deservedly popular among traders because of the effective averaging of market noise and a relatively small delay. The current MetaTrader 5 version changes its color when the movement direction changes. Sound and text signals are available. It also supports sending email and push messages. It is possible to trigger a signal on the current incomplete bar, although such a signal may be canceled before completion if conditions are no longer appropriate. One of the p
FREE

VM Heiken Ashi Pro
ノイズを除去し明確な BUY/SELL シグナルを生成するための平滑化された Heiken-Ashi(HMA または EMA)。非リペイント(オプション ConfirmOnClosedBar)。チャート上に HA ローソクを表示(元のローソクは非表示可)、矢印の配置は ATR または固定オフセットによる。アラートを送信(popup、email、push)し、アンチスパム処理を行います。 主な目的
生のローソク足を平滑化された Heiken-Ashi に変換し、色の変化(ベアからブルへ / ブルからベアへ)を検出してエントリー用の矢印を描画します。ConfirmOnClosedBar オプションはシグナルのリペイントを避けるためにローソクのクローズを待つことを可能にします。UseATRForArrowOffset は矢印の表示をより自然にします。軽量で多くのチャート上で安定しています。 簡単な使用方法
インジケーターをアタッチし、Smoothing Method と Smoothing Period(デフォルト 50)を選択します。リペイント

MACD divergence indicator finds divergences between price chart and MACD indicator and informs you with alerts (popup, mobile notification or email) . Its main use is to find trend reversals in the chart. Always use the divergence indicators with other technical assets like support resistance zones, candlestick patterns and price action to have a higher possibility to find trend reversals. Three confirmation type for MACD divergences: MACD line cross zero level Price returns to previous H/L Crea
FREE
MetaTraderマーケットは、履歴データを使ったテストと最適化のための無料のデモ自動売買ロボットをダウンロードできる唯一のストアです。
アプリ概要と他のカスタマーからのレビューをご覧になり、ターミナルにダウンロードし、購入する前に自動売買ロボットをテストしてください。完全に無料でアプリをテストできるのはMetaTraderマーケットだけです。
取引の機会を逃しています。
- 無料取引アプリ
- 8千を超えるシグナルをコピー
- 金融ニュースで金融マーケットを探索
新規登録
ログイン