Guarda i video tutorial del Market su YouTube
Come acquistare un Robot di Trading o un indicatore
Esegui il tuo EA
hosting virtuale
hosting virtuale
Prova un indicatore/robot di trading prima di acquistarlo
Vuoi guadagnare nel Market?
Come presentare un prodotto per venderlo con successo
Indicatori tecnici per MetaTrader 5 - 5

Questo indicatore traccia zone di domanda e offerta sul grafico. In combinazione con le tue regole e tecniche, questo indicatore ti consentirà di creare (o migliorare) il tuo potente sistema. Dai un'occhiata anche alla versione a pagamento che offre molto di più. Il mio consiglio è di cercare opportunità di trading in cui il primo test di zona si verifica dopo almeno 25 barre. Caratteristiche Le zone hanno 3 colori (regolabili tramite input). Colore scuro per la zona non testata, medio per l
FREE

La soluzione migliore per ogni principiante o trader esperto!
Questo indicatore è uno strumento di trading unico, di alta qualità e conveniente perché abbiamo incorporato una serie di caratteristiche proprietarie e una nuova formula. Con un solo grafico è possibile leggere la forza delle valute per 28 coppie Forex! Immaginate come migliorerà il vostro trading perché sarete in grado di individuare l'esatto punto di innesco di una nuova tendenza o di un'opportunità di scalping?
Manuale d'uso:

The Supertrend indicator was originally created by a french fellow named Olivier Seban , and its goal is to identify the Primary Trend of prices . Its calculation is easy and based on the average of Highs and Lows and then we add the volatility of a custom period, plus a multiplier. This way we get the Supertrend Line. You can find in the web several approaches and trading strategies using this very useful indicator.
HOW TO "READ" THIS INDICATOR
If the closing prices are above Supertrend Line,
FREE

Auto Fibo è un indicatore sviluppato per migliorare il vostro trading manuale. Disegna automaticamente il rapporto aureo, facendovi risparmiare tempo e facilitando il vostro trading. Collegando l'indicatore al grafico, questo disegnerà automaticamente l'esatto rapporto aureo, risparmiandovi la fatica di trovare il punto critico. L'interfaccia si regola in base al computer e indica i punti alti e bassi approssimativi della banda. Questo indicatore corregge la maggior parte degli errori di sele
FREE

This indicator obeys the popular maxim that: "THE TREND IS YOUR FRIEND" It paints a GREEN line for BUY and also paints a RED line for SELL. (you can change the colors). It gives alarms and alerts of all kinds. IT DOES NOT REPAINT and can be used for all currency pairs and timeframes. Yes, as easy and simple as that. Even a newbie can use it to make great and reliable trades. NB: For best results, get my other premium indicators for more powerful and reliable signals. Get them here: https://www.m
FREE

N/B: All our product purchase comes with our free ‘’DAILY SCALPER EA’’ - bit.ly/4qlFLNh Whatsapp Developer for yours after successful purchase SUPREME PRECISION TRADER SCANNER
Your All-in-One Market Scanner for High-Probability Trades Across All Timeframes (M5–H4)
---
WHY THIS SCANNER IS A GAME-CHANGER
Most traders spend hours analyzing charts, hunting for setups, and still miss high-probability trades.
The Supreme Precision Trader Scanner does all the heavy lifting for you — scann

This is the MetaTrader version of the very popular Squeeze Momentum indicator. It is based of of John Carter's TTM Squeeze volatility indicator, as discussed in his book Mastering the Trade. With this version you can enable notifications when a squeeze is released (push notification, email, or pop-up message). Strategie
Grey dots indicates a squeeze in the current timeframe. Blue dots indicates that the squeeze is released. Mr. Carter suggests waiting till the first blue dot after a grey dot an
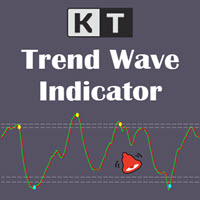
KT Trend Wave is an oscillator based on the combination of Price, Exponential, and Simple moving averages. It usually works great to catch the short term price reversals during the ongoing trending market. The bullish and bearish crossovers of the main and signal lines can be used as buy/sell signals (blue and yellow dot). It can also be used to find the overbought and oversold market. The buy and sell signals that appear within the overbought and oversold region are usually stronger.
Features

KT CCI Divergence shows the regular and hidden divergence created between the price and CCI oscillator. Divergence is one of the vital signals that depicts the upcoming price reversal in the market. Manually spotting the divergence between price and CCI can be a hectic and ambiguous task.
Limitations of KT CCI Divergence
Using the CCI divergence as a standalone entry signal can be risky. Every divergence can't be interpreted as a strong reversal signal. For better results, try to combine it w

40% off. Original price: $50
Advanced Bollinger Bands Scanner is a multi symbol multi timeframe Bollinger bands dashboard that monitors and analyzes the Bollinger Bands indicator from one chart. This panel scans the Bollinger bands indicator in up to 28 configurable instruments and 9 timeframes for price overbought/oversold, price consolidation (Bollinger bands squeeze), and consolidation breakout (squeeze break) with a deep scan feature to scan all market watch symbols (up to 1000 instrument

The Oracle is the perfect companion for traders who need accurate market analysis without managing multiple indicators.
While most indicators show single-perspective signals, The Oracle merges scientifically proven methods with proprietary enhancements into one consensus histogram. Seven models, including our Ultimate Flow Index (UFI) with Ehlers smoothing algorithms, vote independently every bar.
When enough models agree threshold you set from 4/7 aggressive to 7/7 conservative—direction be
FREE

Also check my premium spikes bot: https://www.mql5.com/en/market/product/142350 Also check my premium spikes bot: https://www.mql5.com/en/market/product/142350 Also check my premium spikes bot: https://www.mql5.com/en/market/product/142350 MEGASPIKES BOOM AND CRASH v1.32 NB: source codes of this indicator are available: PM me: https://t.me/Machofx PLEASE JOIN THE CHANNEL BELOW TO HAVE ACCESS TO ALL PREVIOUS VERSIONS check out Spikes robot
BoomCrash Cheatcode EA : https://www.mql5.com/en/ma
FREE

ATR Progress Control
Trading is all about probability, and if you don't know how much range the price has left today, you're trading blind.
This indicator is your dashboard that answers the most important question before a trade: does it make mathematical sense to enter the market right now? It's a tool for professional volatility analysis that helps filter out false entries and avoid trades when the move is already exhausted.
What's the problem?
Imagine that the average daily movement (ATR
Why Technical Indicators Don't Work?
Many traders lose money because of lagging indicator crossovers and fake breakouts. Indicators are rearview mirrors. They're all just pretty math equations of PAST data. Would you drive forward while staring at your rearview mirror? Absolutely NO. The "Holy Grail" indicator doesn't exist. Price Action Decoding: How Smart Money REALLY Trades?
The market don't care about your indicators, analyze price action instead, e.g. the principles of ICT, SMC, and other

Advanced ideas of the popular MACD indicator: It detects and displays classic and reverse divergences (two methods of detecting divergences). It uses different color to highlight an uptrend and a downtrend. Two methods of determining a trend: а) MACD crosses the 0 level (classic signal); б) MACD crosses its own average (early signal). This is a multi-timeframe indicator: it can display MACD data from other timeframes. Two methods of drawing: classic histogram and line. It generates sound and vis
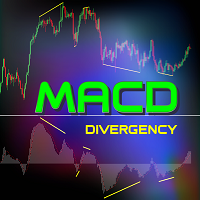
Questo indicatore identifica con precisione le divergenze rialziste e ribassiste tra i movimenti di prezzo e l’istogramma MACD, utilizzando medie mobili esponenziali (EMA) con periodi di 5 (veloce) e 34 (lenta) e una linea di segnale con periodo 5. L’indicatore mette in evidenza i punti in cui il momentum si indebolisce, segnalando possibili inversioni di trend. Regole per la corretta identificazione delle divergenze La divergenza rialzista è valida quando il prezzo forma massimi crescenti e l’i
FREE

VM Trend Candles Indicator - Complete Trend Trading Solution Trend Candles Indicator is a professional, intuitive, and easy-to-use Forex trading system designed to transform complex trend analysis into clear, high-probability trading signals. Based on proven trend-following principles and enhanced with intelligent market filtering, the indicator provides accurate BUY/SELL signals together with automatically calculated Stop Loss and Take Profit levels according to market volatility. The system su

Modifica multivaluta e multitimeframe dell'indicatore Relative Strength Index (RSI). È possibile specificare qualsiasi valuta e intervallo di tempo desiderati nei parametri. Inoltre, il pannello può inviare notifiche quando si attraversano i livelli di ipercomprato e ipervenduto. Cliccando su una cella con un punto, questo simbolo e punto verranno aperti. Questo è lo scanner MTF.
La chiave per nascondere la dashboard dal grafico è "D" per impostazione predefinita.
Similmente al Valuta Strengt

Real Trend Zigzag PRO shows the real trend of a market, u nlike the default Zigzag indicator. It calculates the trend in real time and shows green lines for upwards trends, red lines for downward trends and blue lines for no trends. Regarding the old slogan "the trend is your friend" it helps you to decide if should open a buy or sell position. The PRO version is a multi timeframe zigzag (MTF). Means, it shows the trend of the current timeframe as well as the trend of a higher or lower time.

This indicator shows Fractal Breakout Trendlines and Support and Resistance
The Fractal Ascending Trendline and Fractal Descending Trendline are drawn from the last valid fractals. Breakouts can be taken above or below these trendlines. Horizontal lines are drawn from the Last upper and Last lower fractal to show support and resistance levels. Horizontal Upper and Lower Intersection lines are drawn where a fractal trendline has been last intersected, to show where to place a buy or sell order
FREE
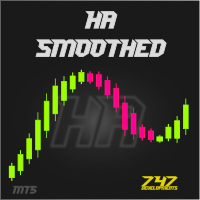
FREE Heiken Ashi Smoothed indicator is fully adjustable, easy to use and comes with possibility to access the indicator via iCustom function so you can use it in your own trading software. Indicator can also pop up alerts when signal changes or send push notifications. For Metatrader 4 version click here: https://www.mql5.com/en/market/product/70824 For detailed information click: >>HERE<< Features
Easy to use Accessible via iCustom Fully adjustable Alerts and Push notifications Possib
FREE

CRUDE OIL BUY/SELL (3 Min) Technical Overview The CRUDE OIL BUY/SELL indicator is designed for short-term traders focusing on crude oil price movements.
It identifies high-probability buying and selling opportunities based on a combination of RSI levels , SMA trend positioning , and candle structure analysis .
This tool is particularly effective on the 3-minute timeframe , providing clear visual signals and alerts for both momentum continuation and potential reversals. How It Works The indicator

Benvenuto nell’indicatore EPo-CreW Forex Super ORB-H4!
Questa guida ti insegnerà come utilizzare questo potente strumento per identificare opportunità di trading ad alta probabilità, basate sulla prima fascia di apertura di 4 ore del mercato.
Che tu sia un principiante o un trader esperto, questo sistema ti aiuterà a fare trading con maggiore sicurezza e coerenza. QUESTO È UN PRODOTTO DEMO. SCADRÀ 30 GIORNI DOPO LA DATA DI INSTALLAZIONE. NB: Assicurati di passare al TIMEFRAME M5. È il miglior ti
FREE
Indicator Description Range Filter Pro is a sophisticated trading tool for XAUUSD (Gold) that combines adaptive price filtering with volume analysis and real-time market monitoring. Designed for both novice and professional traders, this indicator helps identify trend direction, potential reversals, and significant market movements through its multi-layered approach.
Key Components 1.Dynamic Range Filter 2.Volatility-Adjusted Bands 3.Volume-Enhanced Candles 4.Professional Trading Dashboard 5.M
FREE

VTrende Pro - MTF indicator for trend trading with a display panel for MT5 *** Videos can be translated into any language using subtitles (video language - Russian)
Although the signals of the VTrende Pro indicator can be used as signals of a full-fledged trading system,
it is recommended to use them in conjunction with the Bill Williams TS.
VTrende Pro is an extended version of the VTrende indicator. Difference between Pro version and VTrende:
- Time zones
- Signal V - signal 1-2 waves
- S

L'indicatore mostra il profitto (perdita) sul simbolo corrente. Puoi trascinare e rilasciare liberamente la linea per visualizzare il profitto o la perdita corrente.
Puoi trovare i miei prodotti qui
Parametri Calculation in money or in points — calcola il profitto/perdita in punti o denaro. Add pending orders to calculate — prendi in considerazione gli ordini in sospeso nei calcoli. Magic Number (0 - all orders on symbol) — numero magico, se è necessario valutare ordini specifici. Offset f
FREE

Advanced SMC & Volumetric Order Block Indicator Overview
This enhanced-grade for MetaTrader 5 indicator is designed to decode market behavior using Smart Money Concepts (SMC) method . It goes beyond standard price action analysis by integrating Volumetric Data directly into market structure, helping traders identify high-probability reversal and continuation zones with precision. Key Features Volumetric Order Blocks: A unique, split-gauge visualization within Order Block zones that disp
FREE

Step into the world of Forex trading with confidence, clarity, and precision using Gold Indicator a next-generation tool engineered to take your trading performance to the next level. Whether you’re a seasoned professional or just beginning your journey in the currency markets, Gold Indicator equips you with powerful insights and help you trade smarter, not harder. Built on the proven synergy of three advanced indicators, Gold Indicator focuses exclusively on medium and long-term trends elimina

Identify precise entry and exit points with AB=CD patterns
This indicator finds AB=CD retracement patterns. The AB=CD Retracement pattern is a 4-point price structure where the initial price segment is partially retraced and followed by an equidistant move from the completion of the pullback, and is the basic foundation for all harmonic patterns. [ Installation Guide | Update Guide | Troubleshooting | FAQ | All Products ]
Customizable pattern sizes
Customizable AC and BD ratios Customizable b

The indicator is intended for recognition and marking 1-2-3 buy and sell patterns on a chart. The indicator will help a trade to determine the starting and signal fractals, and to specify the possible entry points on all timeframes in МetaTrader 5. Fibonacci lines are drawn on the chart to indicate supposed targets of moving on the basis of the wave theory. The 1-2-3 formations appear to be especially important as divergences (convergences) are formed on price tops and bottoms. The indicator has
FREE
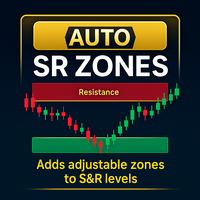
Zona S/R - Panoramica del Prodotto per MetaTrader 5 Panoramica L'indicatore Zona S/R è uno strumento intuitivo per MetaTrader 5 (MT5) che potenzia l'analisi tecnica creando automaticamente zone personalizzabili attorno alle linee orizzontali sul grafico. Queste zone, definite da una distanza in pip specificata dall'utente, evidenziano visivamente le aree chiave di supporto e resistenza, aiutando i trader a identificare rapidamente intervalli di prezzo cruciali e potenziali punti di inversione. C
FREE
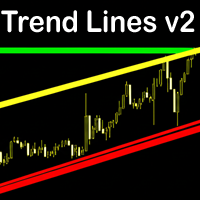
Trend Lines v2 MT5 is an intelligent auto trendline indicator that instantly detects key dynamic support and resistance zones. Built on pivot high/low structure, it delivers a clear and accurate view of market trends across all timeframes. Features Fully automatic trendline drawing based on precise pivot points. Filters out noise – only clean and reliable trendlines are shown. Control the number of lines to keep your chart neat and easy to read. Flexible customization: colors, line thickness, ra
FREE

Sei stanco di disegnare manualmente i livelli di Fibonacci sui tuoi grafici? Stai cercando un modo conveniente ed efficiente per identificare i principali livelli di supporto e resistenza nel tuo trading? Non guardare oltre! Ti presentiamo DrawFib Pro, l'ultimo indicatore MetaTrader 5 che fa i livelli di fibonacci automatici attingendo ai tuoi grafici e fornisce avvisi tempestivi quando questi livelli vengono superati. Con DrawFib Pro puoi migliorare le tue strategie di trading, ri
FREE

The Clean Trading Sessions indicator shows the most significant trading sessions for the Forex market, such as London, New York, Tokyo. The Clean Trading Sessions indicator is a simple and, at the same time, quite functional Forex sessions indicator, developed for the MT5 terminal. It is available to download for free.
How is this Forex market session indicator used? Traders normally use trading sessions to determine the volatile hours throughout the day, since the trading activities vary
FREE
Informazioni su Range Explosion Range Explosion è uno strumento di trading potente e gratuito, progettato per rilevare i range di mercato, disegnare zone di supporto e resistenza precise e identificare opportunità di breakout con precisione.
È parte del progetto Break Out Explosion, offrendo una soluzione affidabile e visivamente avanzata sia per principianti che per trader professionisti. Se sei interessato al concetto di breakout, prova lo strumento avanzato che rileva i breakout delle trendli
FREE
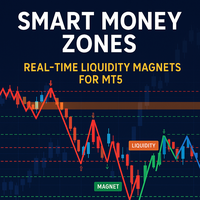
Developed according to the principles of smart money management strategies, the SM Zones indicator is a very convenient tool for traders on the MetaTrader 5 (MT5) platform. It graphically displays on the chart all the significant zones used in the SM strategy: market structure, price levels of increased liquidity, "price magnet" zones - imbalances, order blocks, fvg, breaker blocks and mitigation blocks - towards which the instrument's price moves. The zones influencing the bull market are high
FREE

Pivot Point Fibo RSJ è un indicatore che traccia le linee di supporto e resistenza del giorno utilizzando i tassi di Fibonacci.
Questo spettacolare indicatore crea fino a 7 livelli di supporto e resistenza tramite Pivot Point utilizzando i tassi di Fibonacci. È fantastico come i prezzi rispettino ogni livello di questo supporto e resistenza, dove è possibile percepire possibili punti di entrata/uscita di un'operazione.
Caratteristiche Fino a 7 livelli di supporto e 7 livelli di resistenza Im
FREE

ISTRUZIONI RUS / ISTRUZIONI ENG / Versione MT4 Funzioni principali: Visualizza le zone attive di venditori e acquirenti! L'indicatore mostra tutti i livelli/zone di primo impulso corretti per acquisti e vendite. Quando questi livelli/zone vengono attivati, ovvero dove inizia la ricerca dei punti di ingresso, i livelli cambiano colore e vengono riempiti con colori specifici. Vengono visualizzate anche delle frecce per una percezione più intuitiva della situazione. LOGIC AI - Visualizzazion

The indicator works to convert normal volume into levels and determine financial liquidity control points.
It is very similar in function to Fixed Volume Profile.
But it is considered more accurate and easier to use than the one found on Trading View because it calculates the full trading volumes in each candle and in all the brokers present in MetaTrade, unlike what is found in Trading View, as it only measures the broker’s displayed prices.
To follow us on social media platforms:
telegram
FREE

Free automatic Fibonacci is an indicator that automatically plots a Fibonacci retracement based on the number of bars you select on the BarsToScan setting in the indicator. The Fibonacci is automatically updated in real time as new highest and lowest values appears amongst the selected bars. You can select which level values to be displayed in the indicator settings. You can also select the color of the levels thus enabling the trader to be able to attach the indicator several times with differe
FREE
Haven Trend Tracker PRO - Il tuo navigatore nel mondo dei trend Presentiamo Haven Trend Tracker PRO – un potente indicatore multi-timeframe creato per i trader che vogliono operare in armonia con il mercato. Il suo compito principale è eliminare i tuoi dubbi, mostrando la direzione del trend contemporaneamente sul tuo timeframe di lavoro (LTF) e su quello superiore (HTF). I miei altri prodotti -> QUI . Fare trading seguendo il trend è la strategia più affidabile. L'indicatore aiuta a deter
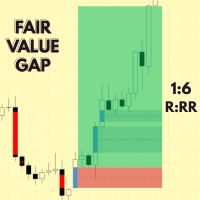
Development of this product will be discontinued. new product can be downloaded from this link. https://www.mql5.com/en/market/product/131881?source=Site+Market+My+Products+Page
Smart FVG (MT5) — Fair Value Gap Visualizer Summary
Detect and visualize Fair Value Gaps (FVGs) with ATR-aware sensitivity and optional alerts. What it does
Smart FVG identifies price ranges not overlapped by adjacent candles (FVGs) and displays them on the chart as bullish/bearish zones. Shading and colors are confi
FREE
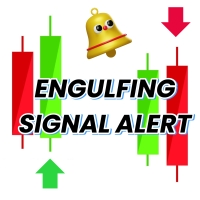
Engulfing Candle Signal Alert: Elevate Your Trading Strategy Unlock the full potential of your trading with the Engulfing Candle Signal Alert, the ultimate tool for identifying market reversals and enhancing your trading precision. Designed specifically for traders who value accuracy and timely alerts, this powerful indicator detects engulfing candle patterns, a key signal in technical analysis that often indicates a potential shift in market direction. What is an Engulfing Candle? An engu
FREE

Do you know VWAP Bands? It is an indicator used to identify support and resistance points from the daily VWAP and you can use it to check the best entry and exit points. This indicator does not use the principle of bollinger bands. There is a difference in the calculation method. Use it according to your strategy. See the applications and what results you can get. The indicator is free and can be used on any account.
FREE
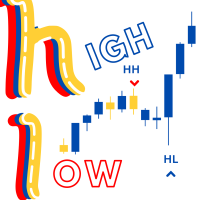
Swing High/Low Identifier
The Swing High/Low Identifier is a custom MetaTrader 5 (MT5) indicator designed to highlight significant swing points on your chart. This indicator identifies and marks swing highs and swing lows based on a configurable range of bars.
- Swing Highs are marked with red arrows above the respective candles. - Swing Lows are marked with blue arrows below the respective candles.
This tool helps traders quickly spot important price levels and patterns, which c
FREE

Breakthrough Solution For Trend Trading And Filtering With All Important Features Built Inside One Tool! Trend PRO's smart algorithm detects the trend, filters out market noise and gives entry signals with exit levels. The new features with enhanced rules for statistical calculation improved the overall performance of this indicator.
Important Information Revealed Maximize the potential of Trend Pro, please visit www.mql5.com/en/blogs/post/713938
The Powerful Expert Advisor Version
Automatin
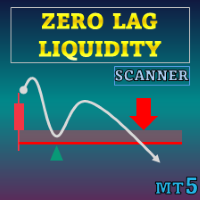
Offerta speciale : ALL TOOLS , solo $35 ciascuno! Nuovi strumenti a $30 per la prima settimana o per i primi 3 acquisti ! Canale Trading Tools su MQL5 : Unisciti al mio canale MQL5 per ricevere le ultime novità Zero Lag Liquidity traccia zone di liquidità dai profili delle ombre su timeframe inferiori e da ombre ad alto volume. Per ogni candela anomala, l’indicatore costruisce un istogramma dei volumi all’interno dell’ombra, trova un Punto di Controllo (POC) locale e rappresenta qu

Contatore di candele Questo indicatore conta le candele e ne mostra i numeri in base a un Lasso di tempo più grande Lasso di tempo più grande Puoi scegliere l'intervallo di tempo giornaliero come " Bigger Timeframe " ed eseguirlo su qualsiasi grafico con l'intervallo di tempo più piccolo. che il contatore conterà le barre secondo il grafico giornaliero . Se passi il periodo di tempo " H1 " come parametro, l'indicatore saprà come contare le barre all'interno del grafico H1, deve solo eseguirlo su
FREE

This is the latest iteration of my famous indicator, Reversal Fractals, published for the first time almost a decade ago. It examines the price structure of fractals to determine possible reversal points in the market, providing timing to positional traders that already have a fundamental or technical valuation model. [ Installation Guide | Update Guide | Troubleshooting | FAQ | All Products ] Reversal fractals can start long trends The indicator is non repainting
It implements alerts of all ki
FREE

Ultimate SMC: Professional Smart Money Concepts Indicator Unlock the hidden movements of the market. Trade with the institutions, not against them. The Ultimate SMC indicator is designed for serious traders who want to apply Smart Money Concepts (SMC) to their charts automatically. Manual SMC analysis is time-consuming and prone to subjective error. This tool removes the guesswork by algorithmically detecting Order Blocks, Fair Value Gaps, and Structural breaks in real-time. Whether you are a s
FREE

Unlock market continuations with the accurate pennants indicator
This indicator finds pennants , which are continuation patterns identified by converging trendlines surrounding a price consolidation period. Trades are signaled using a breakout period alongside the formation breakout. [ Installation Guide | Update Guide | Troubleshooting | FAQ | All Products ] Easy to use Customizable colors and sizes It implements breakout signals It implements alerts of all kinds
Optimal Usage To see pennants

Haven Bar Replay — Il Tuo Simulatore di Trading Personale Ti presentiamo Haven Bar Replay – un simulatore professionale per il trading manuale e il test delle strategie. Questo strumento trasforma il tuo grafico MT5 in un player storico, permettendoti di vivere mesi di movimenti di mercato in pochi minuti. Scopri gli altri miei prodotti -> CLICCA QUI . Vuoi imparare a fare trading con profitto ma non sei disposto ad aspettare ore affinché si formino i setup? Questo strumento è progettato p
FREE
Vuoi diventare un trader forex a 5 stelle costantemente redditizio? 1. Leggi la descrizione di base del nostro semplice sistema di trading e il suo importante aggiornamento della strategia nel 2020 2. Invia uno screenshot del tuo acquisto per ottenere il tuo invito personale alla nostra esclusiva chat di trading
FX Trend mostra la direzione della tendenza, la durata, l'intensità e la valutazione della tendenza risultante per tutti i time frame in tempo reale.
Vedrai a colpo d'occhi

The Breakout Finder (BF) is a powerful MetaTrader 5 indicator designed to detect potential breakout and breakdown opportunities in price action. By analyzing pivot highs and lows over a user-defined period, it identifies consolidation zones where price has repeatedly tested resistance or support levels within a narrow channel. When price breaks out of these zones with sufficient confirmation (based on the minimum number of tests and channel width threshold), the indicator visually highlights th
FREE

Overview The Smart Money Structure Markup Indicator for MetaTrader 5 is a powerful tool designed to help traders identify key market structures based on popular Smart Money Concepts (SMC) strategies. This indicator detects micro-market structures, providing insights into price movements and potential trend changes. It highlights important elements such as valid Break of Structure (BOS), Change of Character (CHoCH), and Inducement (IDM), helping traders to make informed decisions. Key Features Ma
FREE

Special offer : ALL TOOLS , just $35 each! New tools will be $30 for the first week or the first 3 purchases ! Trading Tools Channel on MQL5 : Join my MQL5 channel to update the latest news from me SMC è un approccio al trading che aiuta i trader a identificare le zone di liquidità, le posizioni istituzionali degli ordini e i principali punti di svolta del mercato. Sfruttando i principi SMC, i trader possono navigare nel mercato in modo più efficace, trovando punti di ingresso e us

EXTREME POI Indicator Join the telegram community for an exciting trading journey. https://t.me/automated_TLabs Professional Trading Indicator for MetaTrader 5/Metatrader 4
EXTREME POI is an advanced institutional-grade trading indicator designed to identify high-probability Points of Interest (POI) based on Smart Money Concepts. The indicator combines multiple sophisticated techniques to detect areas where institutional traders are likely to enter the market.
Working Pairs GOLD, EURUSD,
FREE

The SMC Market Structure indicator tracks key price action shifts using Smart Money Concepts (SMC), helping traders identify institutional behavior and overall trend direction.
It automatically detects and displays: Break of Structure (BOS) – Signals continuation of trend Change of Character (CHOCH) – Indicates potential reversal Swing Highs and Lows – Used to define market structure and directional bias
Each structural event is clearly marked on the chart, allowing traders to visualize momentu
FREE

Simboli: USDCHF, USDJPY, XAUUSD, GBPUSD, EURUSD, AUDUSD, GBPJPY (A mo USDCHF_H1 )
Timeframe: M15, H1, H4, D1
Caratteristiche principali: Nessun repaint, nessun ritardo, segnale direzionale, conferme multiple
Sicurezza: I segnali includono stop loss, take profit e rispettano la regola rischio/rendimento
Include: Scanner multi-timeframe gratuito (Dopo aver acquistato questo prodotto, inviami semplicemente uno screenshot tramite messaggio privato e ti invierò personalmente il file dello scanner

RiskKILLER_AI Navigator è un Assistente di Direzione di Mercato e Strategia Multi-timeframe basato sull'IA. La performance nel trading consiste nel comprendere il mercato come fanno i professionisti. Questo è esattamente ciò che offre il RiskKILLER_AI Navigator : Ottieni insight di livello istituzionale con analisi di trend, sentiment e macro driven dall'IA esterna a MQL5 , personalizzata per il tuo stile di trading. Dopo l'acquisto, per ottenere il Manuale Utente: 1. pubblica un commento per ri
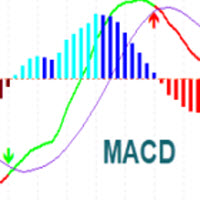
MACD Indicator It has MACD line, Signal line, and Histogram. The Histogram has 4 colors based on Direction Above and Below the Zero Line, showing its movement direction as simple as possible. Allows Show MACD & Signal Line, Show Change In color of MACD Line based on cross of Signal Line. Show Dots at Cross of MacD and Signal Line, Turn on and off Histogram. Enjoy your trading experience, and feel free to share your comments and reviews.
If you are interested in this indicator, you might be i
FREE

Advanced Stochastic Scalper MT5 is a professional indicator based on the popular Stochastic Oscillator. Advanced Stochastic Scalper is an oscillator with dynamic overbought and oversold levels, while in the standard Stochastic Oscillator, these levels are static and do not change. This allows Advanced Stochastic Scalper to adapt to the ever-changing market. When a buy or a sell signal appears, an arrow is drawn on the chart and an alert is triggered allowing you to open a position in a timely ma
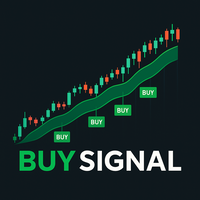
This indicator has been developed as an analytical tool based on exponential moving averages (EMA) . Its purpose is to provide additional insights into market dynamics using two exponential moving averages (EMA) and one smoothed exponential moving average (SMMA) . The indicator can be applied to different financial instruments and timeframes, depending on user preferences. Some traders use it on 30-second charts , complementing it with a 2-minute chart . How the Indicator Works The analysis is b
FREE

Il popolare indicatore "SuperTrend" è uno strumento di analisi tecnica che aiuta a identificare la direzione di un trend e i possibili punti di ingresso o uscita nei mercati finanziari. L'indicatore si basa sulla Media dell'Intervallo Effettivo (ATR), che misura la volatilità del mercato in base agli intervalli di prezzo. È gratuito su altre piattaforme e qui non c'è motivo per cui non dovrebbe esserlo! Viene comunemente utilizzato in tre modi: Per identificare il trend attuale: quando il prezzo
FREE

Smart Structure Concepts MT5 is an all-in-one Smart Money Concepts indicator created to help traders visually read institutional structure and understand why each movement occurs. Unlike most indicators on the Market, this system does not only draw patterns or zones. It teaches.
Every visual element (BOS, CHoCH, OB, FVG, EQH, EQL, PDH, PDL, etc.) includes educational tooltips that explain the concept and the suggested trader action (buy, sell, or wait).
These on-chart explanations make it perfe
FREE

Candle Time CountDown By BokaroTraderFx The Candle Timer Countdown Indicator is a versatile tool designed for the MetaTrader 5 (MT5) trading platform. It provides traders with a visual countdown of the remaining time for the current candle on a chart. The key features include:
Customizable Position: Place the countdown timer in any corner of the chart for optimal visibility. Default Text Color: Set to red for clear visibility, with options for further customization. Minimal Display: Shows only
FREE

Ti presentiamo Quantum Heiken Ashi PRO Progettate per fornire informazioni chiare sulle tendenze del mercato, le candele Heiken Ashi sono rinomate per la loro capacità di filtrare il rumore ed eliminare i falsi segnali. Dì addio alle confuse fluttuazioni dei prezzi e dai il benvenuto a una rappresentazione grafica più fluida e affidabile. Ciò che rende il Quantum Heiken Ashi PRO davvero unico è la sua formula innovativa, che trasforma i dati tradizionali delle candele in barre colorate di faci

Hull Moving Average (HMA) is well-deservedly popular among traders because of the effective averaging of market noise and a relatively small delay. The current MetaTrader 5 version changes its color when the movement direction changes. Sound and text signals are available. It also supports sending email and push messages. It is possible to trigger a signal on the current incomplete bar, although such a signal may be canceled before completion if conditions are no longer appropriate. One of the p
FREE

VM Heiken Ashi Pro
Heiken-Ashi smussato (HMA o EMA) per filtrare il rumore e generare segnali BUY/SELL chiari, non repaint (opzionale ConfirmOnClosedBar). Mostra le candele HA sul grafico (le candele originali possono essere nascoste), posizionamento delle frecce tramite ATR o offset fisso, invia avvisi (popup, email, push) con gestione anti-spam. Scopo principale
Convertire le candele grezze in Heiken-Ashi smussate per rilevare cambi di colore (bear to bull / bull to bear) e disegnare frecce

MACD divergence indicator finds divergences between price chart and MACD indicator and informs you with alerts (popup, mobile notification or email) . Its main use is to find trend reversals in the chart. Always use the divergence indicators with other technical assets like support resistance zones, candlestick patterns and price action to have a higher possibility to find trend reversals. Three confirmation type for MACD divergences: MACD line cross zero level Price returns to previous H/L Crea
FREE
Il MetaTrader Market è un negozio online unico di robot di trading e indicatori tecnici.
Leggi il promemoria utente di MQL5.community per saperne di più sui servizi unici che offriamo ai trader: copia dei segnali di trading, applicazioni personalizzate sviluppate da freelance, pagamenti automatici tramite il Sistema di Pagamento e il MQL5 Cloud Network.
Ti stai perdendo delle opportunità di trading:
- App di trading gratuite
- Oltre 8.000 segnali per il copy trading
- Notizie economiche per esplorare i mercati finanziari
Registrazione
Accedi
Se non hai un account, registrati
Consenti l'uso dei cookie per accedere al sito MQL5.com.
Abilita le impostazioni necessarie nel browser, altrimenti non sarà possibile accedere.